
BANANA
Banana
| تریدر | نوع سیگنال | حد سود/ضرر | زمان انتشار | مشاهده پیام |
|---|---|---|---|---|
No results found. | ||||
Price Chart of Banana
سود 3 Months :
سیگنالهای Banana
Filter
Sort messages by
Trader Type
Time Frame

BandForBands
موز به کجا میرود؟ الگوی کف دوتایی و هدف صعودی ۴۸ دلاری!
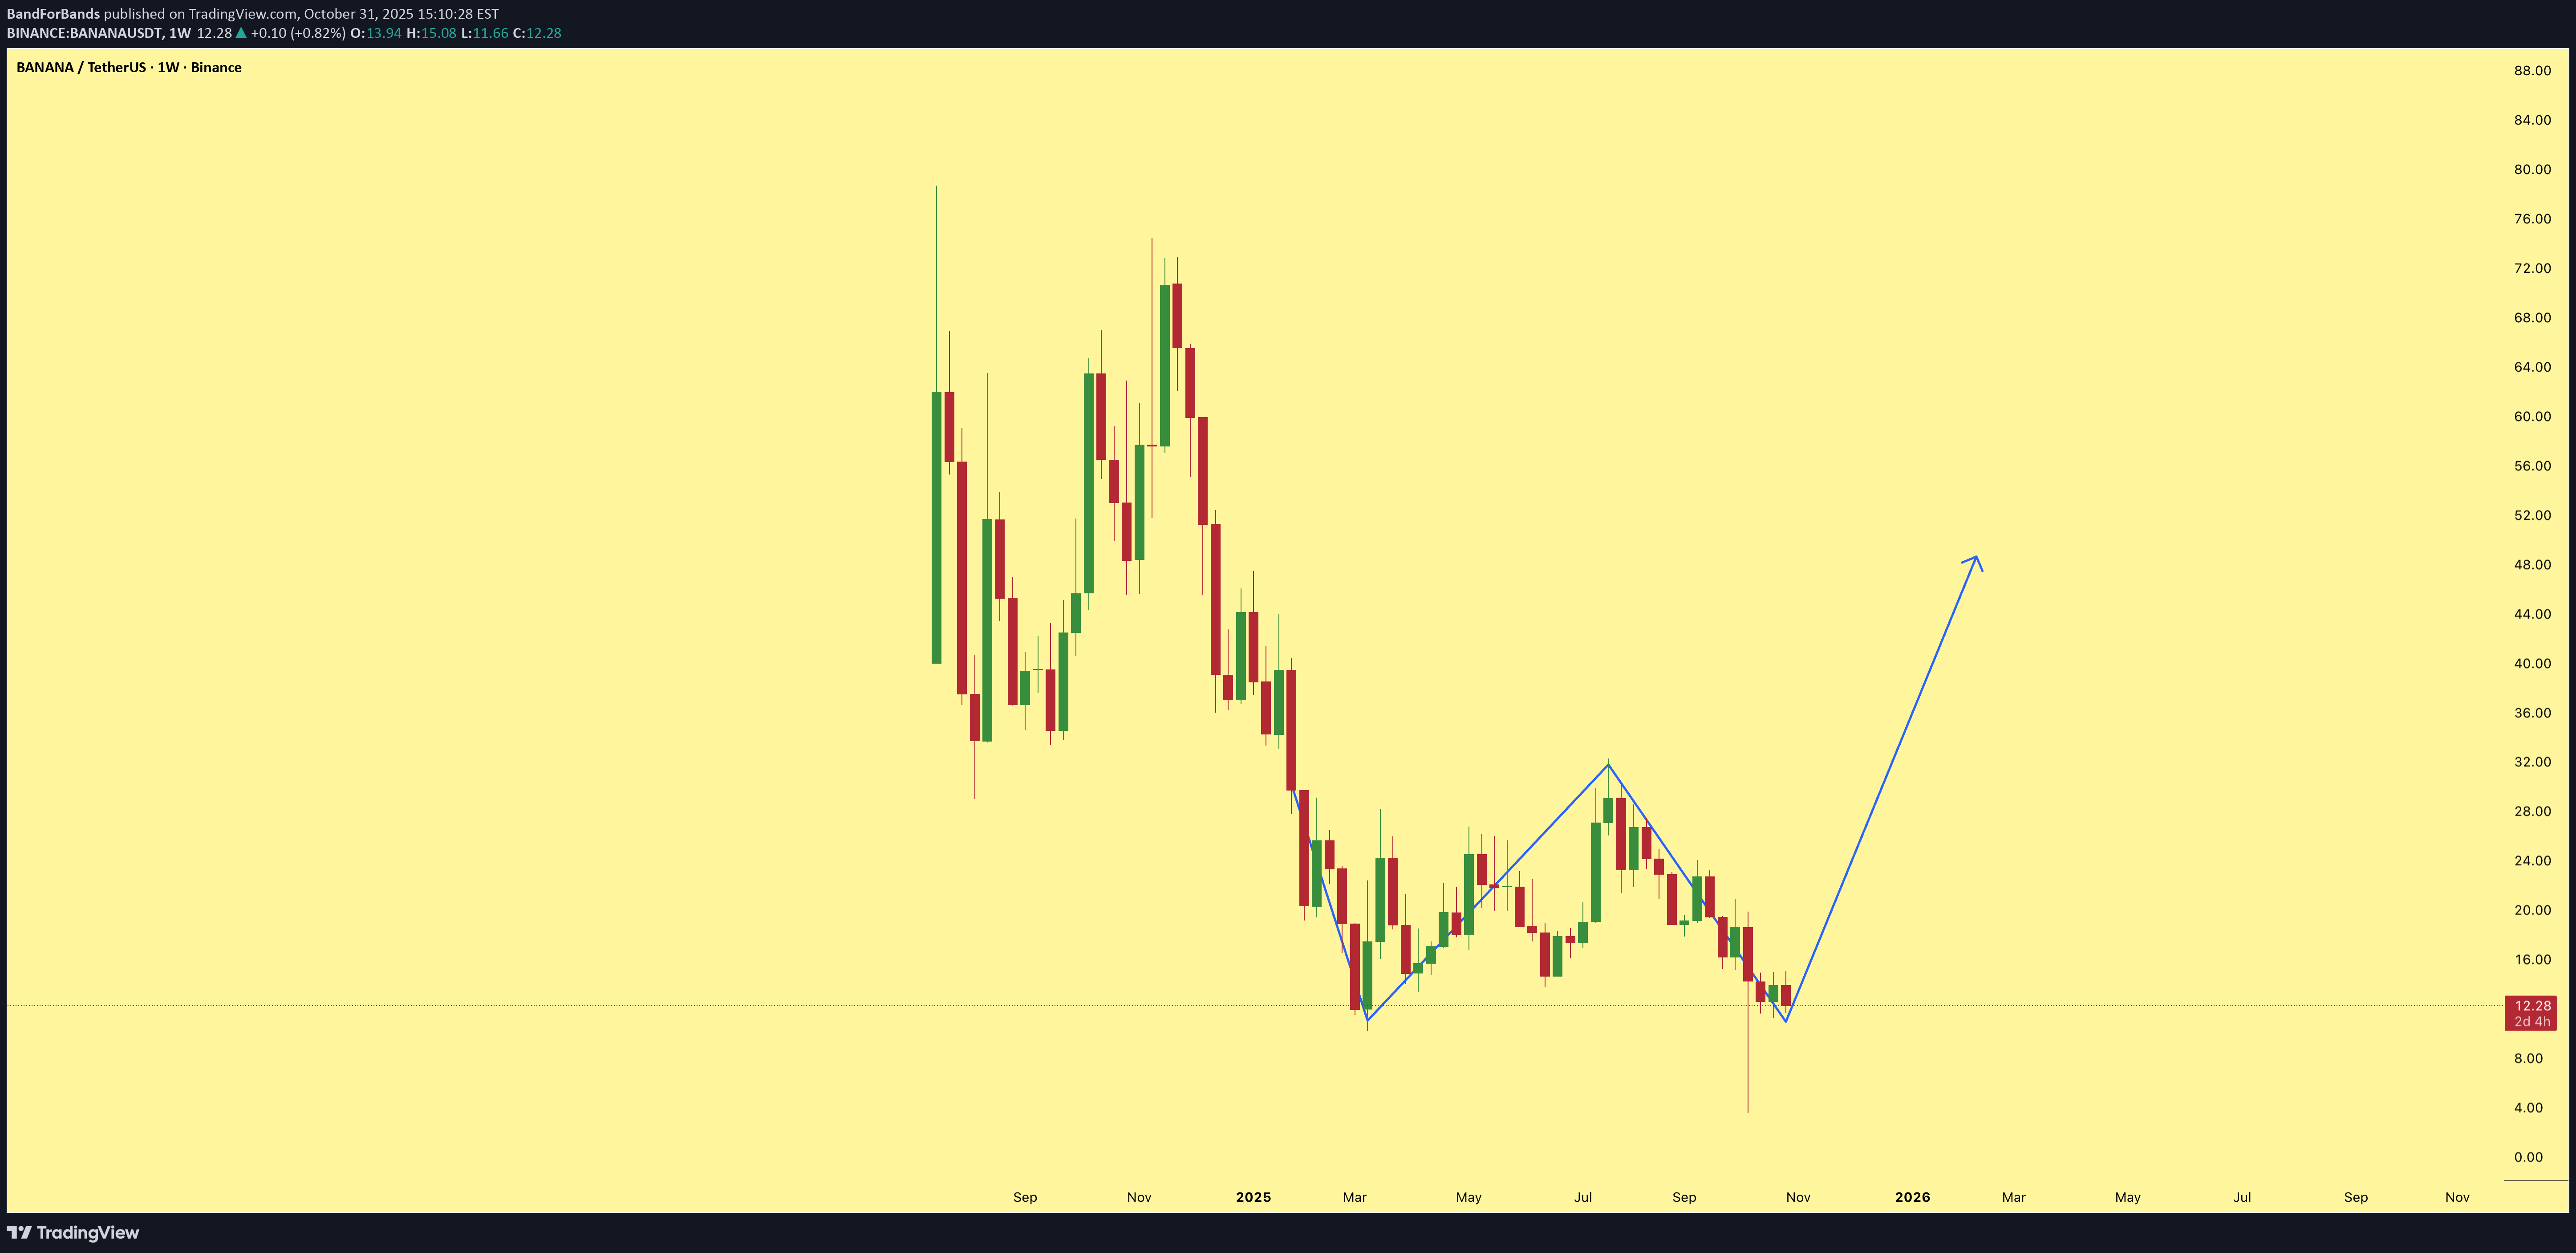
$BANANA has formed a clean double bottom pattern, signaling a strong potential reversal. The measured target for this breakout sits at $48. Momentum is building, and the structure looks primed for continuation to the upside.

Cryptojobs
تحلیل شوکهکننده قیمت موز: آیا سقوط به ۱۰ دلار در راه است؟
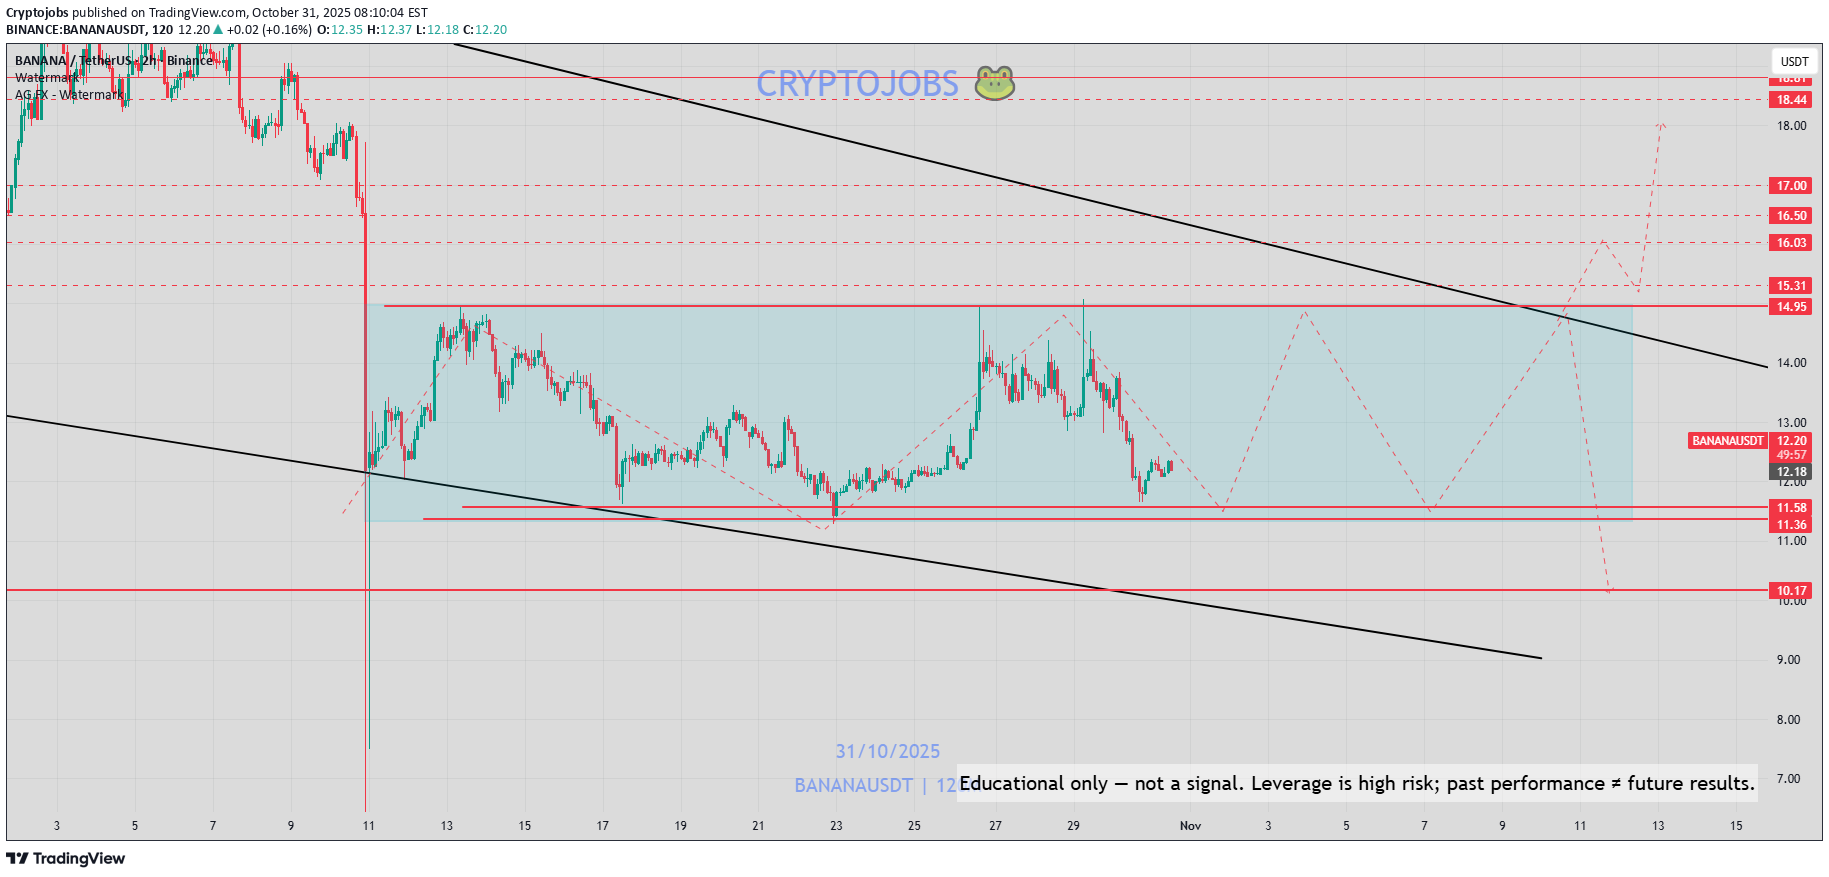
#banana - price analysis: Technically; neutral on the daily basis: 13.50 - 11.70$ Bearish on the weekly basis, but prices seems to be moving between the 15.00 - 11.50$ levels (3 week RANGE High + Low). My bias: Bearish HTF, and 10.00$ demand zone could be visit again, At the opposite, bottom could be in if price keep consolidating inside the blue box, but Bulls must flip & confirmp breakout above 15.00$ & daily downtrend to regain momentum. Very tricky short term PA, big move is probably cooking 💣

Asif_Brain_Waves
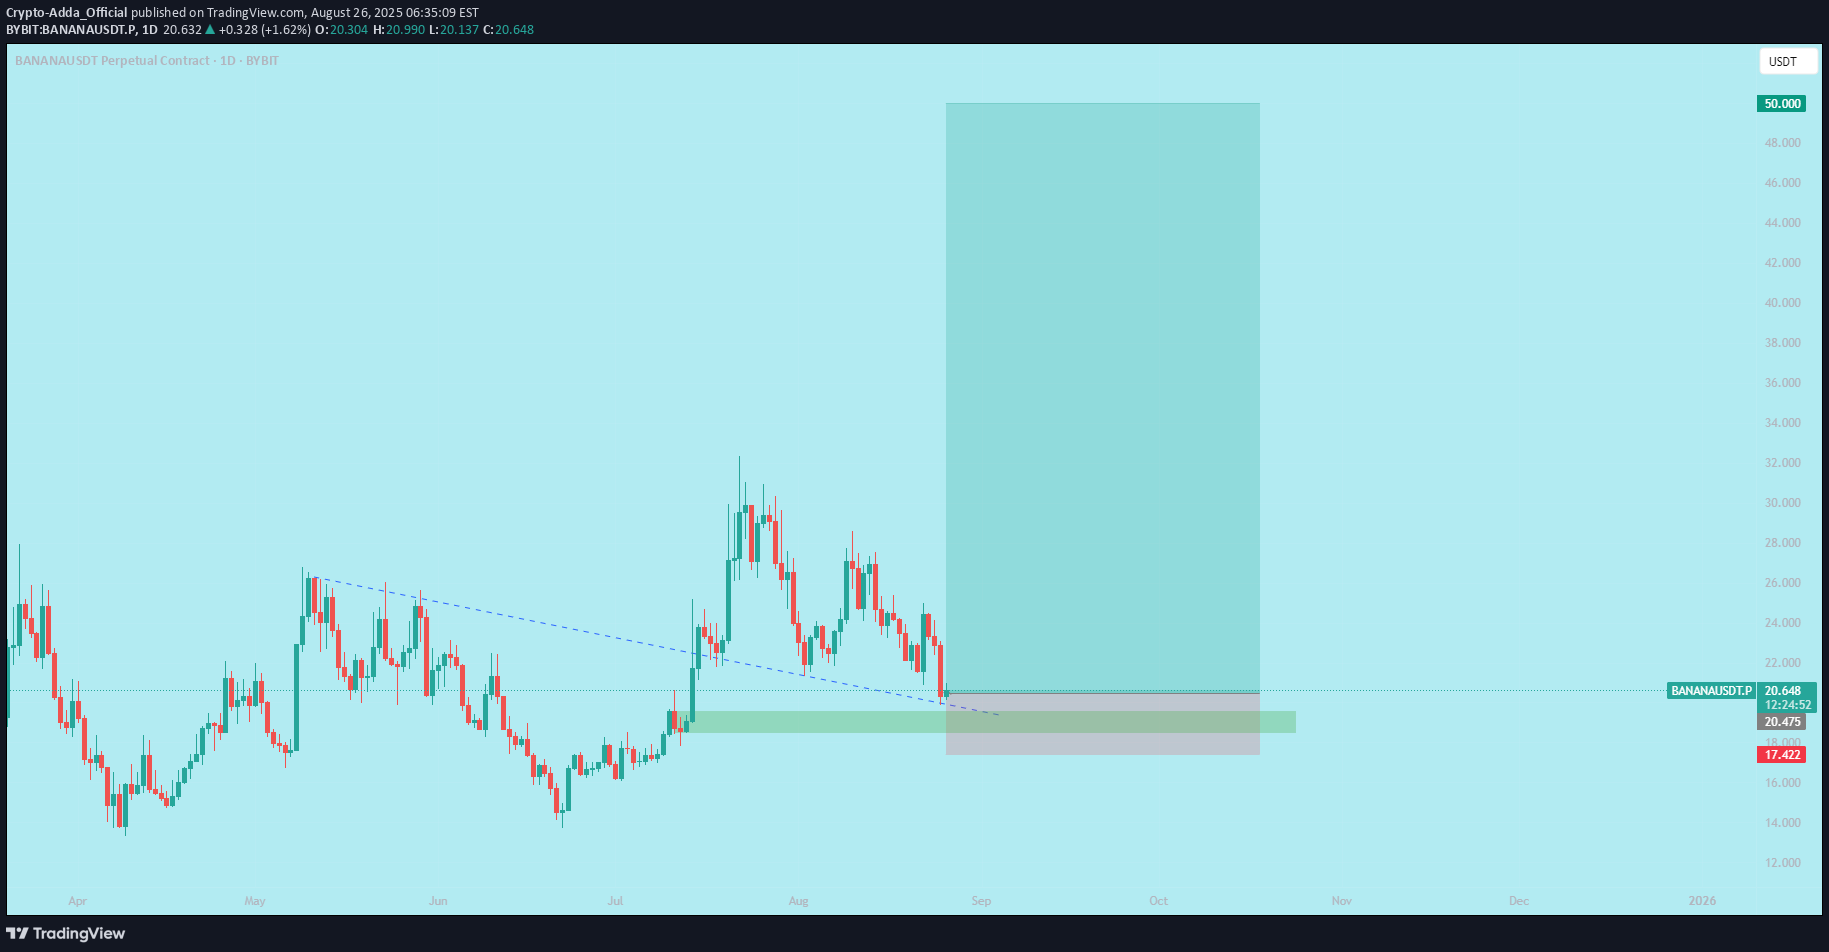
برنامه خرید BANANA/USDT: صبر؛ سلاح مخفی تریدر برای رسیدن به هدف ۳۵.۷۰۰!
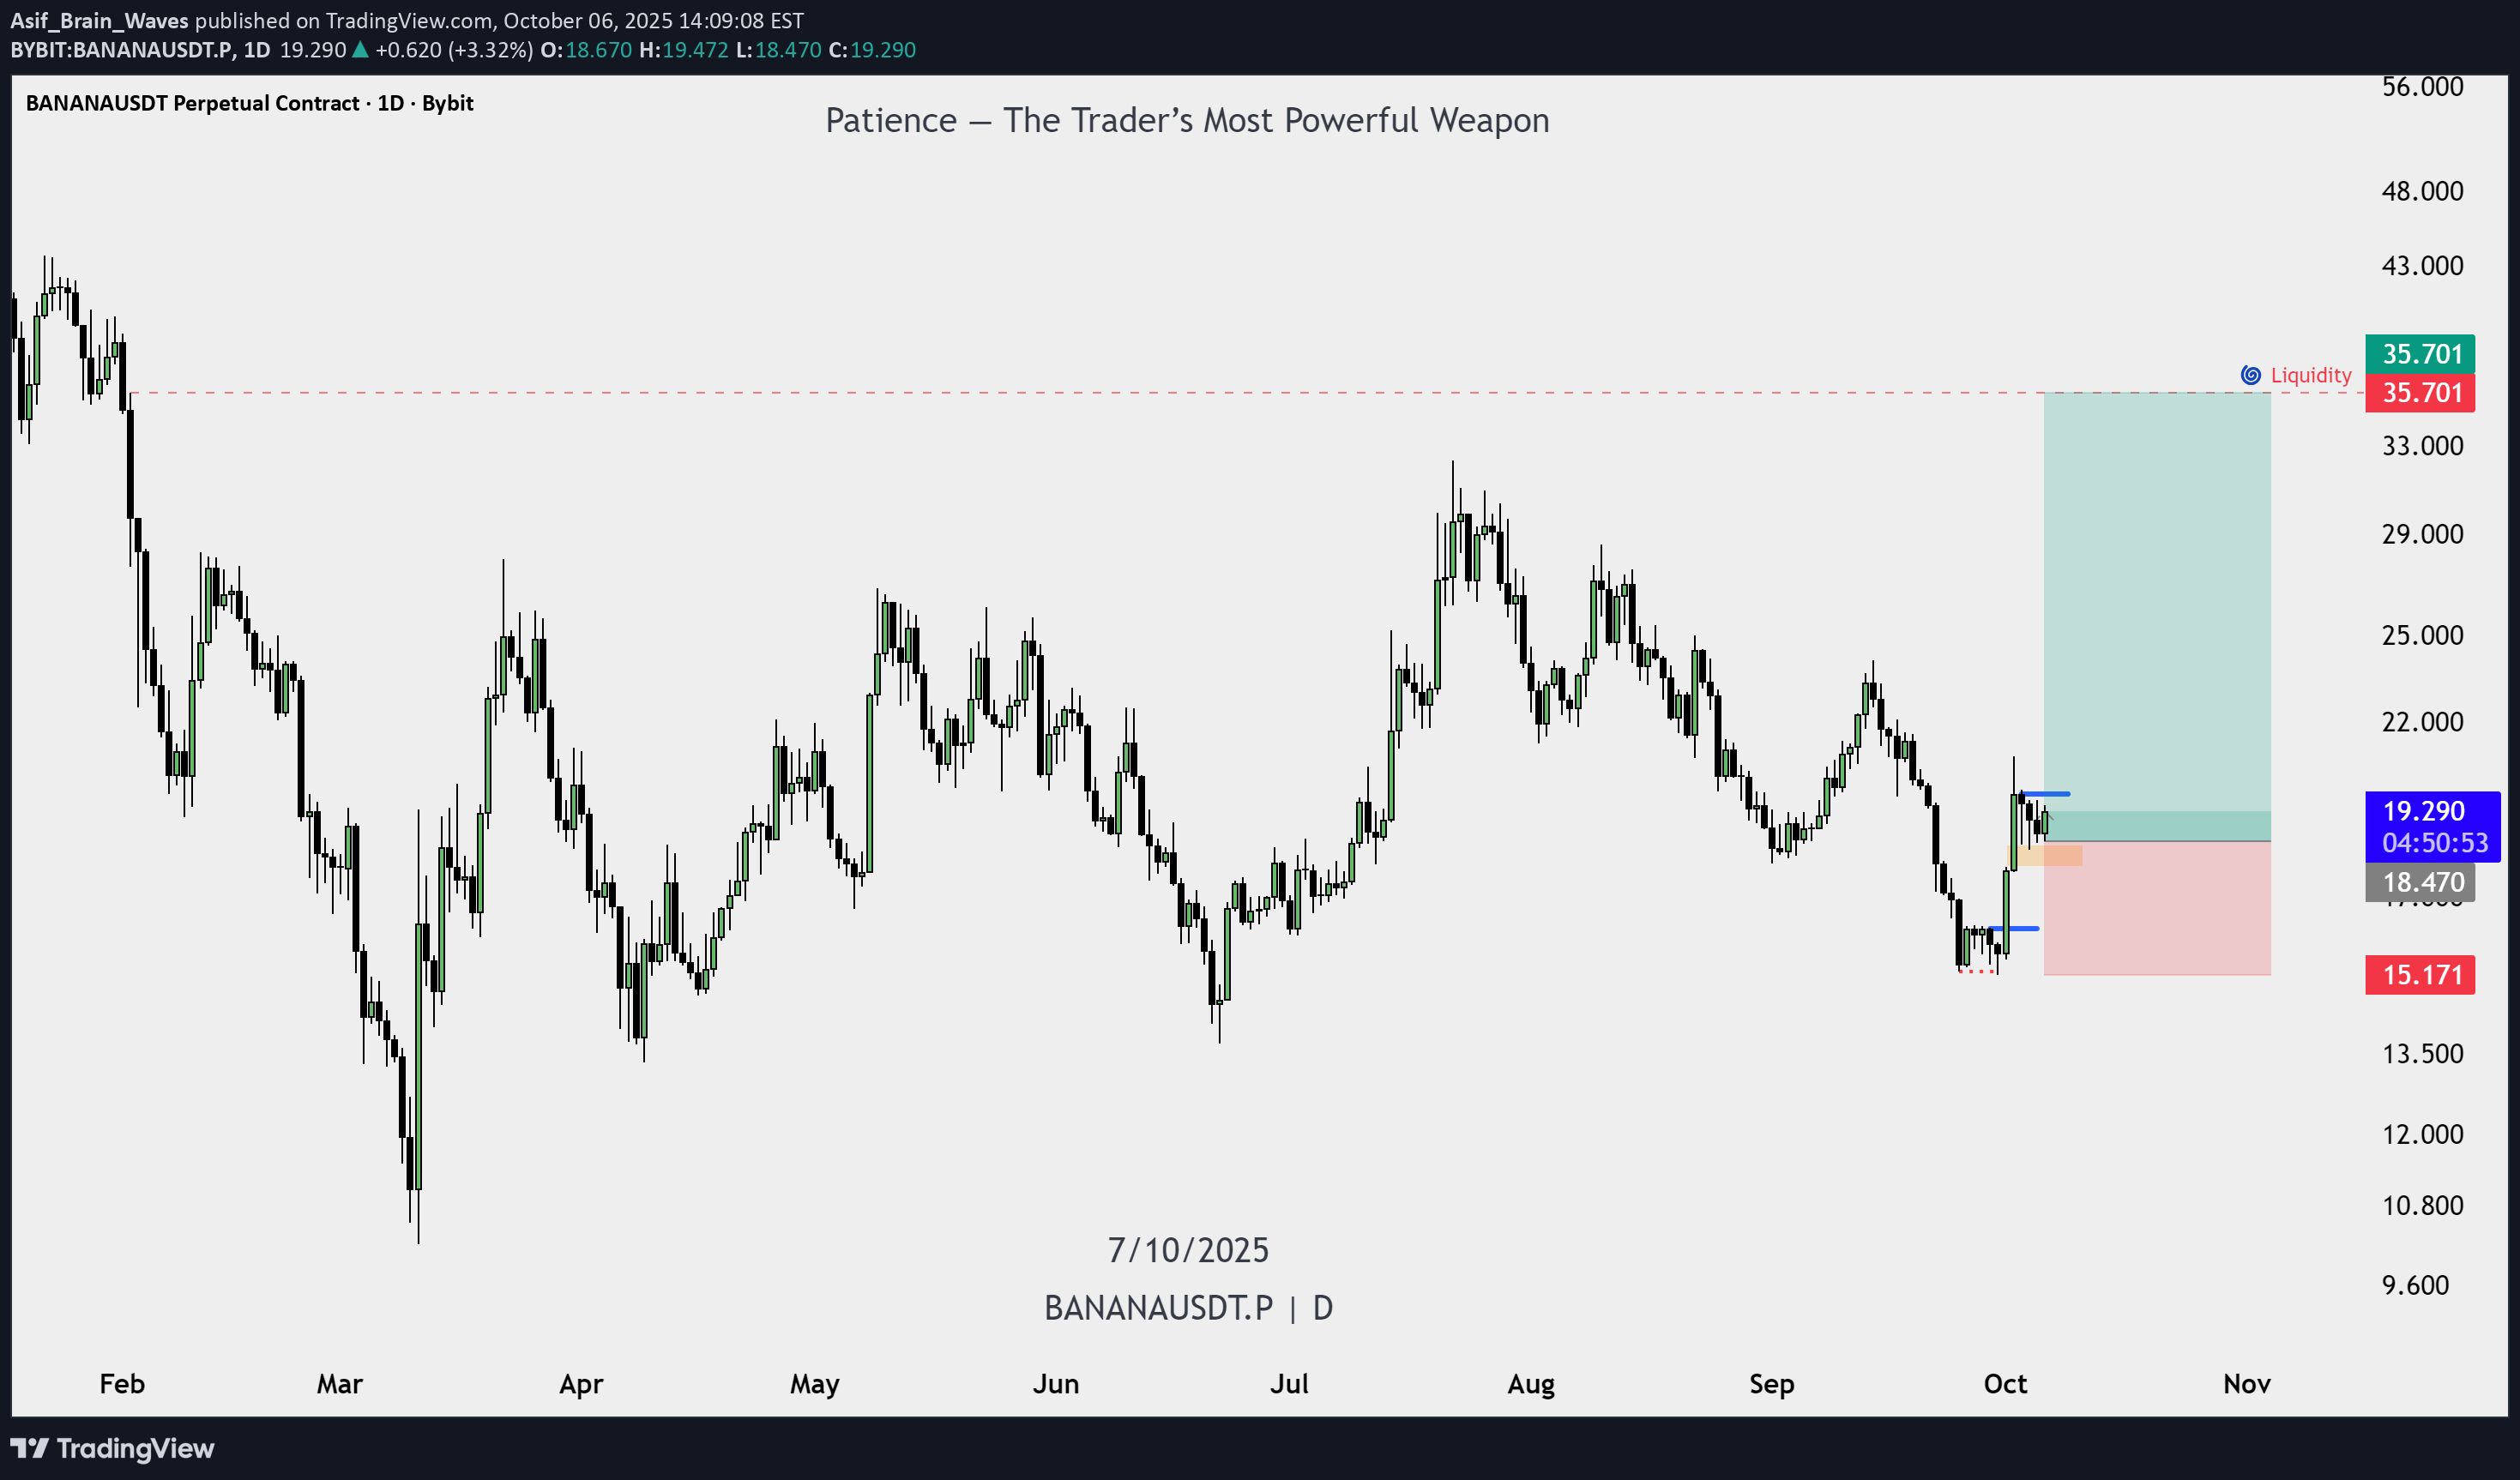
Buy Plan – BANANAUSDT (Daily Timeframe) Date: 7 October 2025 Title: Patience — The Trader’s Most Powerful Weapon 1. Bias: Market shows strong bullish recovery after sweeping previous lows. Daily structure suggests potential continuation toward upper liquidity at 35.701. 2. Point of Interest (POI): Price tapped into a bullish Fair Value Gap (FVG) around 18.470 – 19.300 zone. This area acts as a discount entry zone inside the new dealing range. 3. Entry Plan: Wait for confirmation on lower timeframe (H4 or H1) — a bullish FVG or breaker block within the daily POI. Enter long after a clean break of short-term swing high with candle closure. 4. Stop Loss: Below the POI at 15.171, protecting against deeper retracement. 5. Target: Primary target: external liquidity around 35.701. Risk-to-Reward: approximately 1 : 4.5 6. Confirmation Checklist: ✅ Price rejected from higher timeframe discount zone ✅ Fair Value Gap respected ✅ No bearish displacement after reaction ✅ Lower timeframe bullish structure shift 7. Notes: Patience is key — don’t enter without clear confirmation. Avoid emotional entries; let the setup mature naturally.

CryptoWithJames
تحلیل فنی BANANA: شکستن گوه نزولی و هدف ۱.۴۰ دلاری (سود ۶۰٪!)
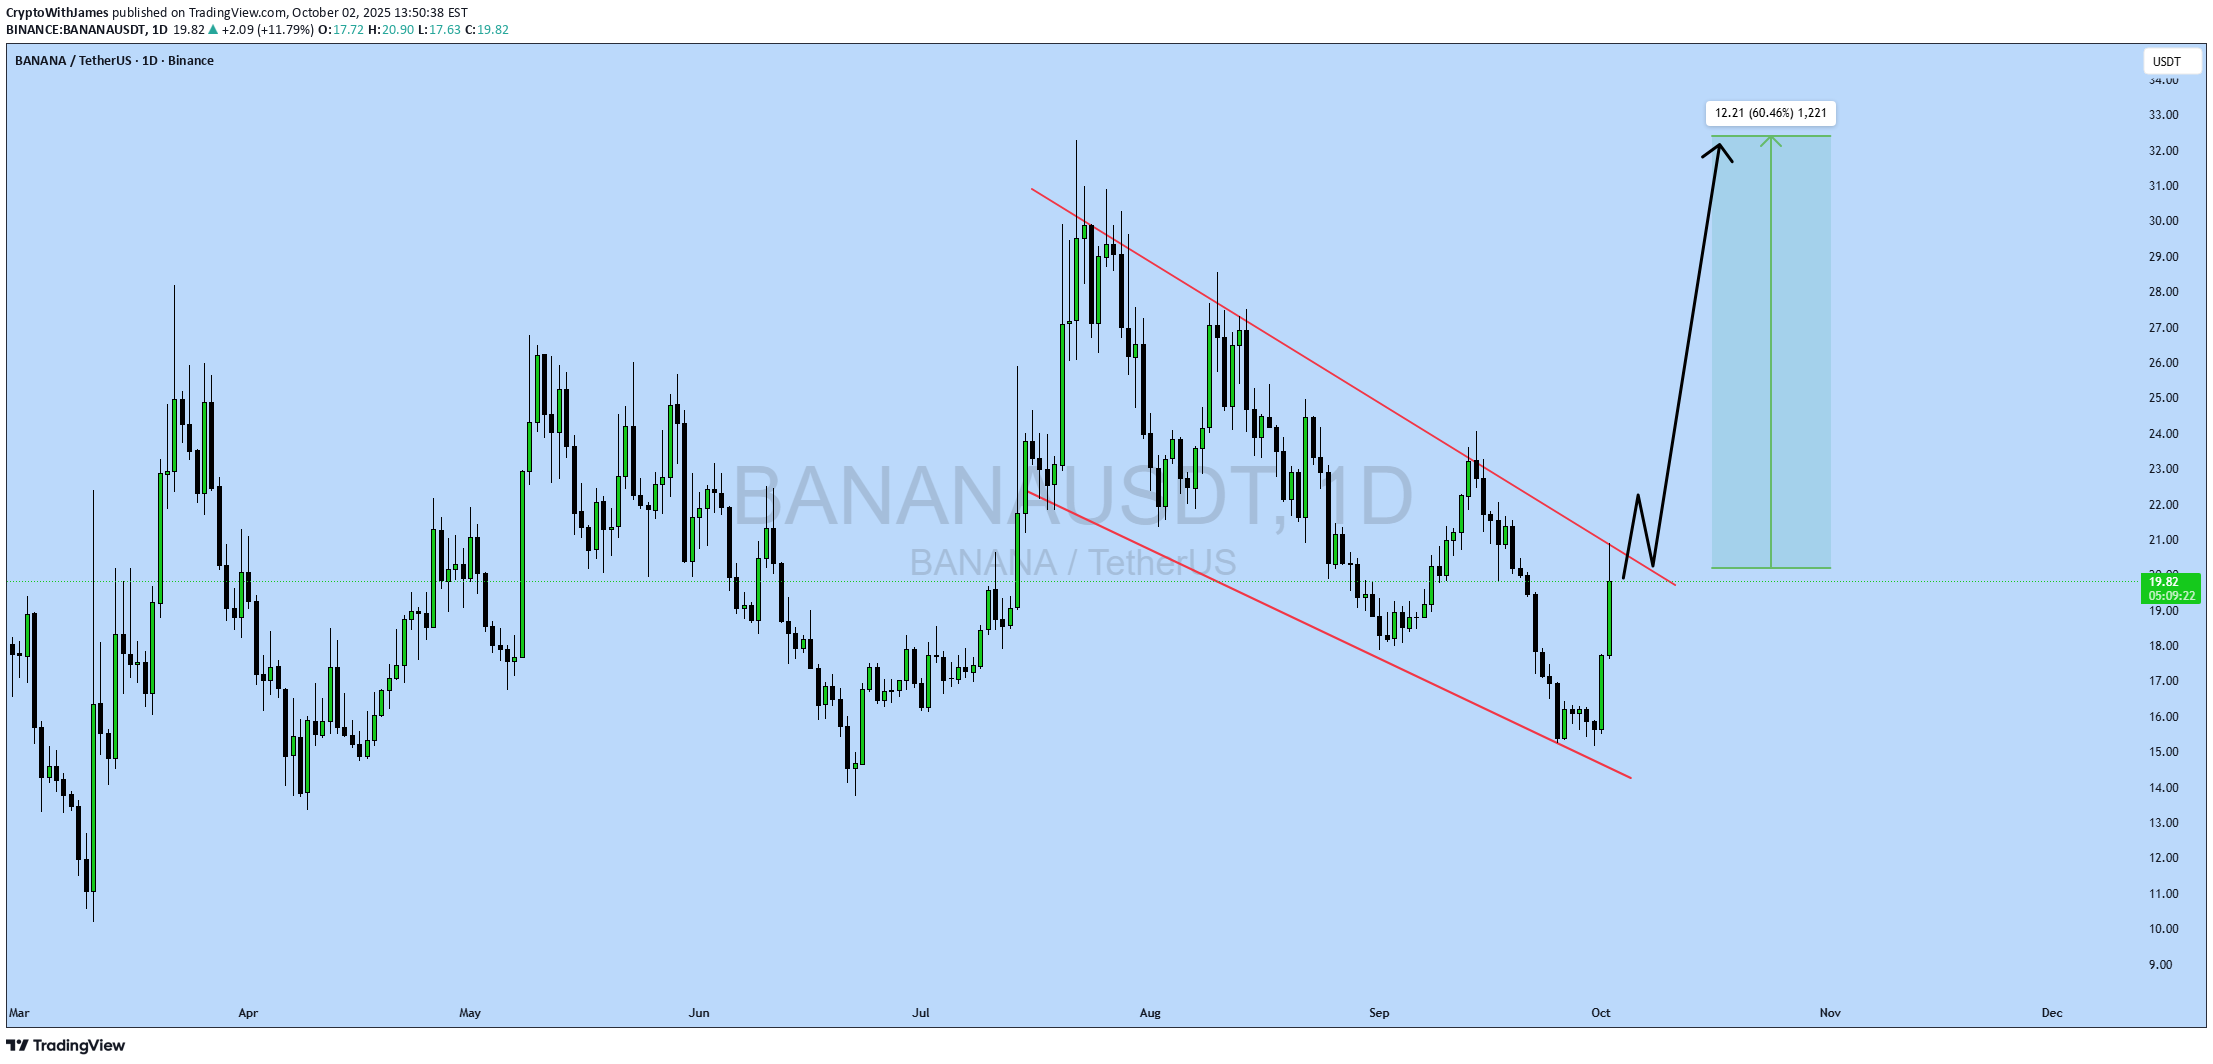
#BANANA UPDATE BANANA Technical Setup Pattern: Bullish falling wedge breakout Current Price: $0.8730 Target Price: $1.4020 Target % Gain: 60.62% $BANANA is breaking out of a falling wedge pattern on the 1D timeframe. The breakout suggests bullish momentum with a potential move toward $1.40, offering over 60% upside. Structure supports continuation if buyers sustain control. Always use proper risk management.

Alpha-GoldFX
تحلیل شگفتانگیز بانانا: آیا پتانسیل رشد ۱۰۰ درصدی در راه است؟
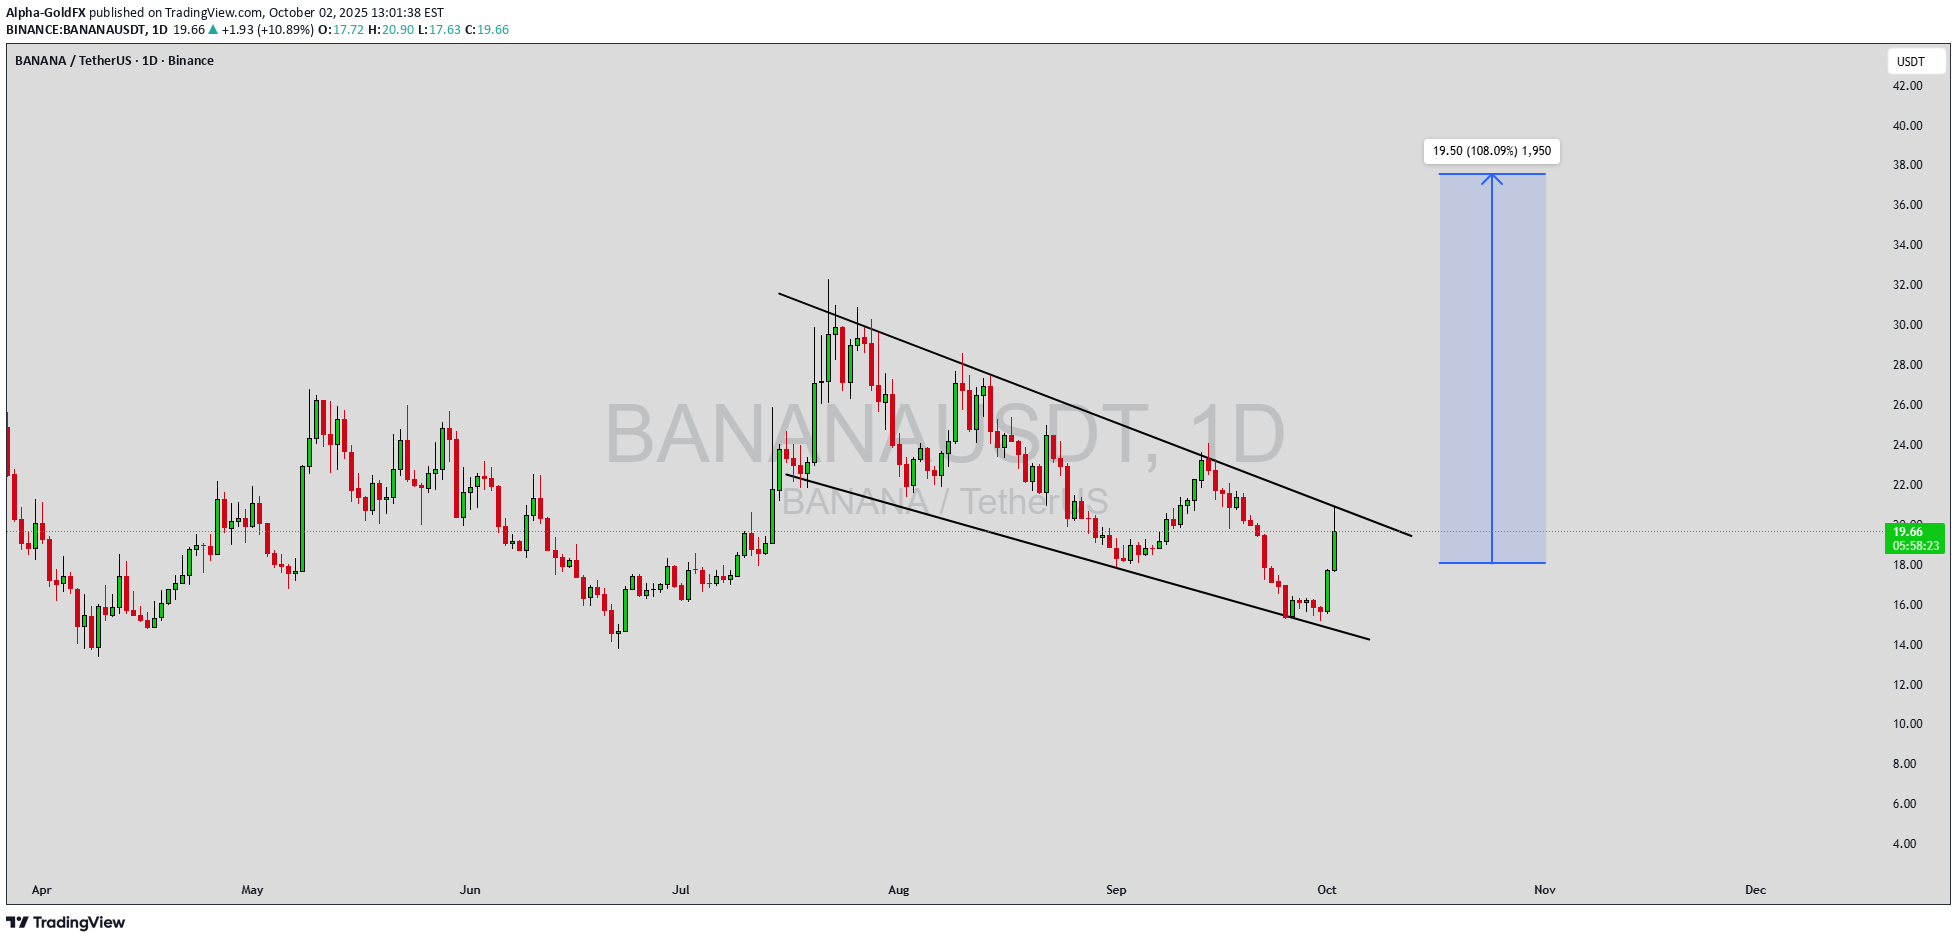
BANANAUSDT is currently trading within a falling wedge pattern, a bullish formation that often signals the end of a downtrend and the beginning of a strong reversal. This setup shows price consolidating in a narrowing range, while selling pressure weakens and buying interest steadily builds. With good volume backing up this move, the conditions are aligning for a significant breakout. The falling wedge breakout projection points to potential gains of 90% to 100%+, making this pair an attractive setup for traders looking for strong upward momentum. The volume confirmation suggests that accumulation is already happening in the market, which could fuel a sharp rally once resistance is broken. This aligns with the broader trend where investors are showing renewed confidence in the project. With increasing investor attention and strong technical structure, BANANAUSDT looks well-positioned for a bullish move in the coming sessions. If momentum continues to build, the coin could quickly rally toward its upside targets, offering favorable risk-to-reward opportunities for traders who catch the breakout early. ✅ Show your support by hitting the like button and ✅ Leaving a comment below! (What is You opinion about this Coin) Your feedback and engagement keep me inspired to share more insightful market analysis with you!

Bithereum_io
پیشبینی انفجاری قیمت بانانا (BANANAUSDT): آیا زمان خروج از کانال نزولی فرا رسیده است؟
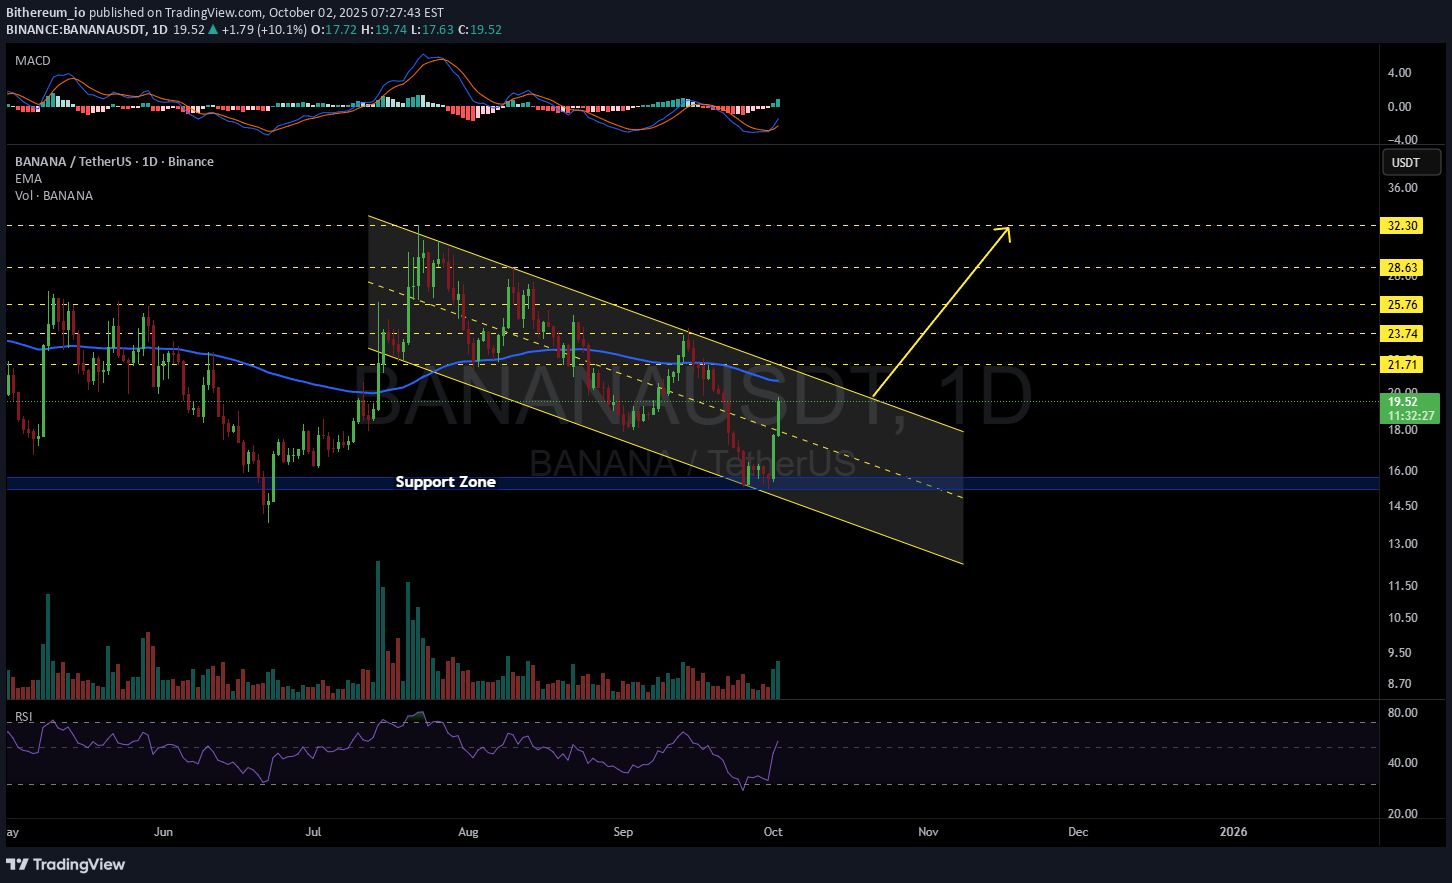
#BANANA is moving inside a descending channel on the daily chart. For a bullish continuation, it must break above the channel resistance and the daily EMA100. In that case, the potential targets are: 🎯 $21.71 🎯 $23.74 🎯 $25.76 🎯 $28.63 🎯 $32.30 ⚠️ Always remember to use a tight stop-loss and follow proper risk management.

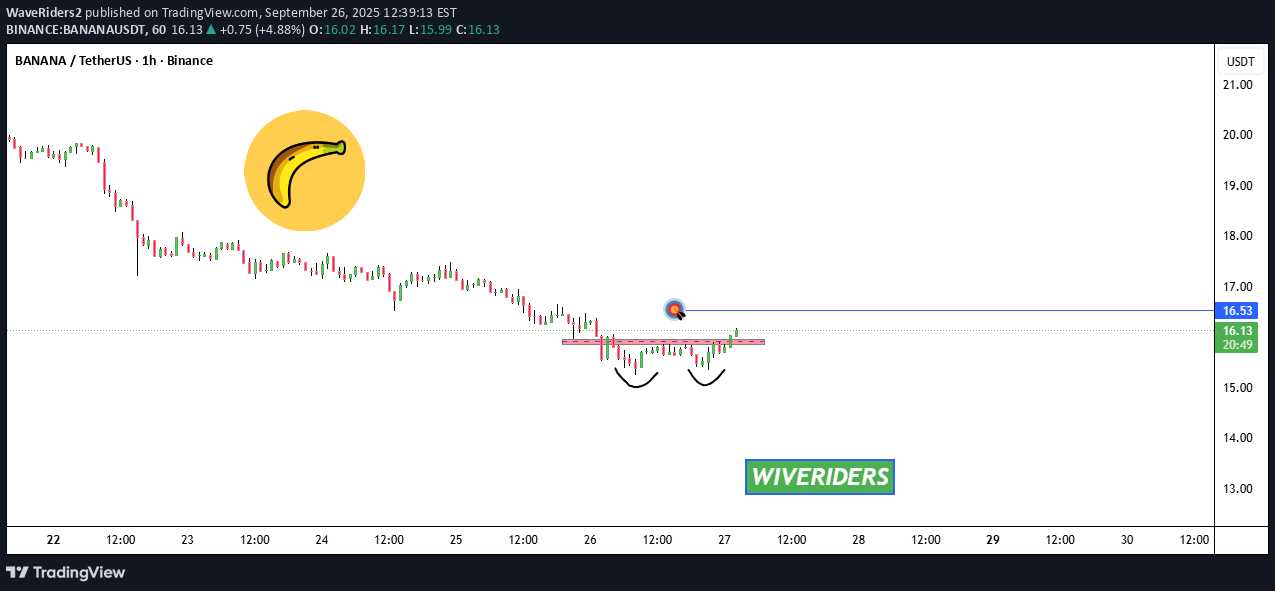
WaveRiders2
BANANA has formed a bullish Double Bottom pattern

milad-bit24
BANANA/USDT Technical (4H Timeframe)
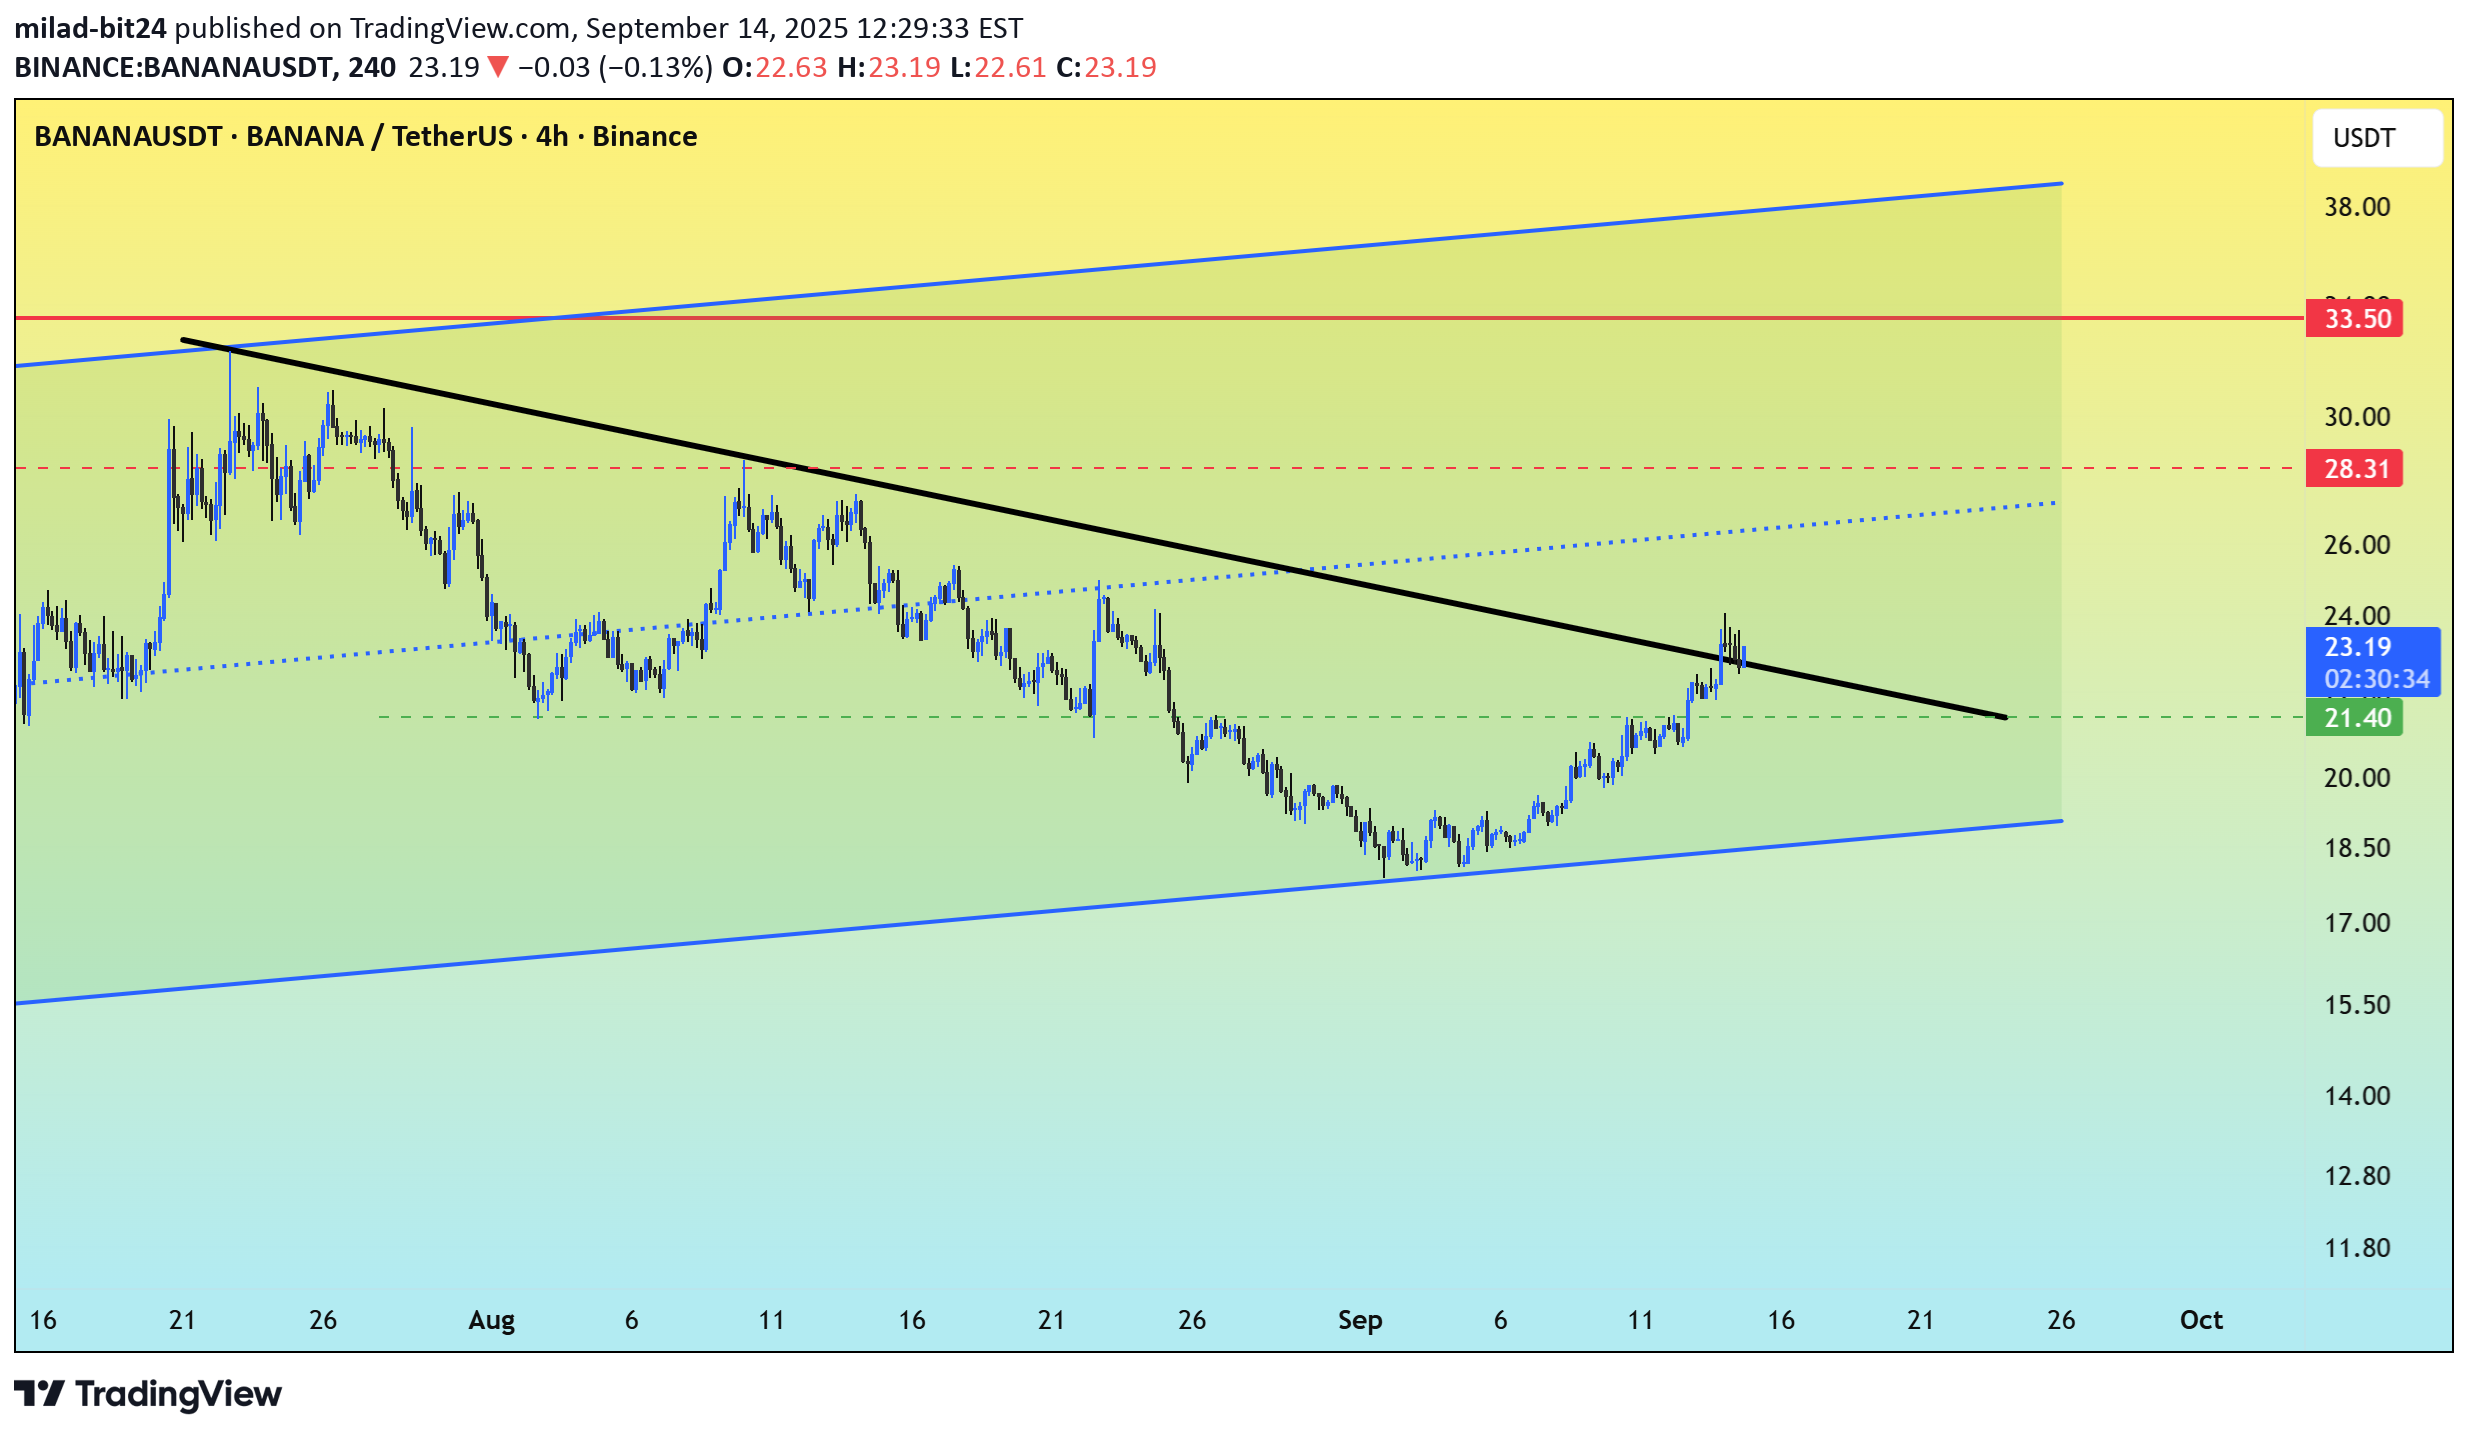
The price is currently moving within a blue ascending channel, suggesting a short-term bullish trend. A descending black trendline connects previous lower highs, acting as dynamic resistance. The price is now testing this line from below, which could signal a potential breakout if momentum continues. Bullish Case: A confirmed breakout above the descending trendline could lead to a rally toward $28.31 and possibly $33.50. As long as price stays within the ascending channel and above $21.40, the bullish momentum remains intact. Bearish Risks: Rejection at the descending trendline may lead to a pullback toward $21.40. A breakdown below $21.40 would weaken the bullish structure and could trigger a drop toward $15.50.

Crypto-Adda_Official
BANANA soars past to $50
$BANANA 🍌 Soars past $50 How Trendline Support Trading Works Identify the Trend: Look at the price chart of a cryptocurrency (e.g., Bitcoin or Ethereum) on platforms like Trading View. In an uptrend, draw a trendline by connecting at least two higher lows (points where the price dipped but didn’t break lower). Use charting tools to ensure accuracy, as eyeballing can lead to errors. Confirm the Support: A valid trendline should be touched by the price at least three times to confirm it’s a reliable support level. The more times the price respects the trendline (bounces off it), the stronger the support. Trading the Trendline Support: Entry Point: When the price approaches or touches the trendline in an uptrend, it’s a potential buy signal, as the price is likely to bounce upward. Stop-Loss: Place a stop-loss just below the trendline to protect against a breakout (when the price breaks below the trendline, indicating a potential trend reversal). Take-Profit: Set a target at a previous high (resistance) or use indicators like Fibonacci extensions to estimate where the price might go. Validate with Other Indicators: Use additional tools like volume (high buying volume near the trendline confirms support), RSI (to check if the asset is oversold), or candlestick patterns (like bullish engulfing) to increase confidence in the trade. For example, if Bitcoin’s price touches a rising trendline at $60,000 with high volume and an RSI below 30, it’s a stronger buy signal. Monitor for Breakouts: If the price breaks below the trendline with strong volume, it may signal a trend reversal or a new downtrend. This could be a signal to exit or consider a short position (betting on price decline).
Asif_Brain_Waves
bananausdt Price reacted from HTF POI
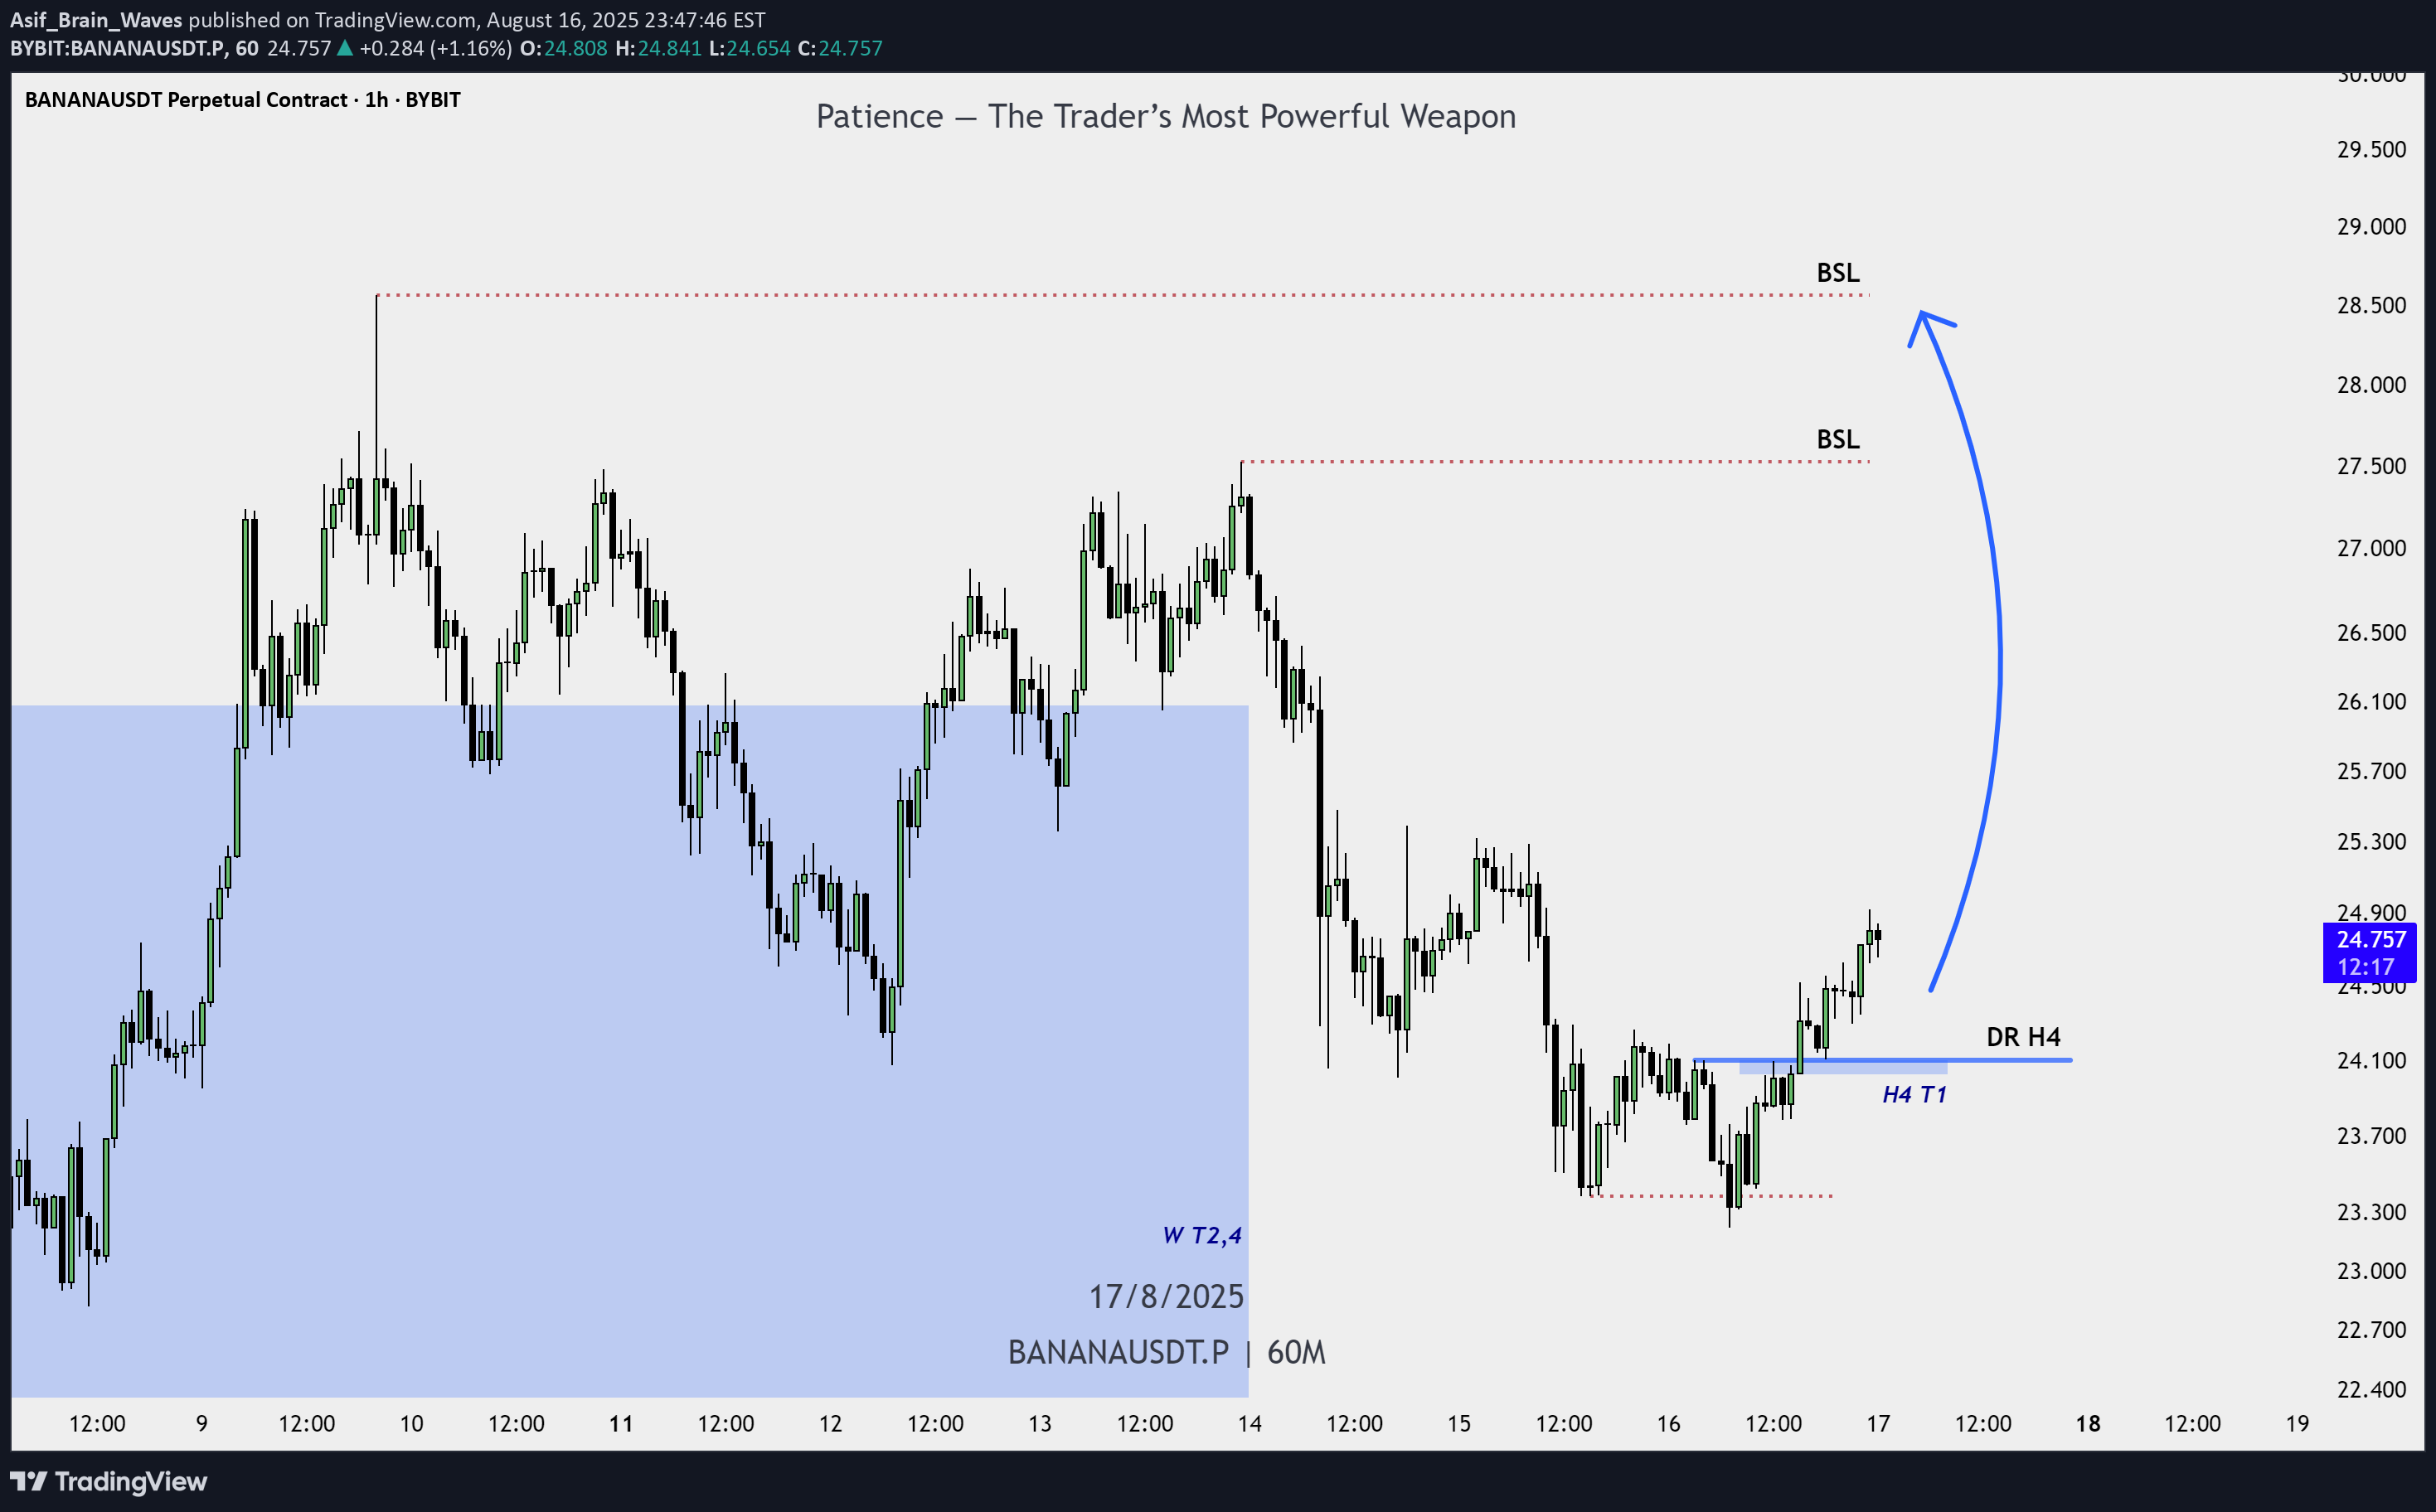
📌 Buy Plan Price reacted from HTF POI (weekly zone). Dealing Range (H4) has formed, confirming bullish setup. Entry: from inside DR H4 or on breakout. SL: below DR low. TP1: first structure above DR. TP2 & TP3: upside BSLs. Move SL to breakeven after TP1.
Disclaimer
Any content and materials included in Sahmeto's website and official communication channels are a compilation of personal opinions and analyses and are not binding. They do not constitute any recommendation for buying, selling, entering or exiting the stock market and cryptocurrency market. Also, all news and analyses included in the website and channels are merely republished information from official and unofficial domestic and foreign sources, and it is obvious that users of the said content are responsible for following up and ensuring the authenticity and accuracy of the materials. Therefore, while disclaiming responsibility, it is declared that the responsibility for any decision-making, action, and potential profit and loss in the capital market and cryptocurrency market lies with the trader.