
AMZNX
Amazon tokenized stock (xStock)
| تریدر | نوع سیگنال | حد سود/ضرر | زمان انتشار | مشاهده پیام |
|---|---|---|---|---|
 RB_TRank: 584 | خرید | حد سود: تعیین نشده حد ضرر: تعیین نشده | 12/18/2025 | |
 isahebdadiRank: 1036 | خرید | حد سود: تعیین نشده حد ضرر: تعیین نشده | 12/12/2025 | |
 NOBSForexRank: 3811 | فروش | حد سود: تعیین نشده حد ضرر: تعیین نشده | 12/17/2025 | |
 bbqgioRank: 4827 | خرید | حد سود: تعیین نشده حد ضرر: تعیین نشده | 12/8/2025 | |
خرید | حد سود: تعیین نشده حد ضرر: تعیین نشده | 12/16/2025 |

Price Chart of Amazon tokenized stock (xStock)
سود 3 Months :
سیگنالهای Amazon tokenized stock (xStock)
Filter
Sort messages by
Trader Type
Time Frame

AlfonsoMoreno
Amazon stock weekly demand is still in control
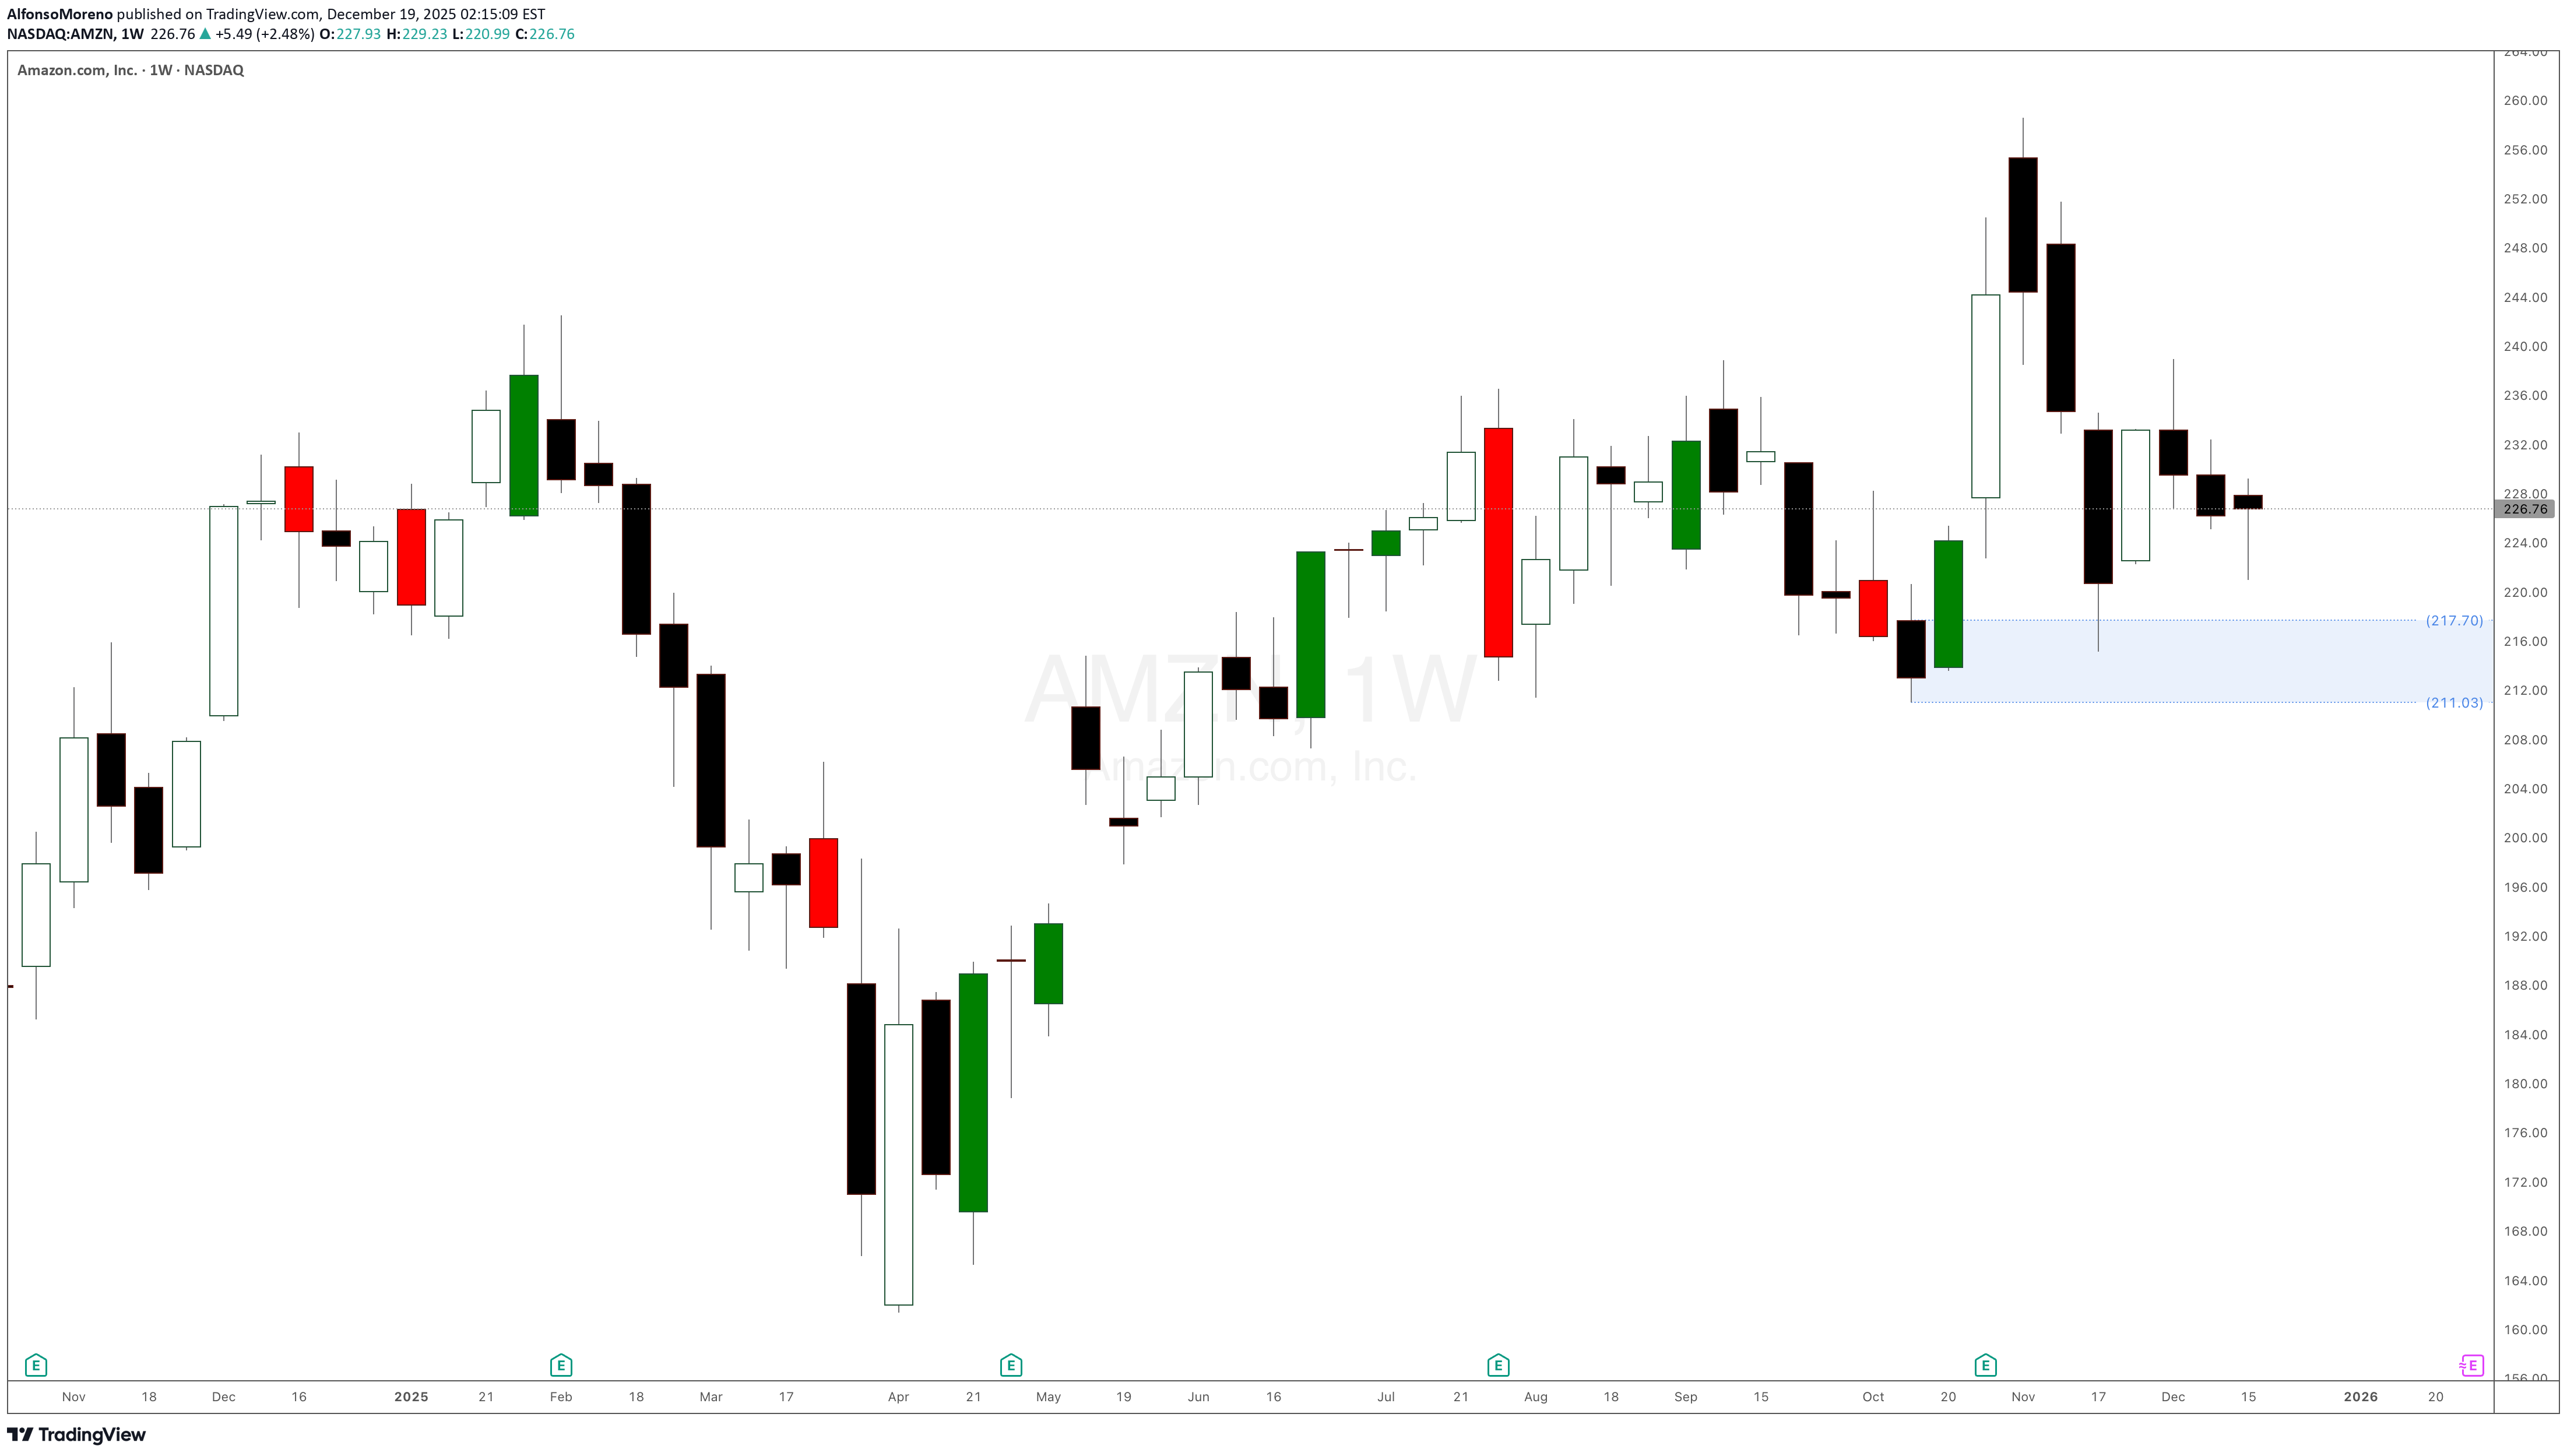
Amazon stock weekly demand at $221 is still in control and is trying to play out as expected. Any long positions should be managed. Let's see if there any new bullish legs printed in the following days.
RB_T
Amazon - The Hidden OpenAI Play Before IPO, $210-220 Support
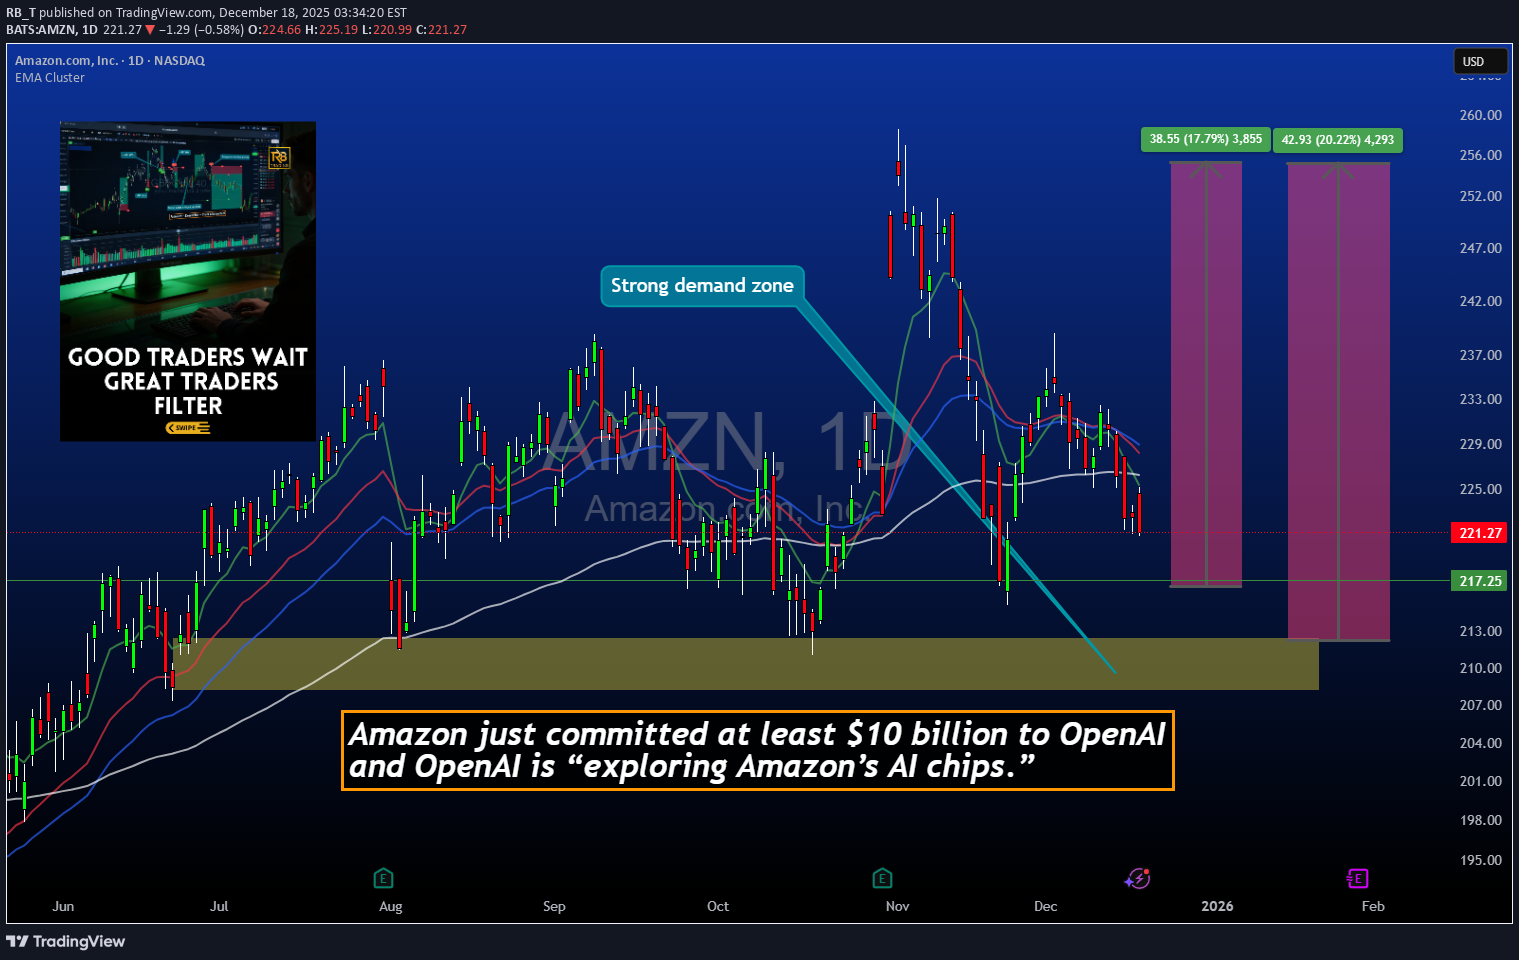
Amazon - The Hidden OpenAI Play Before IPO, $210-220 Support Entry Amazon: Positioning as OpenAI's Infrastructure Partner Before the IPO Window While the market focuses on Microsoft as OpenAI's primary partner, Amazon is quietly positioning itself as the diversification play that could unlock billions in recurring AI infrastructure revenue. With a minimum $10 billion commitment to OpenAI and strategic discussions around custom AI chip deployment, Amazon offers exposure to the OpenAI growth story at a structural support level that provides defined entry risk. 🎯 The Strategic Play: Amazon's $10 Billion OpenAI Commitment: Amazon has committed at least $10 billion to OpenAI, but this isn't just a financial investment - it's a strategic infrastructure partnership. The deal positions Amazon Web Services (AWS) as OpenAI's diversification partner away from Microsoft Azure dominance. Why This Matters: Reduces single-vendor risk for OpenAI's massive compute needs Opens AWS as a hosting platform for OpenAI workloads Custom chip integration potentially using Amazon's Trainium/Inferentia Equity stake gives Amazon ownership upside if/when OpenAI goes public Alexa integration potential for next-generation AI assistant capabilities Current Market Context: AMZN Price: $200-240 range Market Cap: ~$2.4 trillion Technical Setup: Testing major support zone Catalyst Timeline: OpenAI infrastructure decisions and potential IPO window 📊 Why $210-220 is the Entry Zone: Technical Support Confluence: The $210-220 area represents a critical accumulation zone where multiple technical factors converge: Previous consolidation support from earlier 2024 trading Volume profile node showing institutional buying activity Psychological level near $200 round number Pullback into demand after extended rally earlier in year Risk/Reward at Support: Entry: $210-220 zone Stop: Below $200 (psychological and structural support) Target 1: $280 (previous resistance, 30% upside) Target 2: $320 (extension target, 50% upside) Risk/Reward: 5:1 to 8:1 depending on exact entry Why Now: Market has pulled back from highs, creating entry opportunity before OpenAI infrastructure announcements and potential IPO catalysts materialize in 2025. 💡 The OpenAI Infrastructure Angle: Microsoft's Monopoly Problem: OpenAI currently relies heavily on Microsoft Azure for compute infrastructure. This single-vendor dependency creates: Risk concentration if Azure faces issues Pricing leverage for Microsoft Capacity constraints during demand spikes Strategic limitation in vendor negotiations Amazon as Plan B (and Eventually Plan A?): If OpenAI shifts even 20% of compute workloads to AWS, that translates to: Billions in recurring AWS revenue (high-margin cloud business) Multi-year contracts providing revenue visibility Upselling opportunities for other AWS services Competitive positioning against Microsoft in AI infrastructure The Math: OpenAI's compute costs are estimated in the billions annually and growing exponentially. A 20% shift to AWS could represent: $2-4 billion annual revenue for Amazon (conservative estimate) 70%+ margins on cloud infrastructure Recurring nature creates compounding value 🔧 Amazon's Custom AI Chip Advantage: Trainium and Inferentia: Amazon has developed custom AI chips specifically for training and inference workloads: Cost Advantage: 40% cheaper than Nvidia H100 GPUs (industry standard) Better price/performance for specific workloads No Nvidia supply constraints (Amazon controls production) Strategic Importance: Reduces CAPEX for OpenAI's massive compute needs Faster deployment without Nvidia waitlists Customization potential for OpenAI-specific workloads OpenAI Exploring Amazon's Chips: Reports indicate OpenAI is actively evaluating Amazon's AI chips. If adopted: Validates Amazon's chip strategy Creates dependency on AWS ecosystem Locks in multi-year infrastructure relationship 🤖 Alexa Integration Wildcard: The Opportunity: Amazon's Alexa has struggled to compete with newer AI assistants. OpenAI integration could transform Alexa into: ChatGPT-powered voice assistant with superior conversational AI Multi-modal capabilities (voice, vision, reasoning) Competitive parity with Google Assistant and Siri Monetization vehicle for premium AI features Why It Matters: Alexa is in 500+ million devices globally Integration would be immediate distribution for OpenAI Creates consumer-facing AI revenue stream for Amazon Differentiates Echo devices in smart home market 💰 The Equity Upside: Amazon Gets OpenAI Equity: As part of the $10 billion investment, Amazon receives equity in OpenAI. If OpenAI goes public (rumored $100B+ valuation): Scenario Analysis: Conservative: Amazon owns 2-3% of OpenAI at $100B valuation = $2-3B equity value Moderate: Amazon owns 5% at $150B valuation = $7.5B equity value Aggressive: Amazon owns 8% at $200B valuation = $16B equity value Double Upside: Infrastructure revenue: Billions annually from AWS hosting Equity appreciation: Ownership stake in OpenAI's growth This is rare - Amazon gets paid to host the workloads AND owns part of the company. 📈 Why Amazon vs. Microsoft: Microsoft Already Priced In: Market cap reflects OpenAI partnership expectations Azure revenue already includes OpenAI contribution Limited upside surprise potential Amazon is the Surprise Factor: Market underestimates AWS diversification opportunity OpenAI partnership not fully reflected in valuation Chip strategy under-appreciated by analysts Alexa integration potential ignored Risk Diversification: Rather than betting on Microsoft maintaining 100% of OpenAI infrastructure, Amazon represents the diversification trade that captures: 20-30% of OpenAI compute (realistic scenario) Equity upside if OpenAI IPOs Alexa transformation potential Broader AI chip validation 📊 Fundamental Context: Amazon's Core Business: AWS: ~$90B annual revenue, 30%+ margins (crown jewel) E-commerce: Dominant market position, improving margins Advertising: $45B+ business growing 20%+ annually Free cash flow: $50B+ annually Why Support Holds: At $210-220, Amazon trades at reasonable valuations considering: AWS growth acceleration from AI workloads Margin expansion as efficiency initiatives mature Advertising becoming major profit center OpenAI partnership optionality (free upside) Institutional Behavior: Major funds accumulate mega-cap tech at support levels $200-220 zone represents algorithmic buy programs Long-term investors view pullbacks as entry opportunities 🎯 Trade Structure: Entry Strategy: Aggressive: $220 area (current technical support) Conservative: $210 (psychological support, higher conviction) Scale in: Buy 50% at $220, 50% at $210 if it gets there Risk Management: Stop loss: Below $200 (invalidates support thesis) Position size: Appropriate for 5-10% portfolio allocation (mega-cap) Timeframe: 6-12 months for full thesis to develop Target Zones: TP1: $260 (20% gain, previous resistance) TP2: $280 (30% gain, reduce another third) TP3: $320+ (50% gain, major resistance zone) Catalyst Timeline: Q1 2025: Potential OpenAI infrastructure announcements Q2 2025: AWS earnings showing AI revenue growth H2 2025: OpenAI IPO window potentially opens Throughout: Alexa integration rumors/announcements 🧠 Why Most Will Miss This: Microsoft Tunnel Vision: Everyone watches MSFT as "the OpenAI stock" - Amazon's positioning is overlooked despite potentially better risk/reward. Mega-Cap Bias: At $2.4T market cap, traders assume Amazon "can't move much." But 30-50% gains on a $20-30 billion investment theme is massive absolute dollars. Infrastructure Complexity: Most investors don't understand cloud infrastructure economics. They miss that AWS hosting OpenAI is higher-margin than most of Amazon's businesses. Timing Fear: Buying at $220 after the stock has pulled back from $250+ feels uncomfortable. But that's precisely when technical support + fundamental catalysts create opportunity. 📅 Catalyst Timeline and Expectations: Near-Term (Q1 2025): OpenAI infrastructure announcements AWS re:Invent conference AI reveals Potential Amazon chip deployment news Mid-Term (Q2-Q3 2025): AWS earnings calls highlighting AI workload growth Alexa AI integration announcements OpenAI compute diversification details Long-Term (H2 2025+): OpenAI IPO window potentially opening Amazon equity stake value becomes visible Multi-year AWS infrastructure contracts disclosed ⚠️ Risk Factors: What Could Go Wrong: OpenAI Stays With Microsoft: If OpenAI decides not to diversify infrastructure significantly, Amazon loses the thesis catalyst. However, the $10B investment still provides equity exposure. Chip Strategy Fails: If OpenAI doesn't adopt Amazon's custom AI chips, the cost advantage and ecosystem lock-in don't materialize. Market-Wide Correction: Mega-cap tech could face broad selling pressure regardless of individual catalysts. The $200 support could break in a risk-off environment. OpenAI Stumbles: If OpenAI faces competitive pressure from other AI companies or regulatory issues, the infrastructure opportunity diminishes. Valuation Compression: At $2.4T market cap, Amazon needs significant catalysts to drive meaningful appreciation. If AI growth disappoints, multiple compression could occur. 🏆 The Professional Approach: They See The Setup: Technical support at $210-220 Fundamental catalyst (OpenAI partnership) Asymmetric risk/reward (5:1+) Multiple paths to upside (AWS, equity, Alexa) They Size Appropriately: Mega-cap reduces position risk Liquid market allows easy scaling 5-10% portfolio allocation reasonable They Think Long-Term: 6-12 month catalyst timeline Not a day trade or swing trade Allows thesis time to develop They Scale Out: Take profits at $260, $280, $320 Don't try to pick the perfect exit Lock gains progressively as targets hit 📌 Key Investment Thesis Points: ✅ $10B+ OpenAI investment positions Amazon as infrastructure diversification partner ✅ 20% compute shift could mean $2-4B annual AWS revenue (high margin) ✅ Custom AI chips provide cost advantage and ecosystem lock-in ✅ Equity stake in OpenAI provides IPO upside (potentially worth billions) ✅ Alexa integration could transform 500M+ device install base ✅ Technical support at $210-220 provides defined entry with tight risk ✅ 5:1+ risk/reward to structural targets with multiple catalyst paths 📊 Investment Summary: Why Amazon: Hidden OpenAI infrastructure play Better risk/reward than Microsoft Multiple upside paths (AWS, equity, Alexa) Entry at technical support Mega-cap liquidity and safety Why Now: Pullback to $210-220 support zone Before OpenAI infrastructure announcements Ahead of potential IPO window Market underpricing the opportunity Why $210-220: Technical support confluence Institutional accumulation zone Risk defined below $200 5:1+ reward/risk to targets ⚠️ Important Disclaimers: This analysis is for educational purposes and reflects a view on Amazon's strategic positioning with OpenAI. It is not financial advice or a recommendation to buy or sell AMZN or any security. The OpenAI partnership details are based on publicly available information and reports. Actual infrastructure usage, revenue impact, and equity terms may differ significantly from estimates presented. Amazon is a mega-cap stock with many business lines. The OpenAI opportunity represents only one potential growth driver among many factors affecting valuation. Stock prices can decline significantly even when fundamental theses are correct. The $210-220 support could fail, and the OpenAI catalysts may take longer to materialize than expected or may not occur at all. Technology sector investments carry specific risks including regulatory changes, competitive dynamics, and rapid innovation cycles. Position sizing must account for volatility even in large-cap names. Always conduct independent research, consider your risk tolerance and investment timeframe, and consult with financial professionals. All investing involves risk of loss. ✨ Your Take: Are you viewing Amazon as an OpenAI infrastructure play? How do you evaluate the AWS/OpenAI opportunity versus the Microsoft Azure relationship? Share your perspective in the comments. 📜 Buy structure. Diversify exposure. Think long-term.

TopChartPatterns
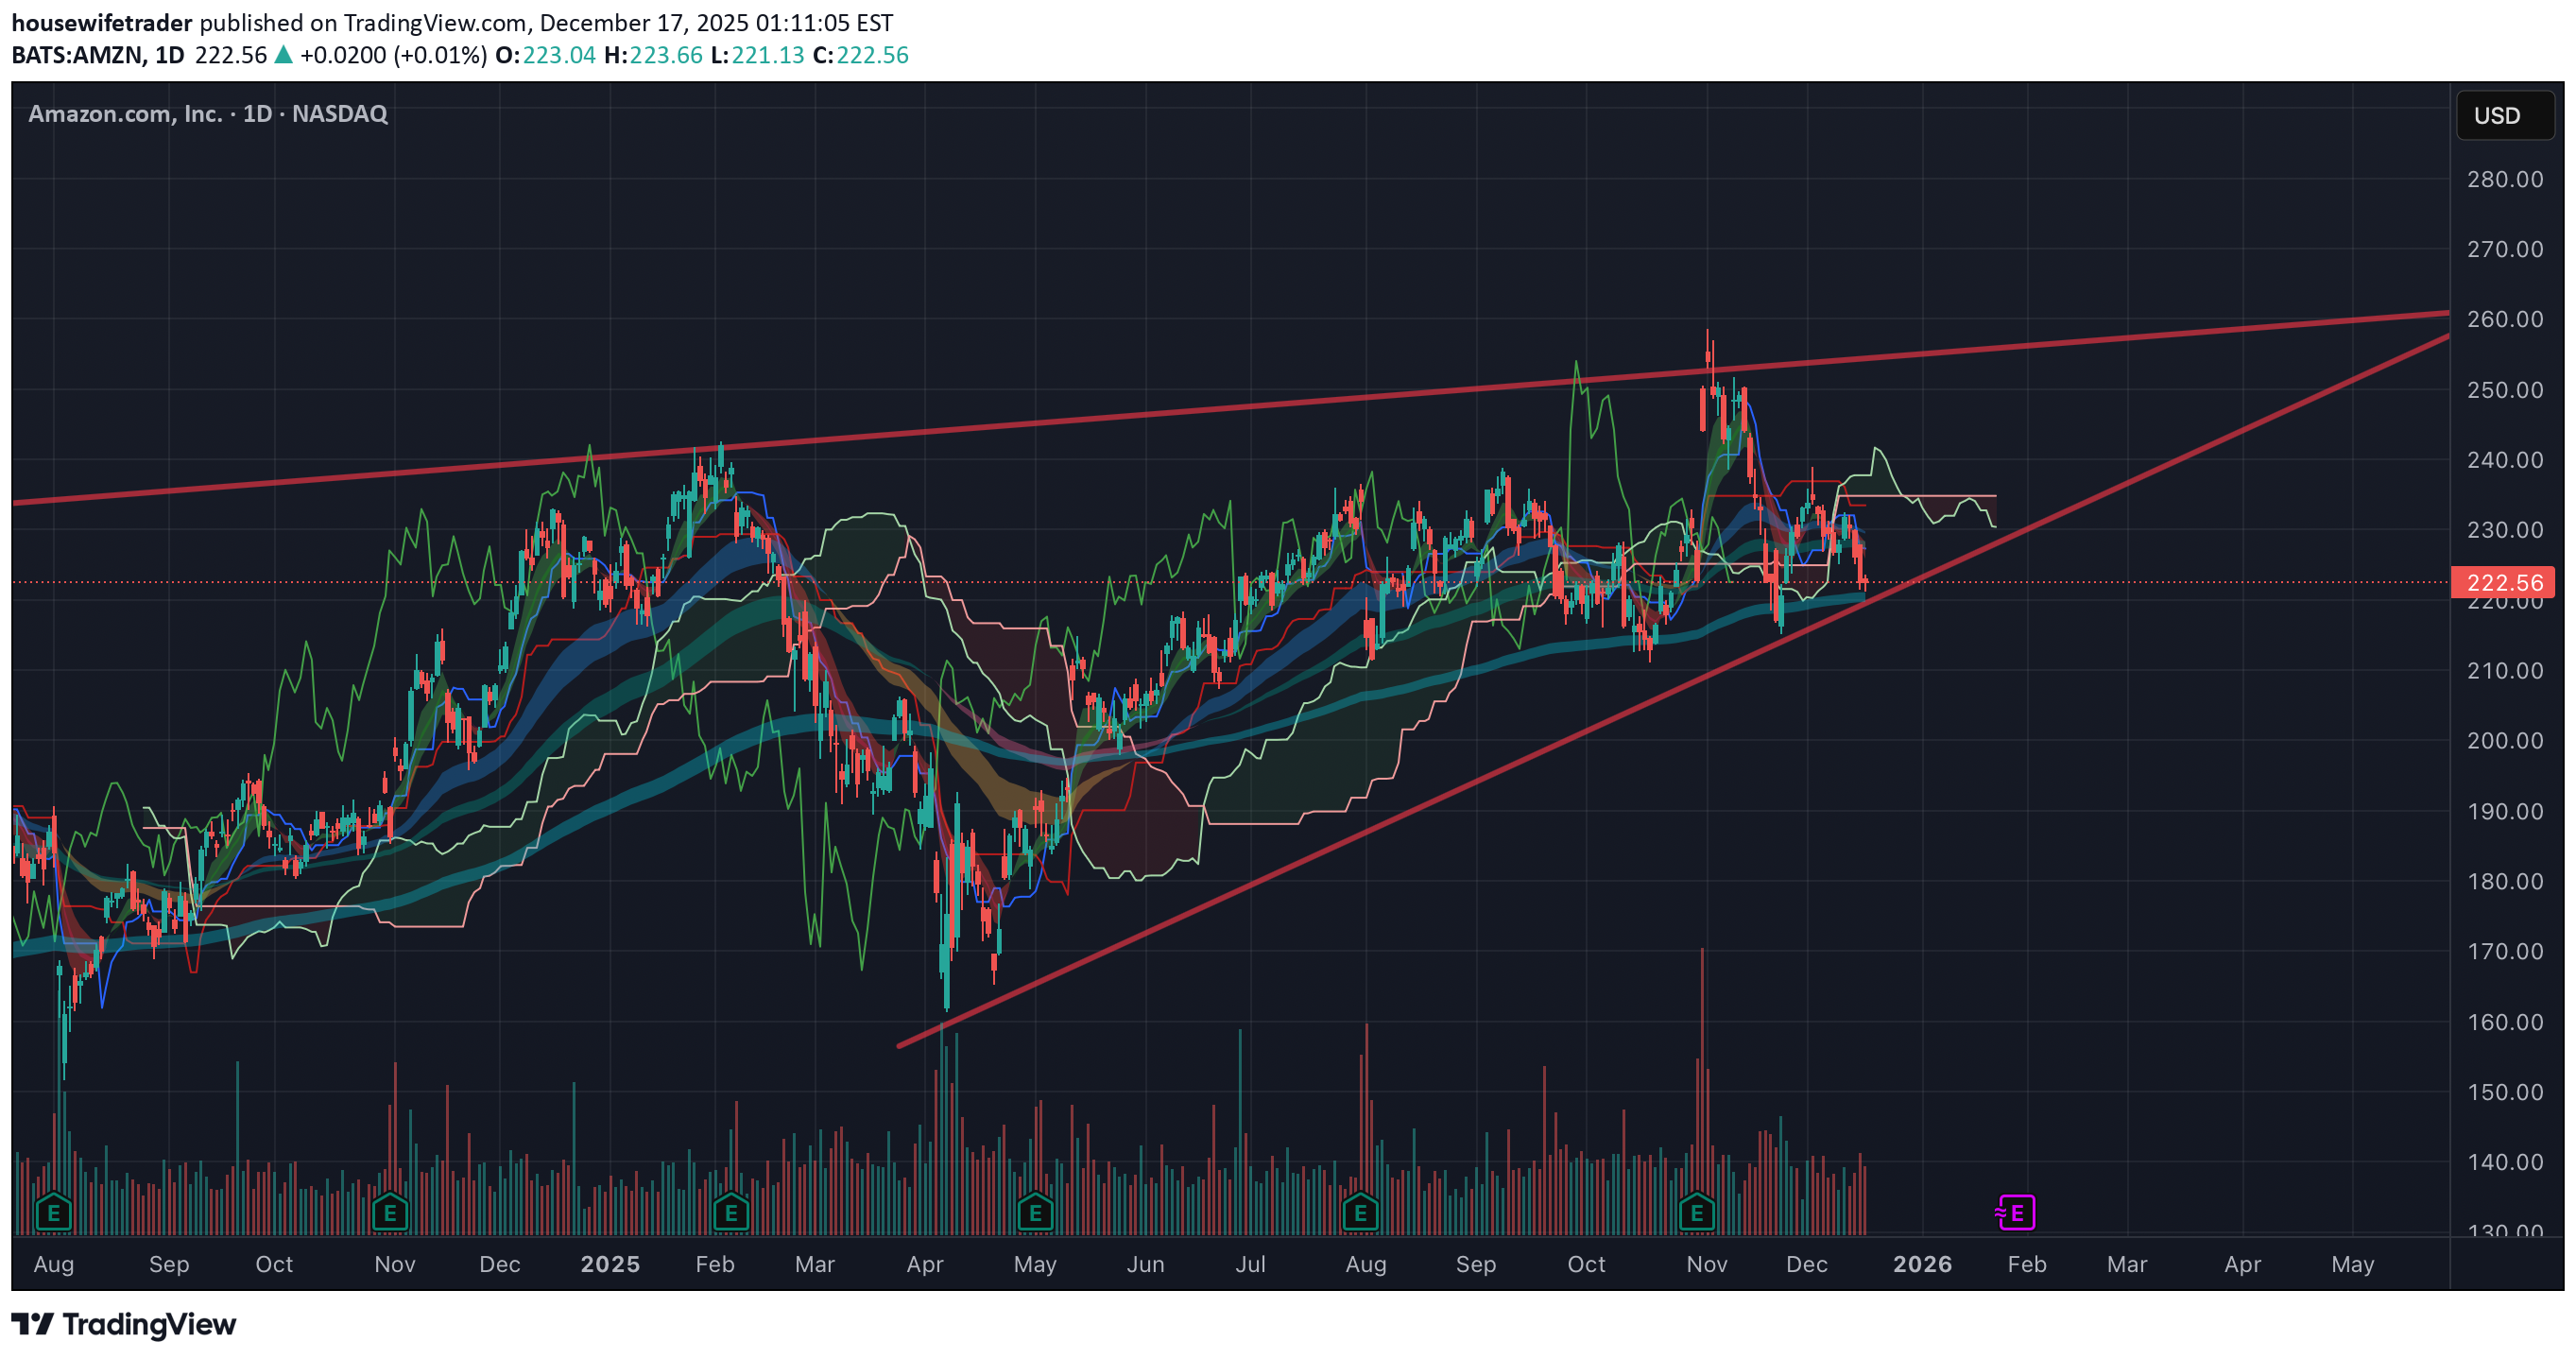
AMZN Long term: Perspective, Patience, and a Channel
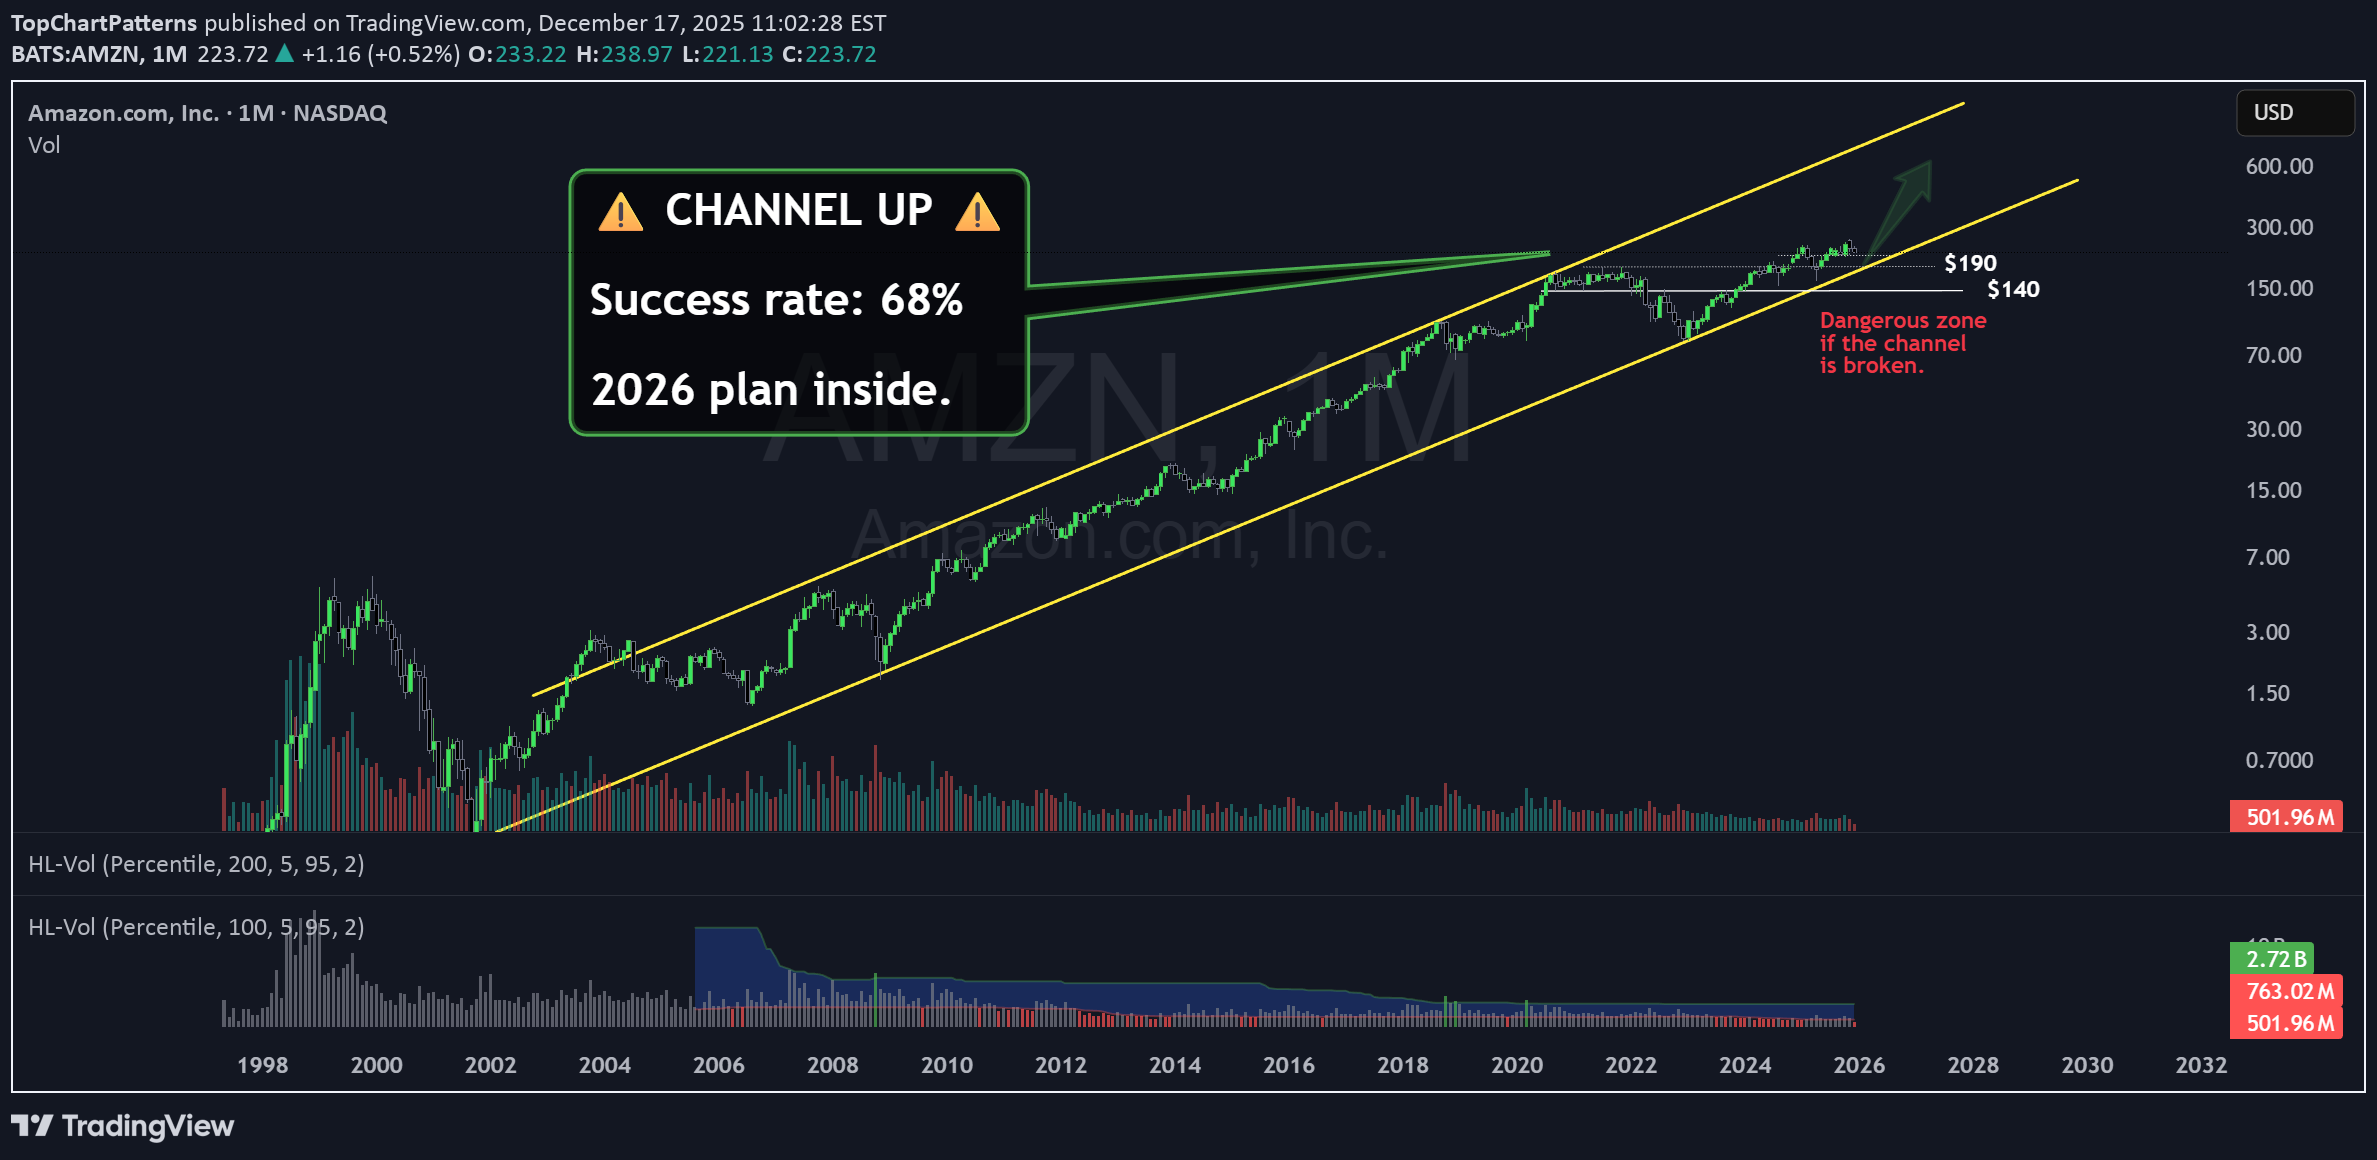
AMZN Long term: Perspective, Patience, and a Channel Hello traders, Today, I want to invite you to look at the AMZN chart through a lens of history and probability. It is not just about where price is today, but understanding the journey of how it got here. Two eras in Amazon When we analyze the journey of Amazon from 2001 to 2020, we witness something truly spectacular, an average growth rate of 40% . It was an era of explosive expansion. However, as we know, when a giant reaches the summit, the climb changes. Over the last 5 years, that pace has settled to 8% . Yet, if we zoom out and look at the annualized average since 2001, we are still looking at a formidable 32% . While the law of large numbers tells us it is complicated for a company of this massive capitalization to maintain that early velocity, the technical structure provides us with a distinct advantage. The Asymmetric Opportunity We find ourselves interacting with a clearly defined long-term channel. This is where clarity meets opportunity. The supports near the 200 zone allow us to position ourselves strategically. This grants us leverage. By entering in this zone, we are looking at a potential 300% upside over the coming years if the price returns to the top of the channel. Conversely, because the support is so clearly defined, we can cap our risk at a maximum of 15% should the channel break and the long-term narrative change. It is a classic scenario of limited downside with a horizon of great potential. ⚔️ My Battle strategy in the long term 📈 BUY ZONE: $200 Level ⛔ STOP LOSS: 15% Risk (Clearly below lower channel support) 🎯 TARGET: Top of the Channel (+300% potential long-term) _________________________________________________ 🔓 Unlocking the Full Potential I am opening the vault on my personal long-term charts for the 2026 cycle. We are stepping away from the daily noise to look at the structure of the market. I want this series to be valuable for your portfolio. You tell me an asset, and I will share the long-term chart and all the insights with you. Feel free to slide into my DMs or leave a comment below. 🤝 Deal?
NOBSForex
Is Amazon Forecasting Weak Holiday Sales?
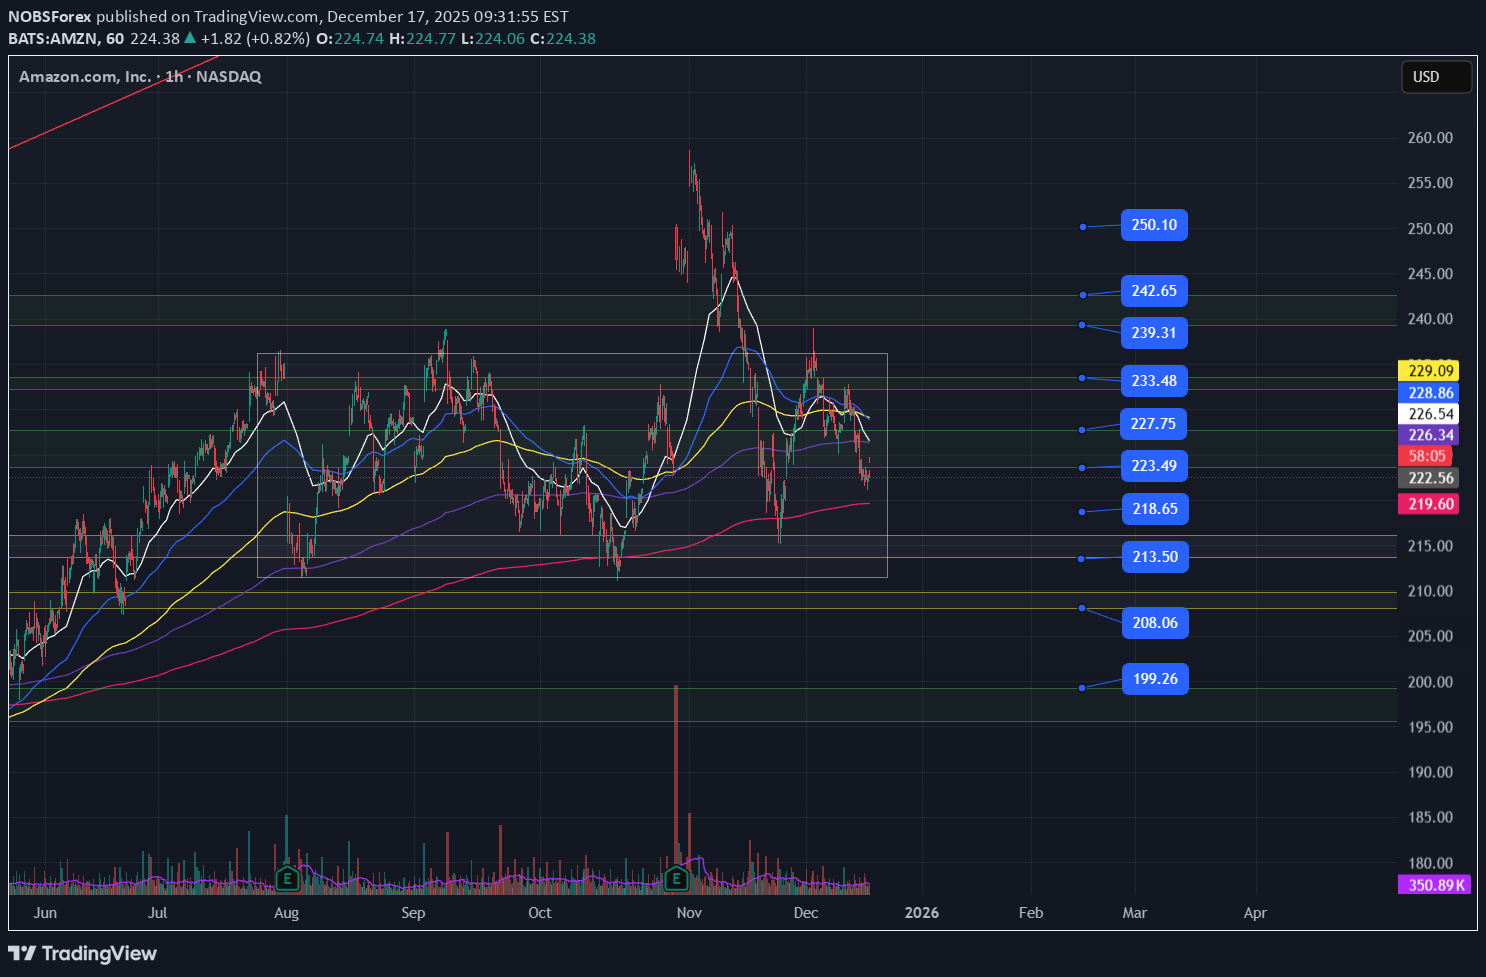
Amazon looks very weak here and I wonder if this is a sign of how retail is going to pan out this holiday season. Regardless of the fundamental back drop my chart tells me all I need to know and right price is not screaming buy. We had the 8MA(226) cross below the 50MA(229) and it is now challenging the 100MA(226). All of the MA's are curling down and price is trying to test the 200MA(219) which will be an important spot if we get there. I would be looking to short bounces up to 227 until price can reclaim that 8MA. Selling Call Spreads above that level or selling Puts below 210 look like good options right now. If we see a break/hold below the 200MA I would be pressing shorts for 210, 208, 200. We all know how important 190ish was this year so bulls really don't want to see that level come back into play. AMZN
#AMZN breaking up or breaking down before the NY rally?
I will purchase more shares at this level as I expect it to go up as we are approaching the NY rally. If it breaks down to $217, it'll give another opportunity to load up. NOT an investment advice!!! Watch out for the levels!

BullBearInsights
AMZN – Intraday Structure + GEX Context (Dec 17)
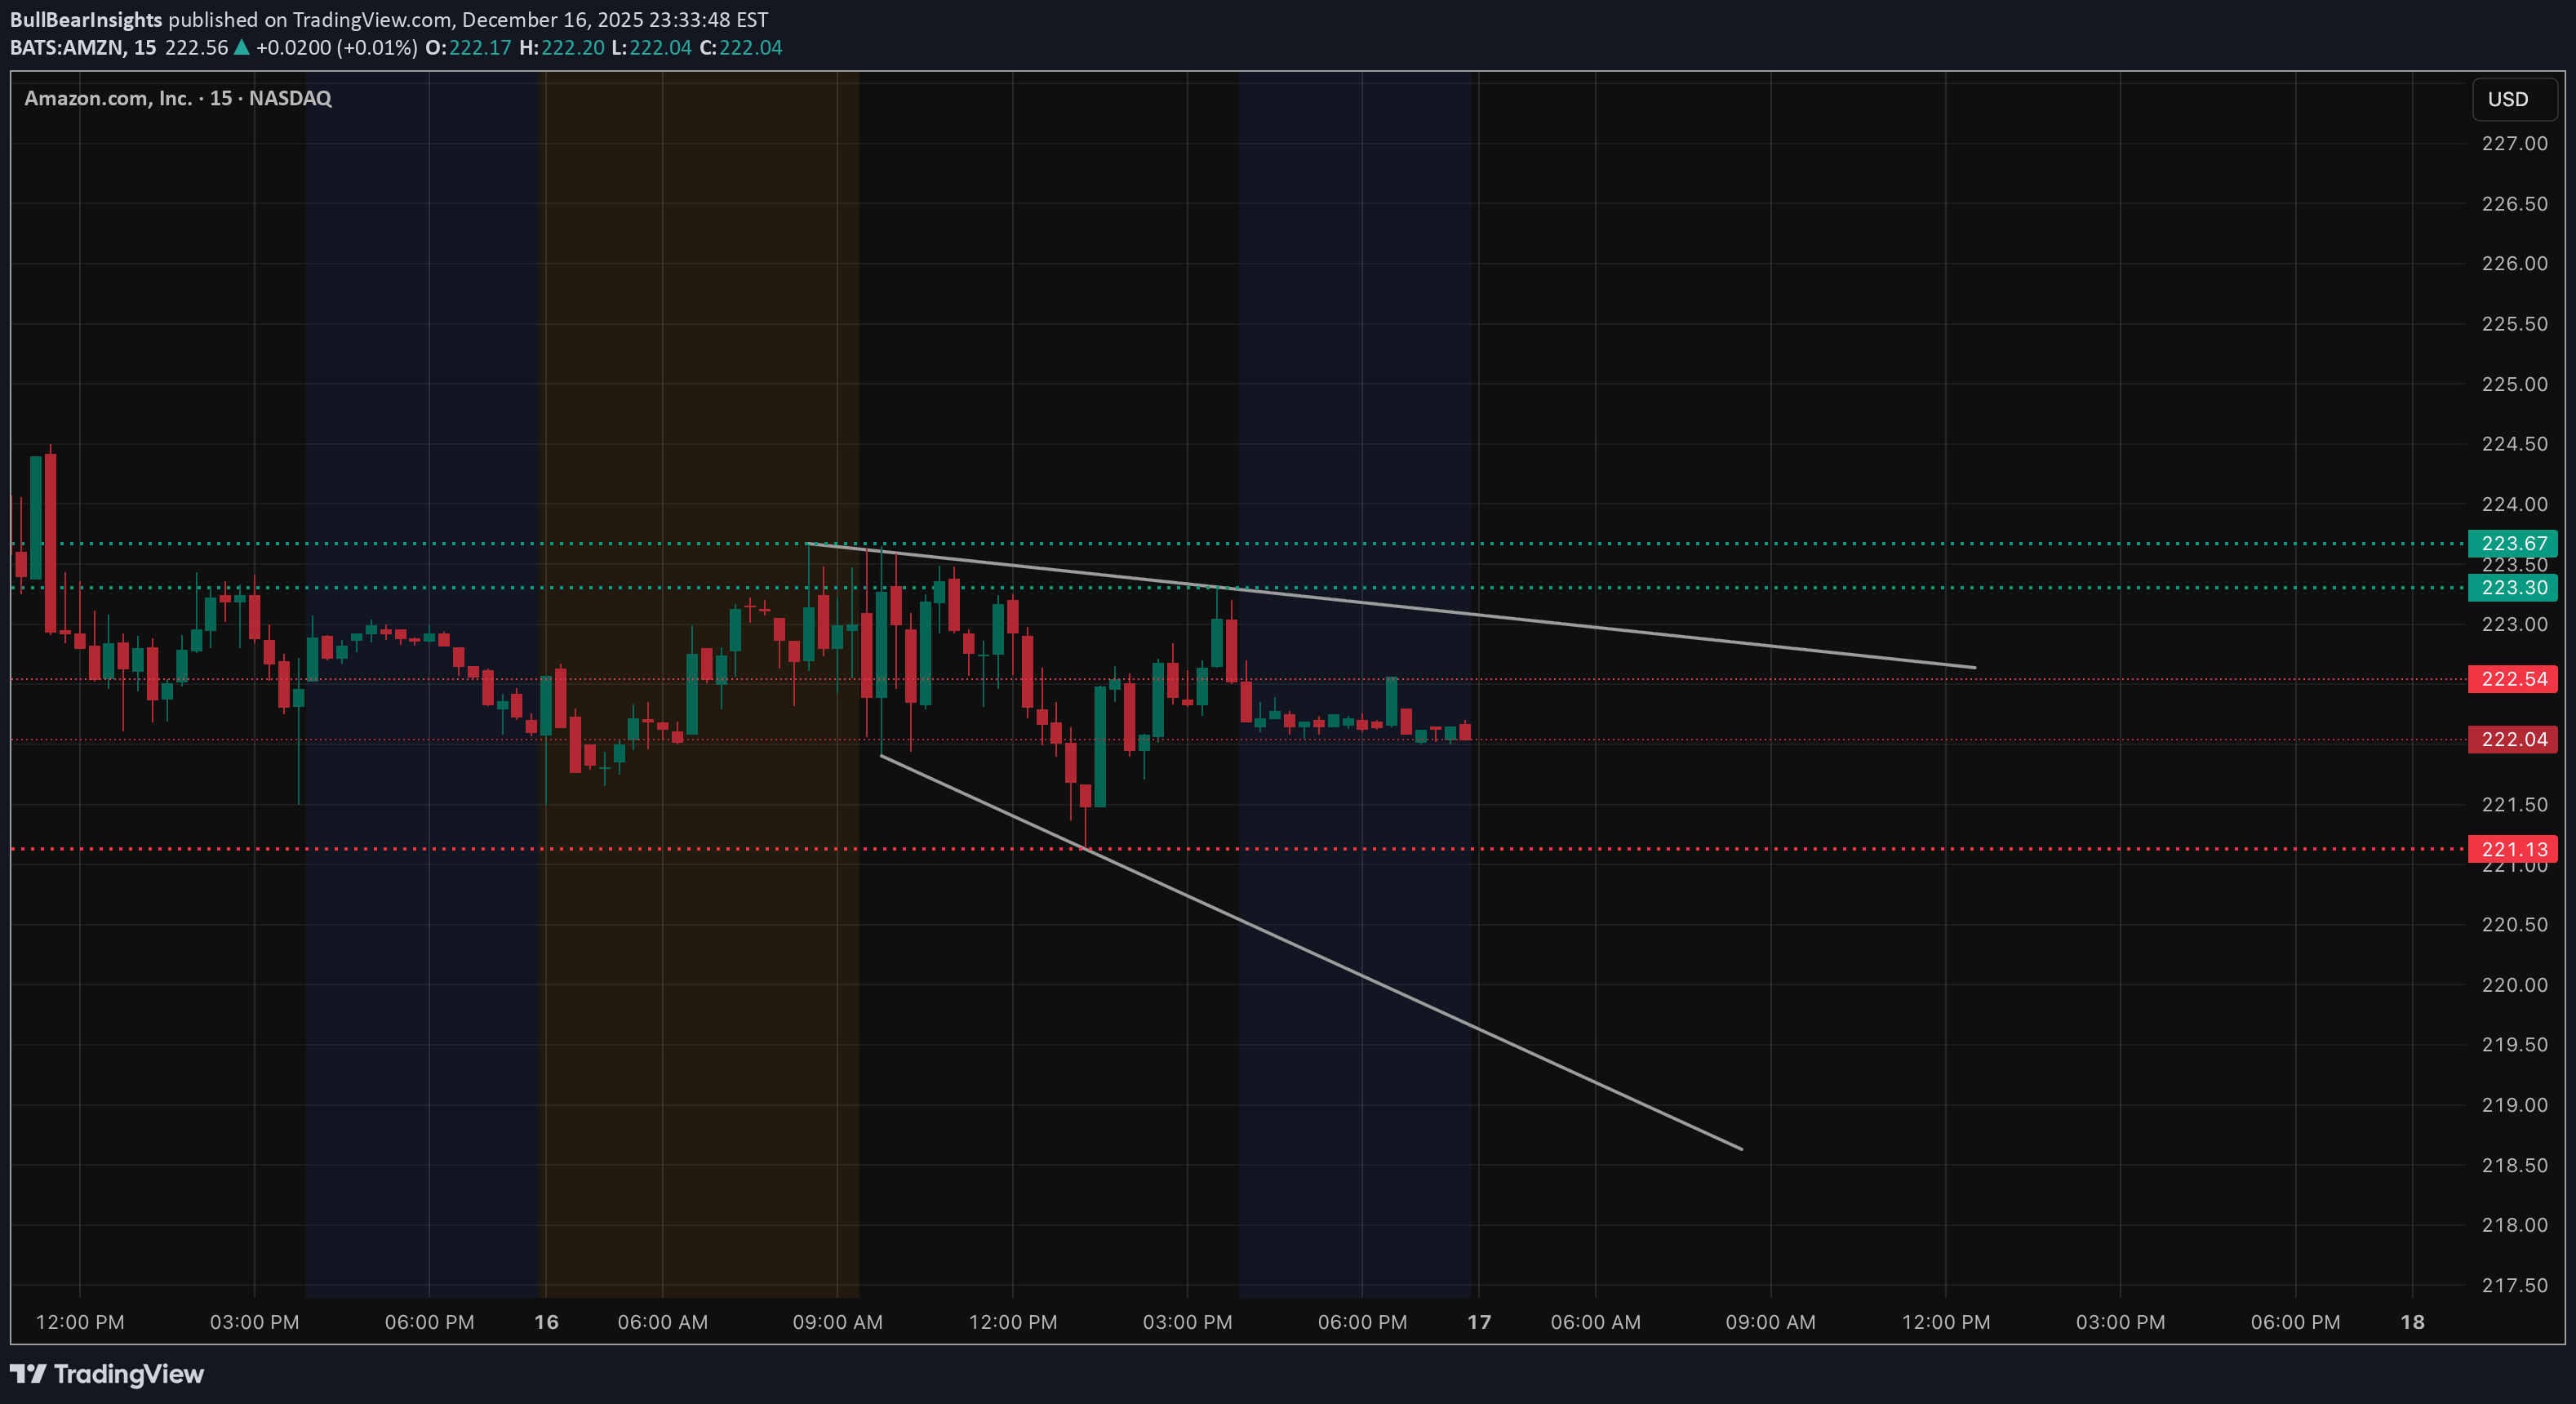
AMZN is still stuck in a tight intraday compression, and price is telling a very clear story here. On the 15-minute chart, structure remains weak with lower highs pressing into a declining trendline. Every attempt to push higher has been sold quickly, which tells me buyers are hesitant to step in aggressively at these levels. Price continues to accept below the 223–224 zone, which has acted as a short-term balance area. As long as AMZN stays capped below this region, upside follow-through remains limited and rallies look more like liquidity grabs than real breakouts. The failure to reclaim and hold above that zone keeps the bias neutral-to-bearish intraday. The lower side is more interesting. The 221–220 area has been tested multiple times and continues to act as near-term support. Each bounce has been weaker, which increases the risk of a breakdown if sellers press with volume. A clean loss of 221 opens the door for continuation toward the 218–215 range, where deeper demand and prior liquidity sit. Now layering in GEX, the options landscape lines up well with what price is doing. The highest positive gamma and call resistance sit overhead around the 230 zone, which explains why upside attempts are getting pinned well before any meaningful expansion. Dealers are likely hedged in a way that dampens upside volatility unless price can force acceptance above that level. On the downside, the strongest PUT support and negative gamma zones begin to show below 220. That’s important — if AMZN slips into that area, downside movement can accelerate quickly as hedging flows start to work against price instead of stabilizing it. This is the area where intraday volatility can expand instead of compress. From a trader’s perspective, this remains a patience environment. Long setups only make sense on a clean reclaim and hold above 224 with momentum. Until that happens, rallies into resistance are suspect. Short-side continuation becomes more attractive if price loses 221 with acceptance, targeting the lower PUT-heavy zones. Right now, AMZN is not trending — it’s compressing. The next move will likely come from a break of this tight range, and GEX suggests that once it moves, it won’t be subtle. Bias: Neutral → Bearish Key resistance: 223–224, then 230 Key support: 221, then 218–215 Disclaimer: This analysis is for educational purposes only and does not constitute financial advice. Always do your own research and manage risk appropriately.
$Amzn Are You Finished or Are you Done?
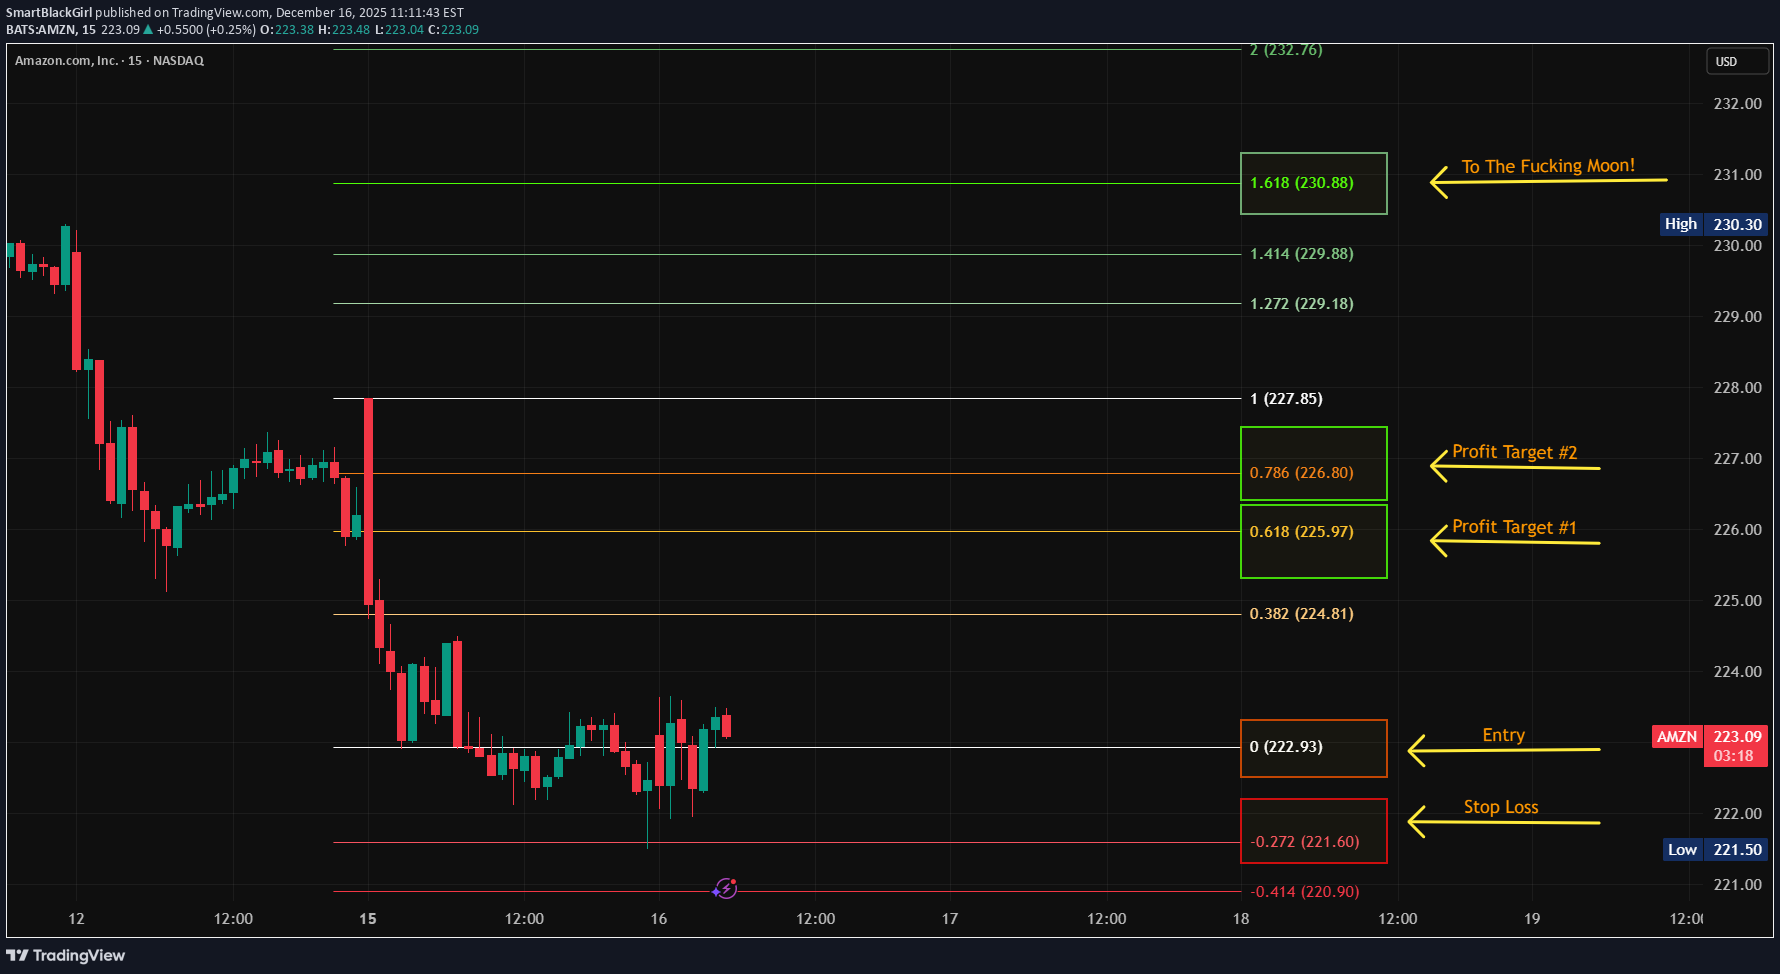
S/O to Birdmard just because I love that wild ass statement; Lol. So I've been on AMZN for a week now and I Learned a Lesson from it last week wicking 1.272 action. So I'm back to perhaps call it from the bottom of where its at currently. But check this is out, I generally only have my fibs to show on the level I chart on, (I dont want to see it on another time frame.) Well, this morning; I guess I hadn't turned my motor all the way on and I read my 1 HR fibs on the 15 mins and got into some 225 Amazon calls only to realize that this is my 1 Hr TF fibs not the 15 mins (Which is what I trade every day). So, this AMZN Chart Image is Charted on the 1 HR TIME FRAME, but the Image I posted is on the 15 min TF. #Calls Happy Trading, Alerts Set!
Live trading on Amazon stock.
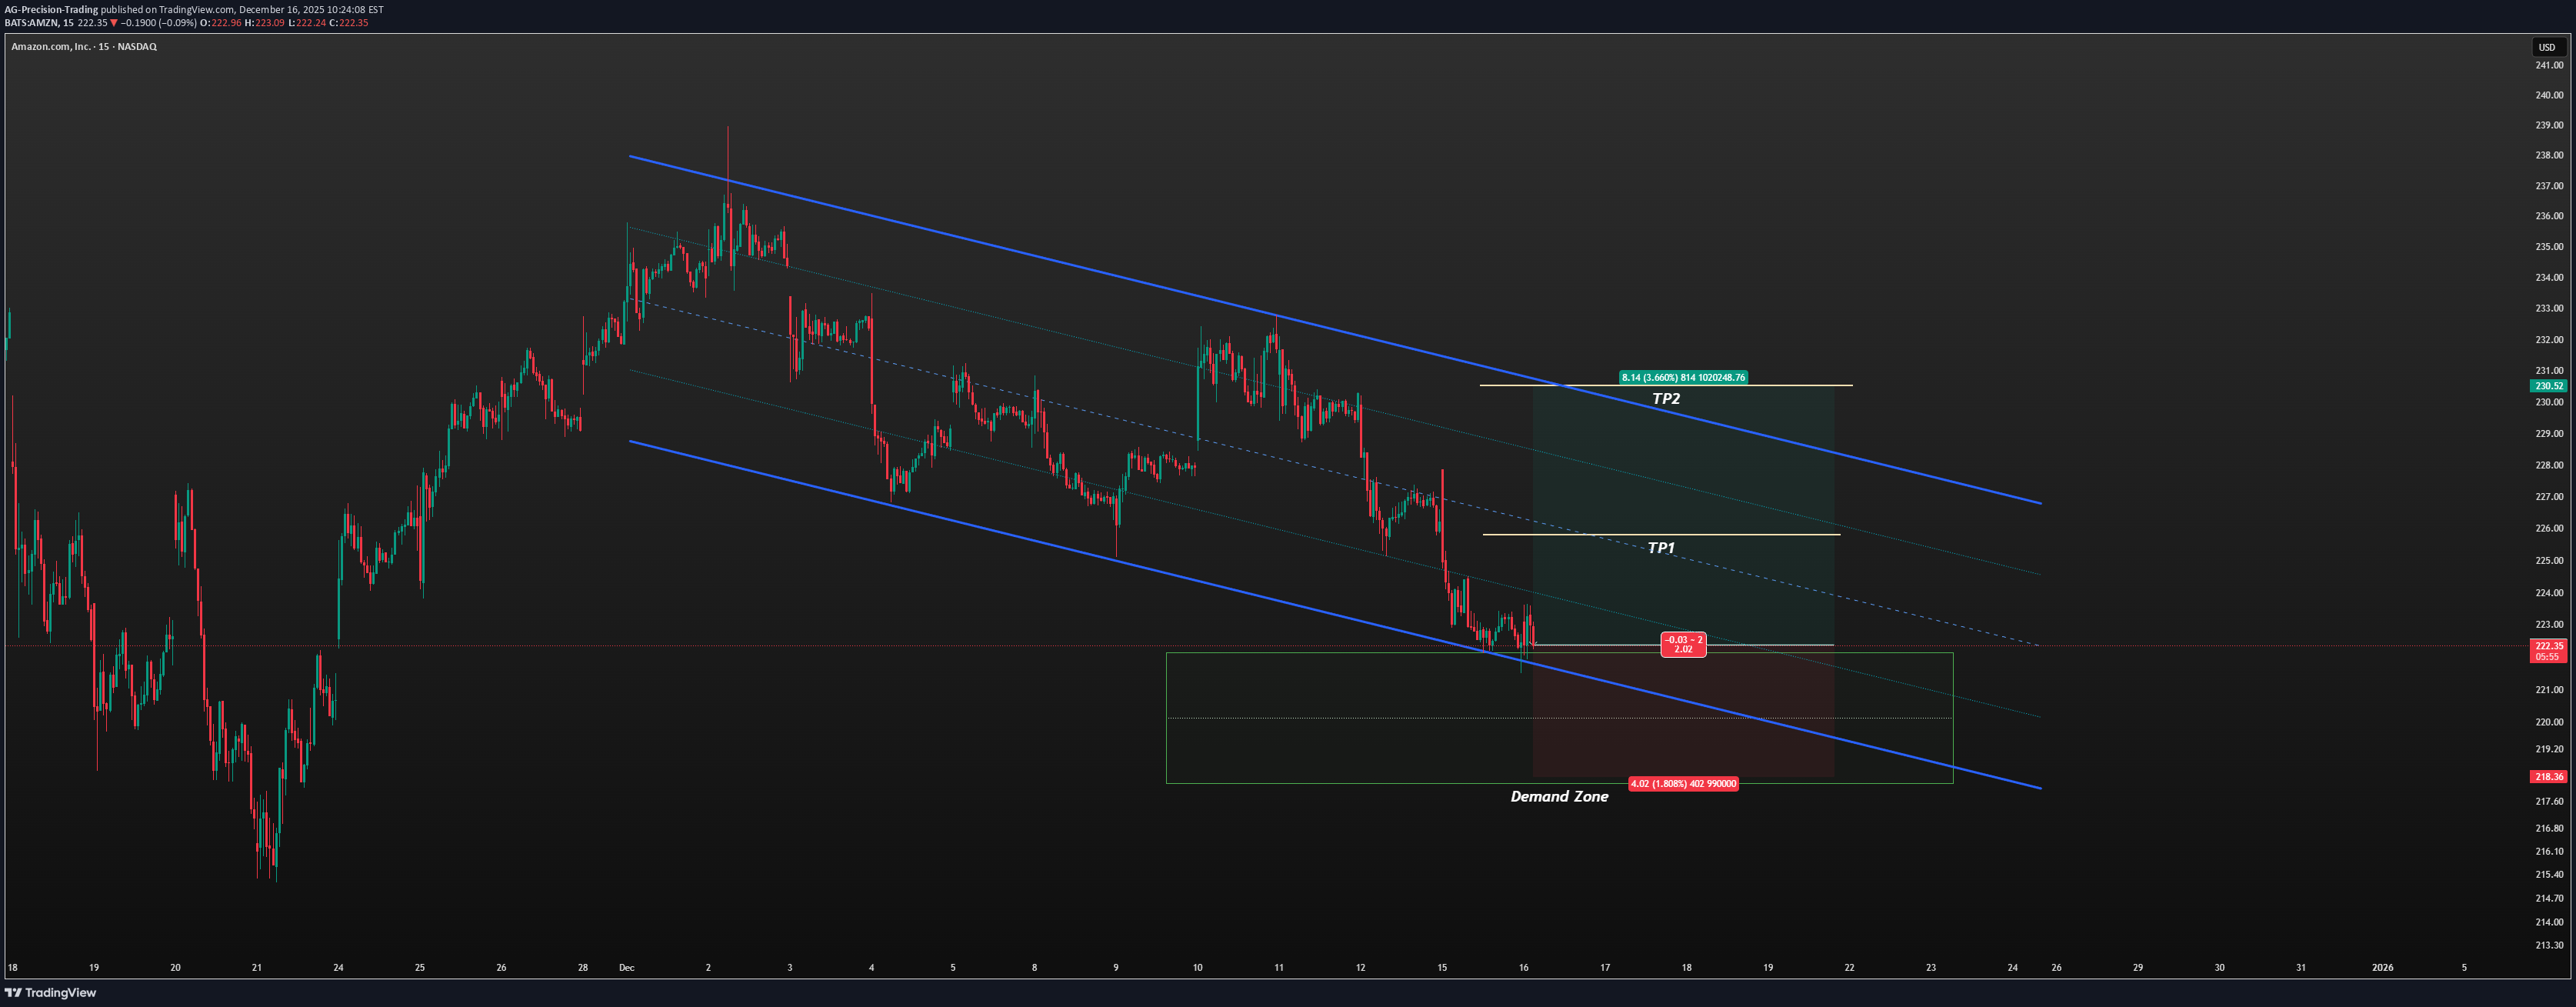
Live trading on Amazon stock. Price is at the bottom of its channel and sitting in a strong demand zone. Follow proper risk and money management. This is just my personal view, so please trade based on your own strategy and trading system. Follow me on TradingView for more analyses and live stock trades. AMZNGood move for nowTP1 has been hit
BullBearInsights
AMZN at a Critical Zone for Dec. 15. Could Decide the Next Move?
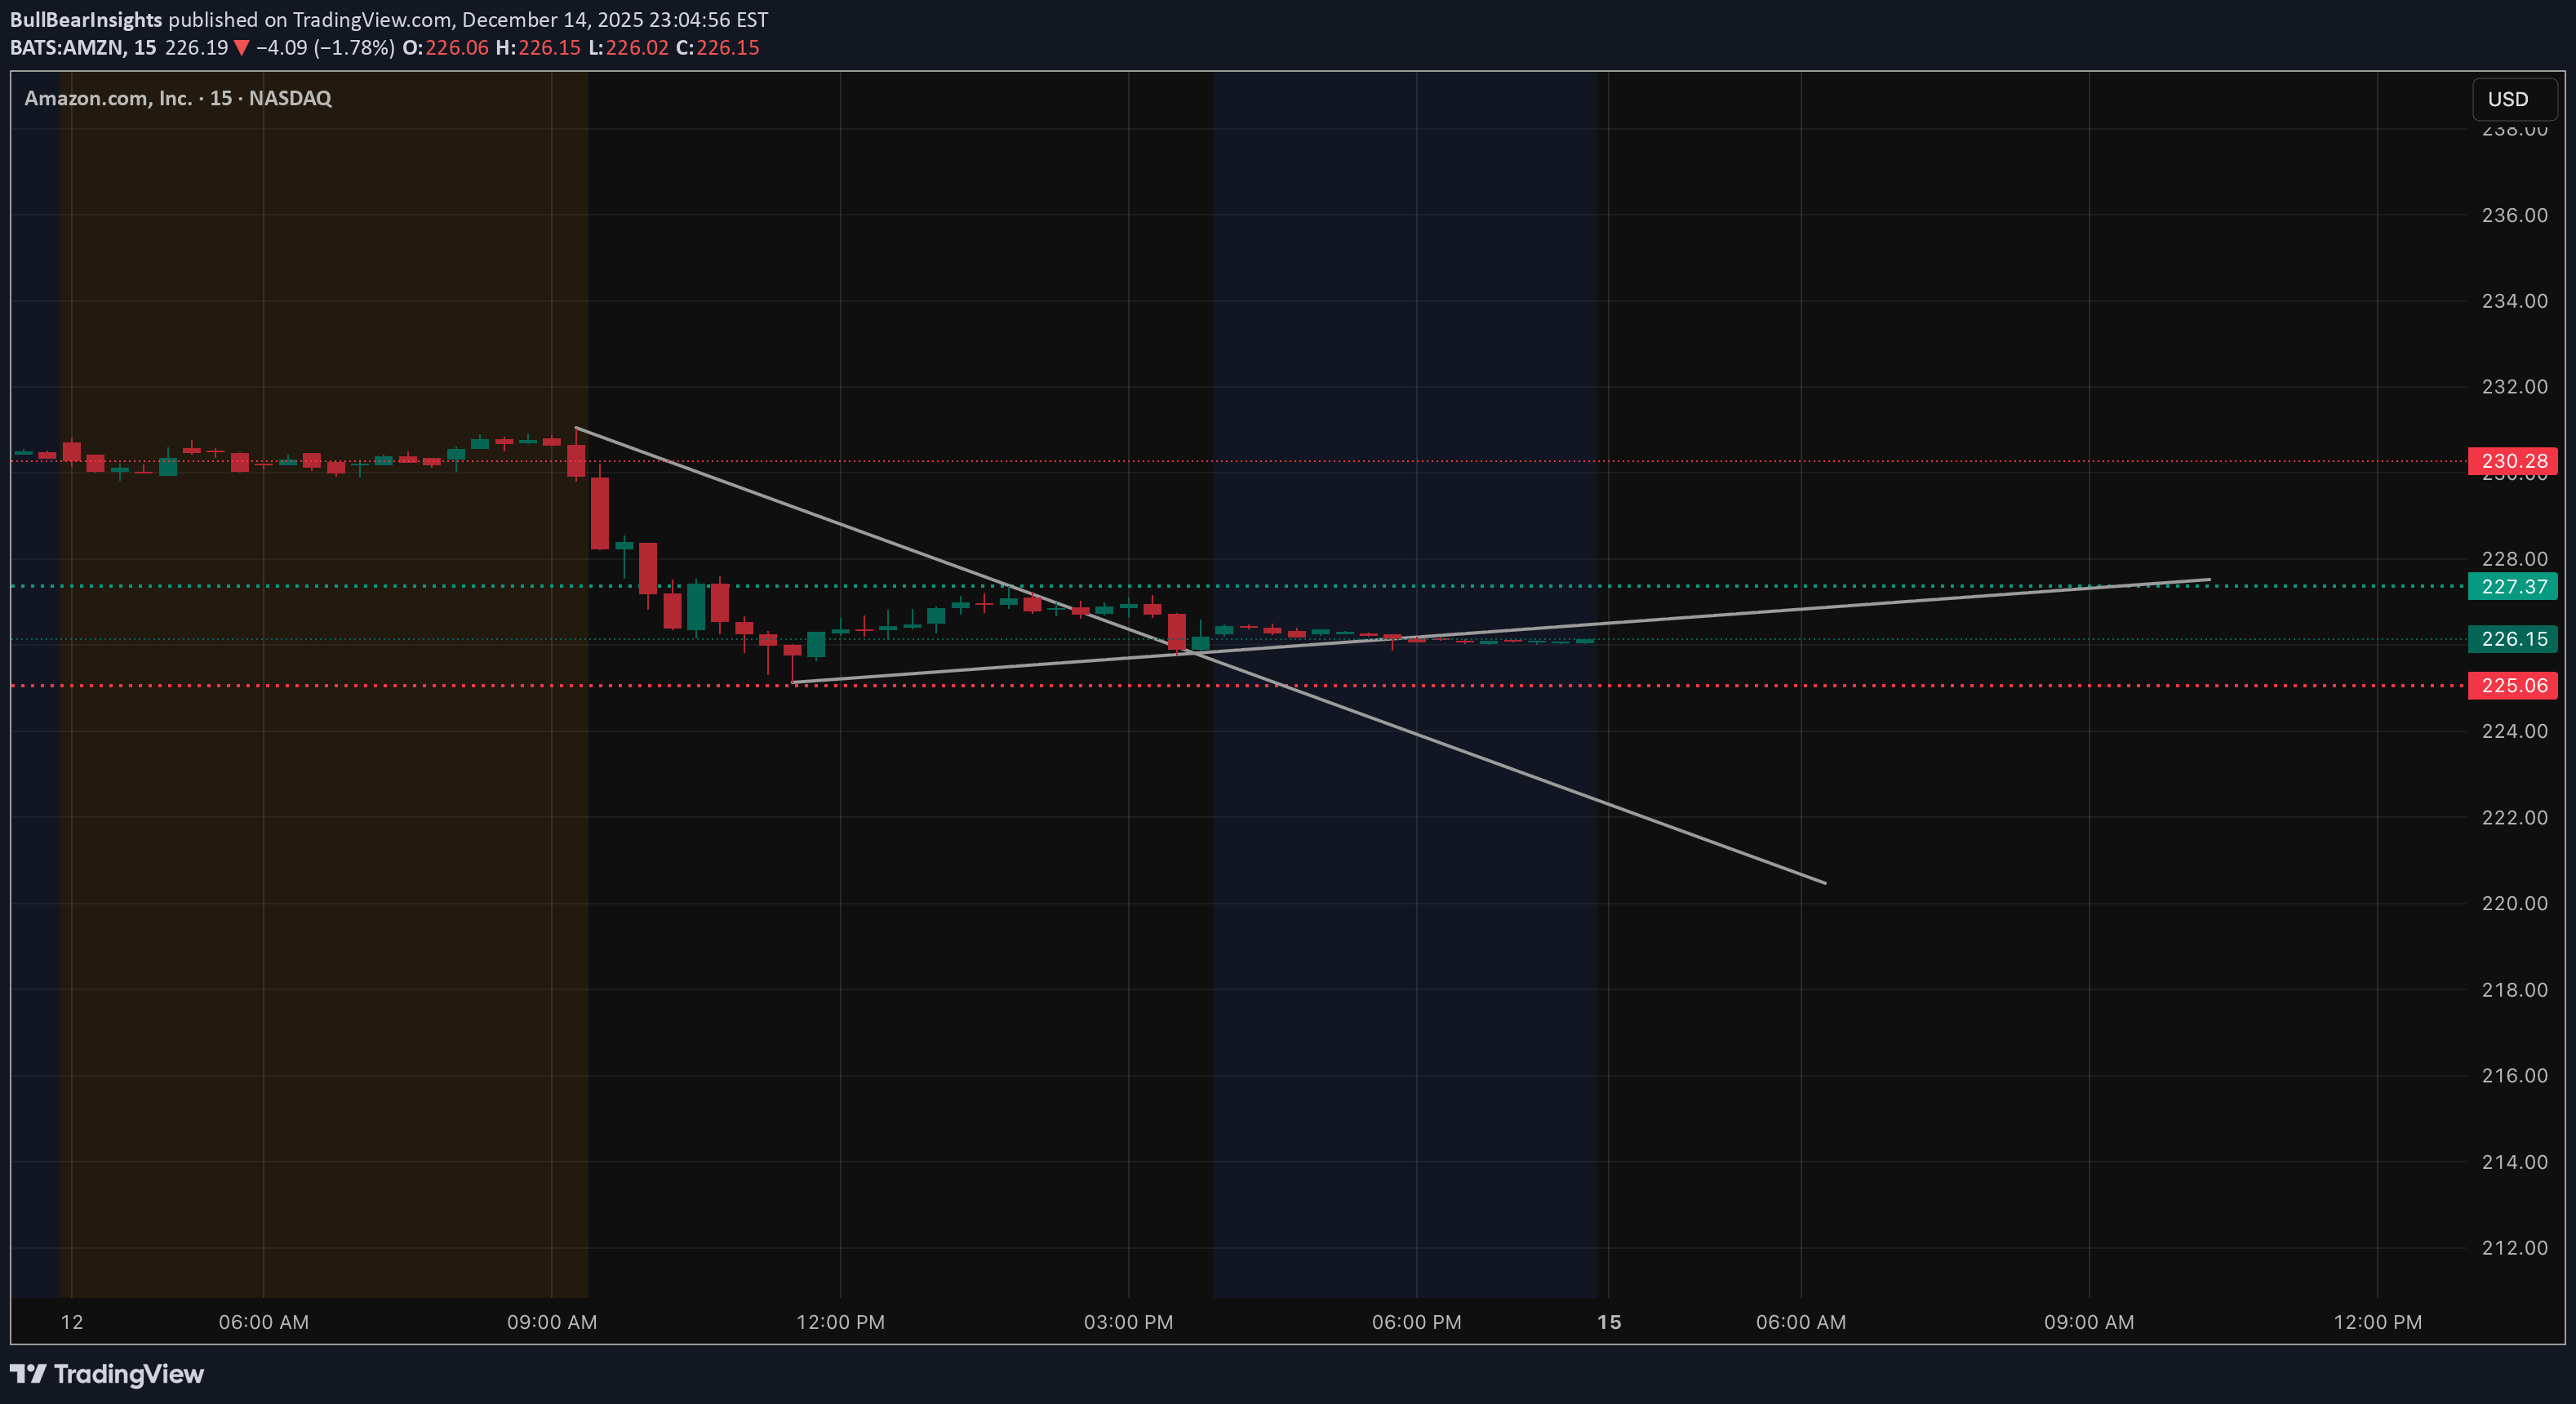
AMZN doesn’t look strong going into Dec. 15. It’s not collapsing, but it also doesn’t show the kind of buying pressure you’d expect if a real bounce was coming. After the breakdown from the prior range, price tried to stabilize, but every push higher has been slow and overlapping. That usually tells me sellers are still in control and buyers are only reacting, not leading. Right now, AMZN is hovering around the 226–227 area. It’s holding for the moment, but nothing here looks like a confirmed bottom. This feels more like a pause after selling than accumulation. As long as price stays below the prior breakdown zone, the trend hasn’t changed. Levels I’m watching The most important area is 227–228. That zone has repeatedly capped price and lines up with prior structure. If AMZN can’t reclaim and hold above it, upside moves are likely just relief bounces. Above that, 230–232 is the bigger test. This was strong support before the breakdown and should now act as resistance. If price reaches that zone without strong volume, I’d expect sellers to step in again. On the downside, 225 is the first level that matters. If that breaks, the chart opens up quickly toward 222–220, which is the next liquidity pocket from the previous move. How options positioning fits (confirmation only) Options positioning explains why price feels heavy. There’s solid PUT support below, which is slowing downside momentum. At the same time, CALL resistance is stacked overhead, especially above 230. That makes sustained upside harder unless volume expands. This lines up with what price is already telling us — downside moves have more follow-through than upside attempts. How I’m approaching Dec. 15 If AMZN opens and can’t hold above 227, I’ll stay cautious on longs. A clean break below 225 is where downside momentum likely picks up again. If price manages to reclaim 228–230 and hold, then I’d reassess. Until that happens, I’m treating upside moves as corrective, not a trend shift. For me: * Below 225 → downside continuation risk * Between 225–228 → chop and traps * Above 230 with acceptance → trend improvement attempt Until proven otherwise, this still looks like bearish consolidation, not a confirmed bottom. This analysis is for educational purposes only and does not constitute financial advice.

travelerahmedadly
تحلیل هفتگی آمازون: آیا سهام $AMZN به قله جدید میرسد؟

The $238.85 level for Amazon stock has been broken, with a weekly candle closing above this level. Don’t worry—the stock is bullish in the near term. For now, it’s a buy and hold. Good luck 4all 🃏
Disclaimer
Any content and materials included in Sahmeto's website and official communication channels are a compilation of personal opinions and analyses and are not binding. They do not constitute any recommendation for buying, selling, entering or exiting the stock market and cryptocurrency market. Also, all news and analyses included in the website and channels are merely republished information from official and unofficial domestic and foreign sources, and it is obvious that users of the said content are responsible for following up and ensuring the authenticity and accuracy of the materials. Therefore, while disclaiming responsibility, it is declared that the responsibility for any decision-making, action, and potential profit and loss in the capital market and cryptocurrency market lies with the trader.