
AG-Precision-Trading
@t_AG-Precision-Trading

What symbols does the trader recommend buying?
Purchase History
پیام های تریدر
Filter
Apple to NVIDIA
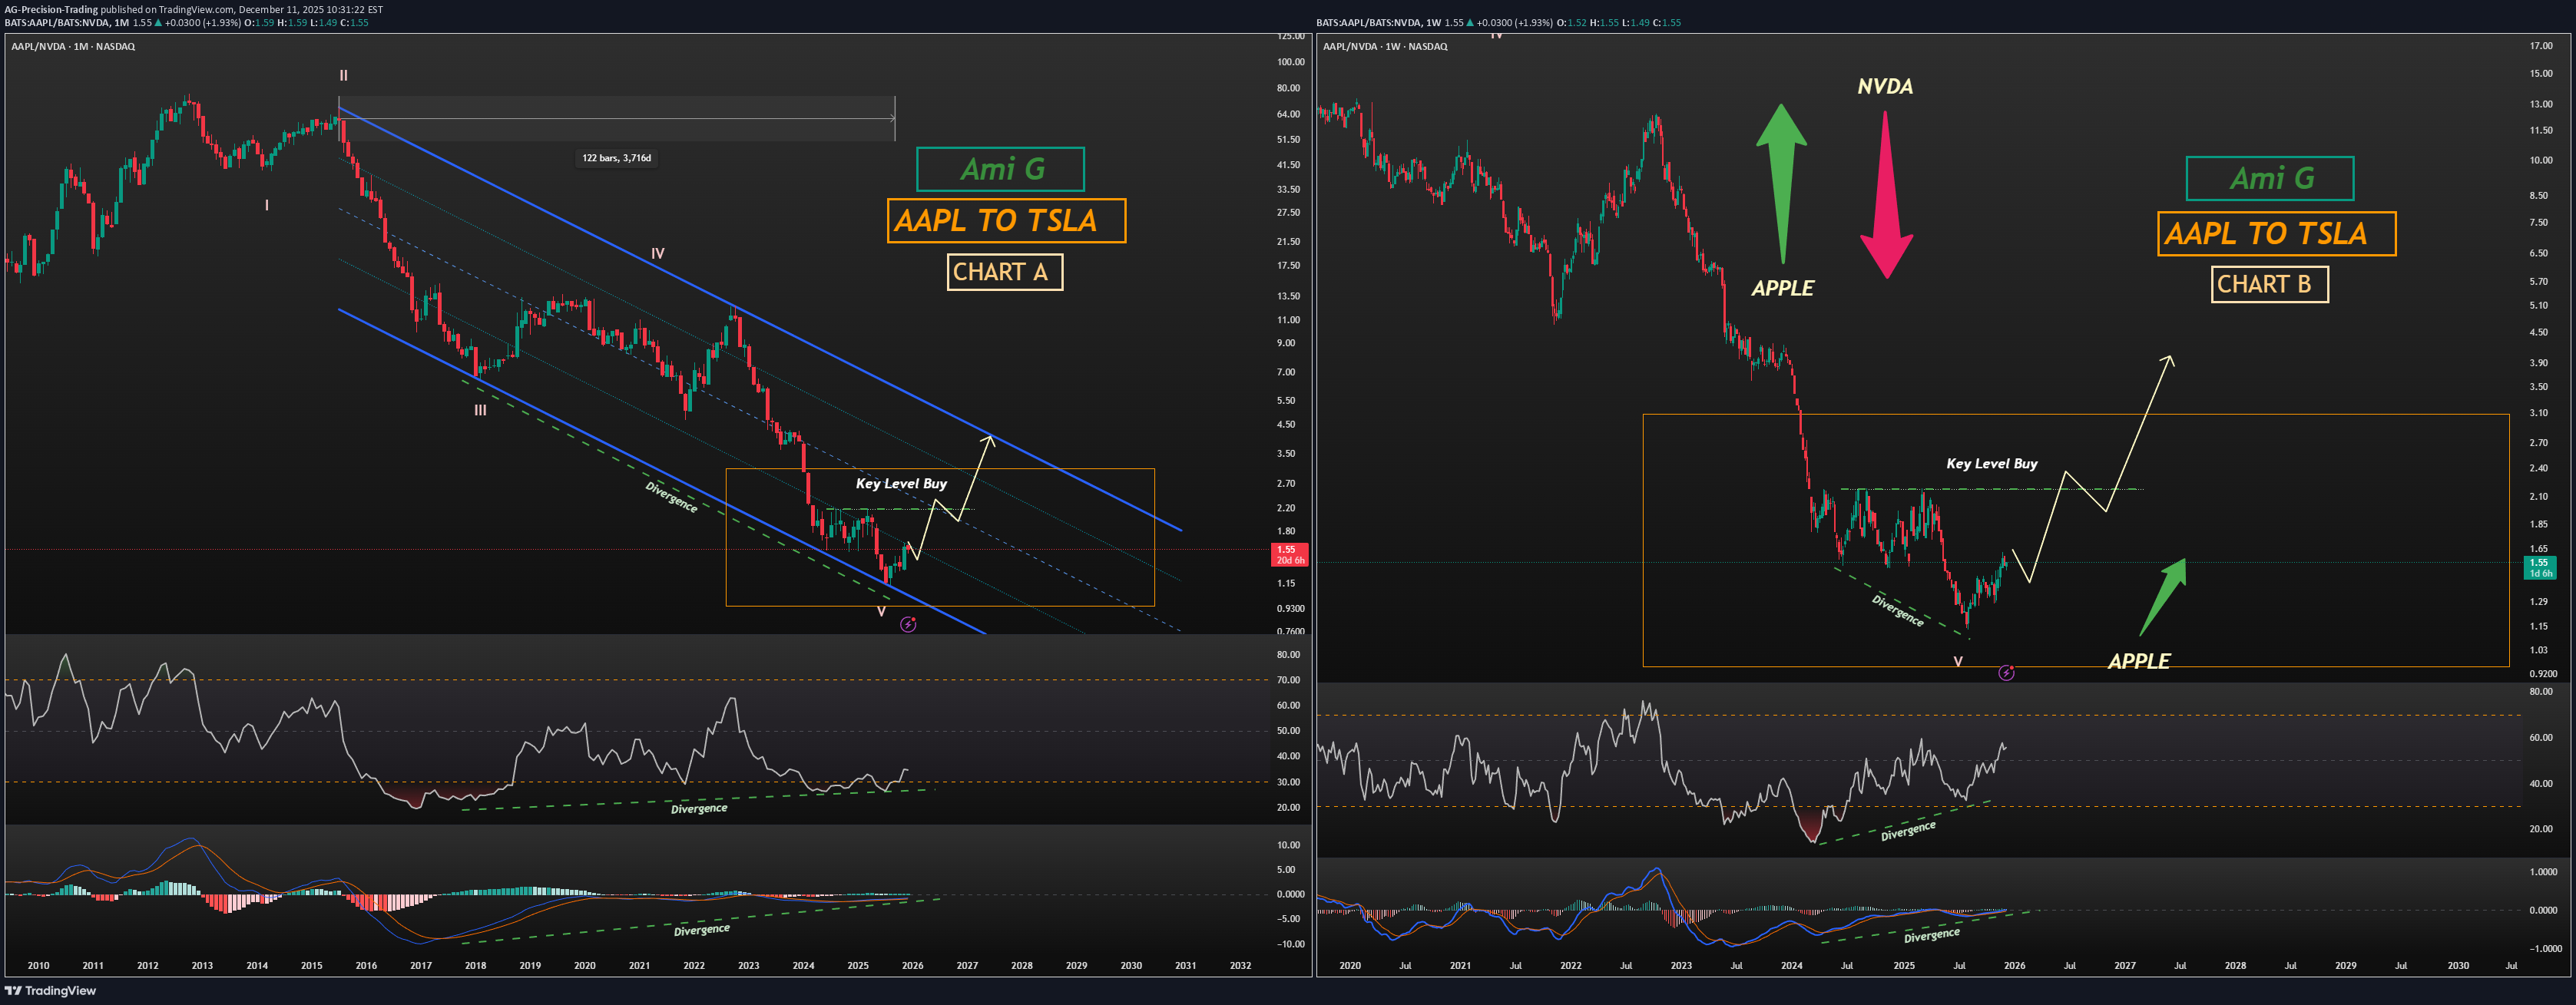
Apple vs. NVIDIA Chart Analysis Does anyone know something we don’t? This chart compares Apple to NVIDIA. As you can see, Apple relative to NVIDIA has completed a clear five-wave structure within a descending channel. Price has now reached the end of wave 5 at the bottom of its 11-year channel, showing a very sharp reaction along with strong divergences in both RSI and MACD on the monthly and weekly timeframes. Based on this, price appears highly likely to rise, potentially reaching at least the channel’s upper boundary. Potential Scenarios This chart outlines four possible scenarios: 1.Both stocks rise, but Apple outperforms NVIDIA. 2.Both stocks decline, but Apple’s drop is more limited. 3.NVIDIA declines, but Apple rises. 4.NVIDIA consolidates, while Apple rises. The trigger comes from RSI, which, considering the lower timeframe divergence on Chart B, provides reasonable reliability. For additional confirmation, one can wait for a key line breakout. Final Notes This is my personal analysis. I’d be glad to hear your thoughts. Follow me on TradingView to access more in-depth analyses and live stock trades.Apple vs NVIDIA
آیا برای فروش بیت کوین زود است؟ هشدار حیاتی قبل از باز کردن پوزیشن شورت BTC
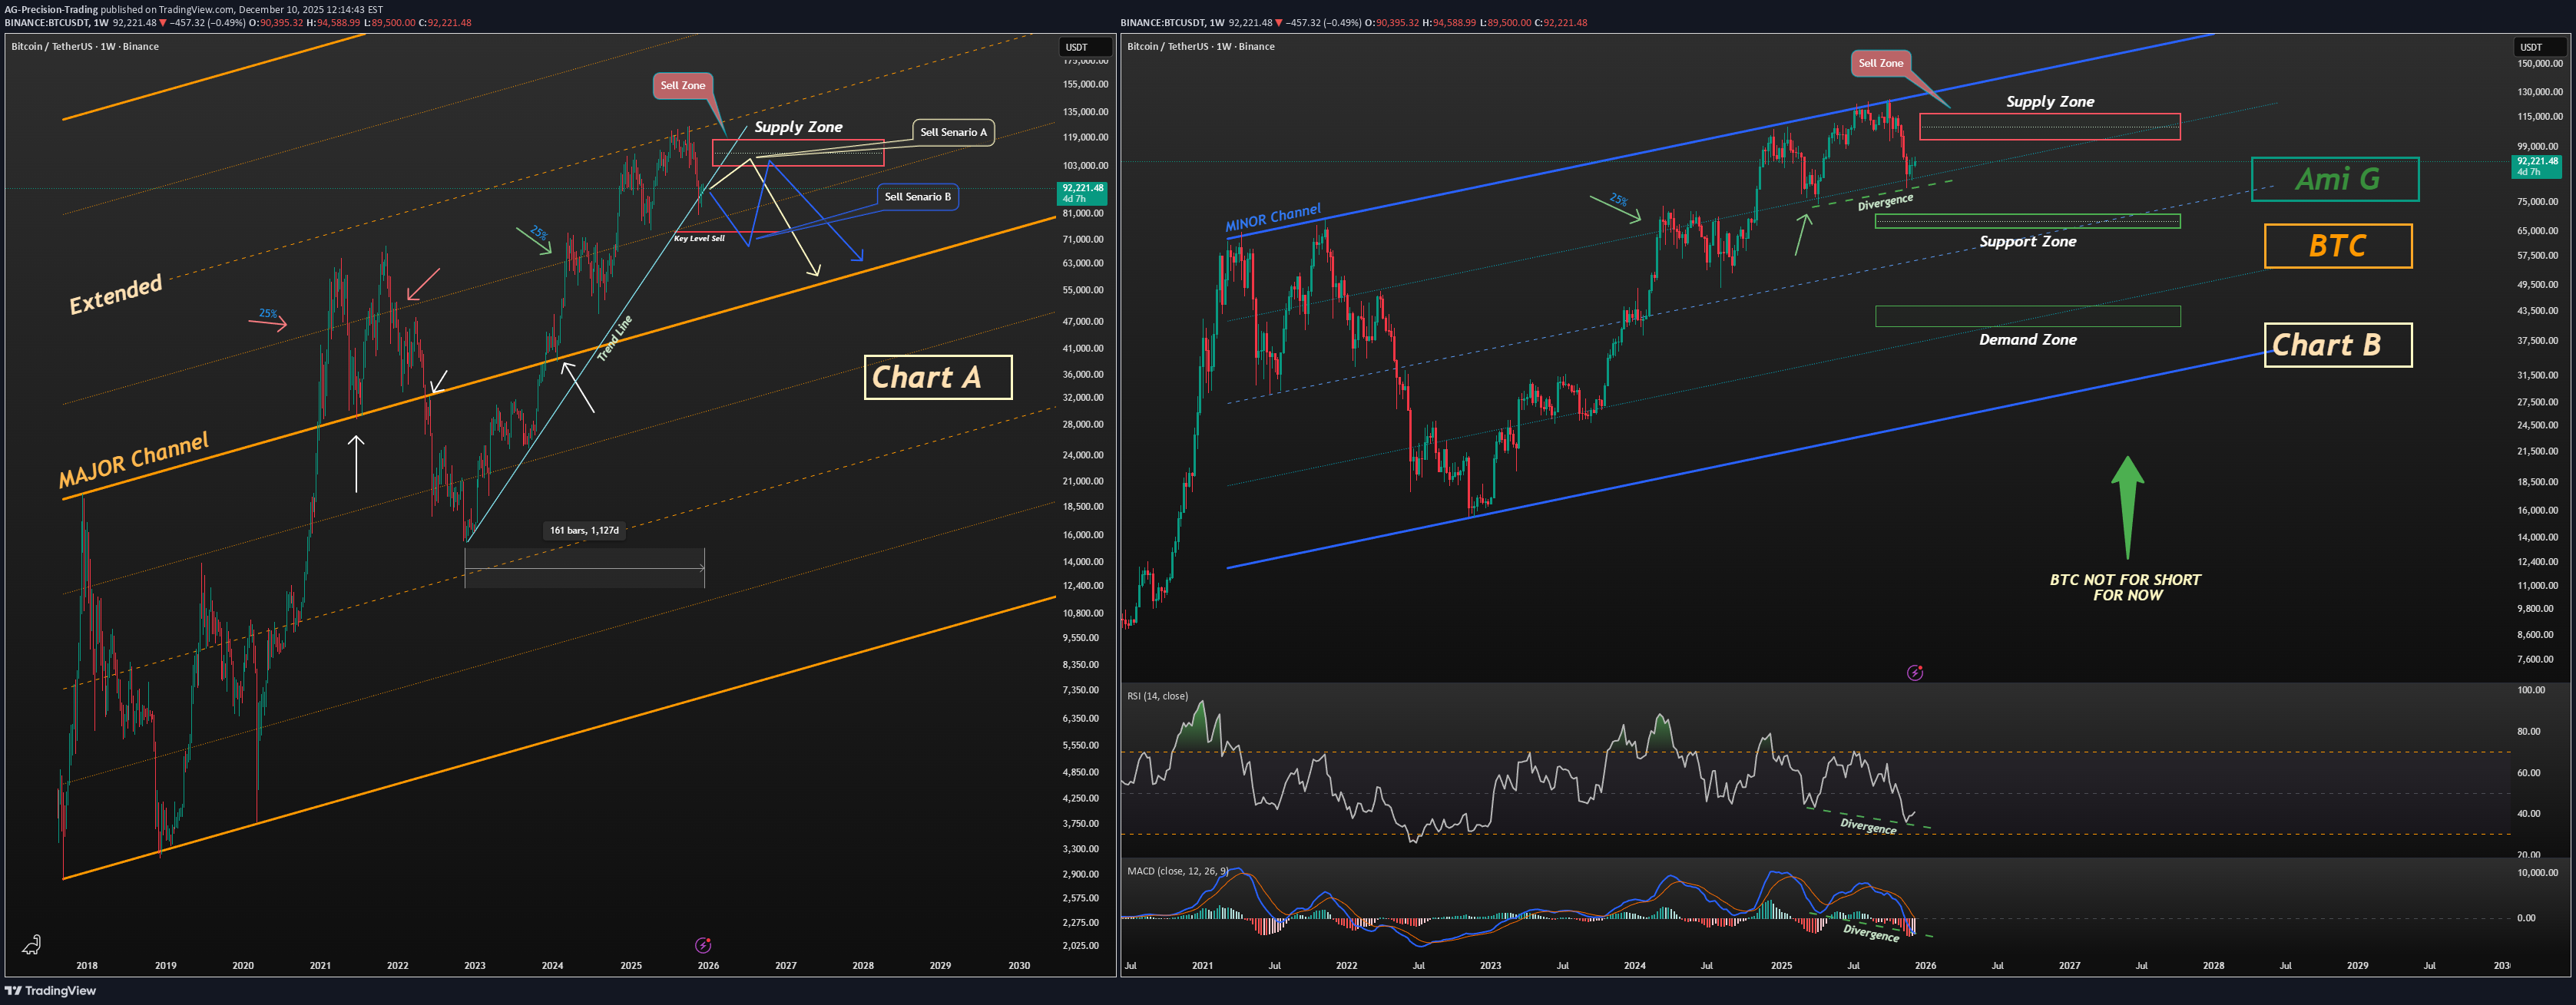
📝 Bitcoin BTCUSDT Short Setup – Why It’s Still Early At the moment, opening a short position on Bitcoin is premature. This does not signal a buying opportunity here — it simply highlights that short positions (especially with leverage) carry high risk from this zone. 📊 Chart A – Major Channel Structure Bitcoin is trading inside a major channel. After breaking out of this structure and extending beyond it, price has shown clean and consistent reactions to the extended boundaries. The latest rejection from the upper zone also aligns with the 50% mid-line, further confirming the significance of this major channel. 📊 Chart B – Short-Term Channel The shorter-term channel also justifies the recent top. However, shorting from the current zone is still too early, and here’s why: Price has reached the 25% reaction zone on both charts This level has repeatedly acted as a sensitive reaction point across multiple timeframes Bitcoin is sitting on its 160-week trendline Clear bullish divergence appears on both MACD and RSI Given these factors, initiating a short here is high-risk and not technically justified yet. 📉 Short Scenarios (Only If Confirmed) Scenario A — Chart A Wait for price to revisit the marked supply zone, then short only with a clear trigger. Scenario B — Chart B A short becomes valid after breaking the key level, followed by a pullback into the supply zone. 📌 Outlook My base view: Bitcoin is likely to correct toward the demand zone shown on Chart B. 📣 Final Note Stay safe, trade smart. Follow the profile so you don’t miss the daily live swing trades and day-trading setups shared here on TradingView.
Relative analysis of Bitcoin vs. Gold and Total Crypto
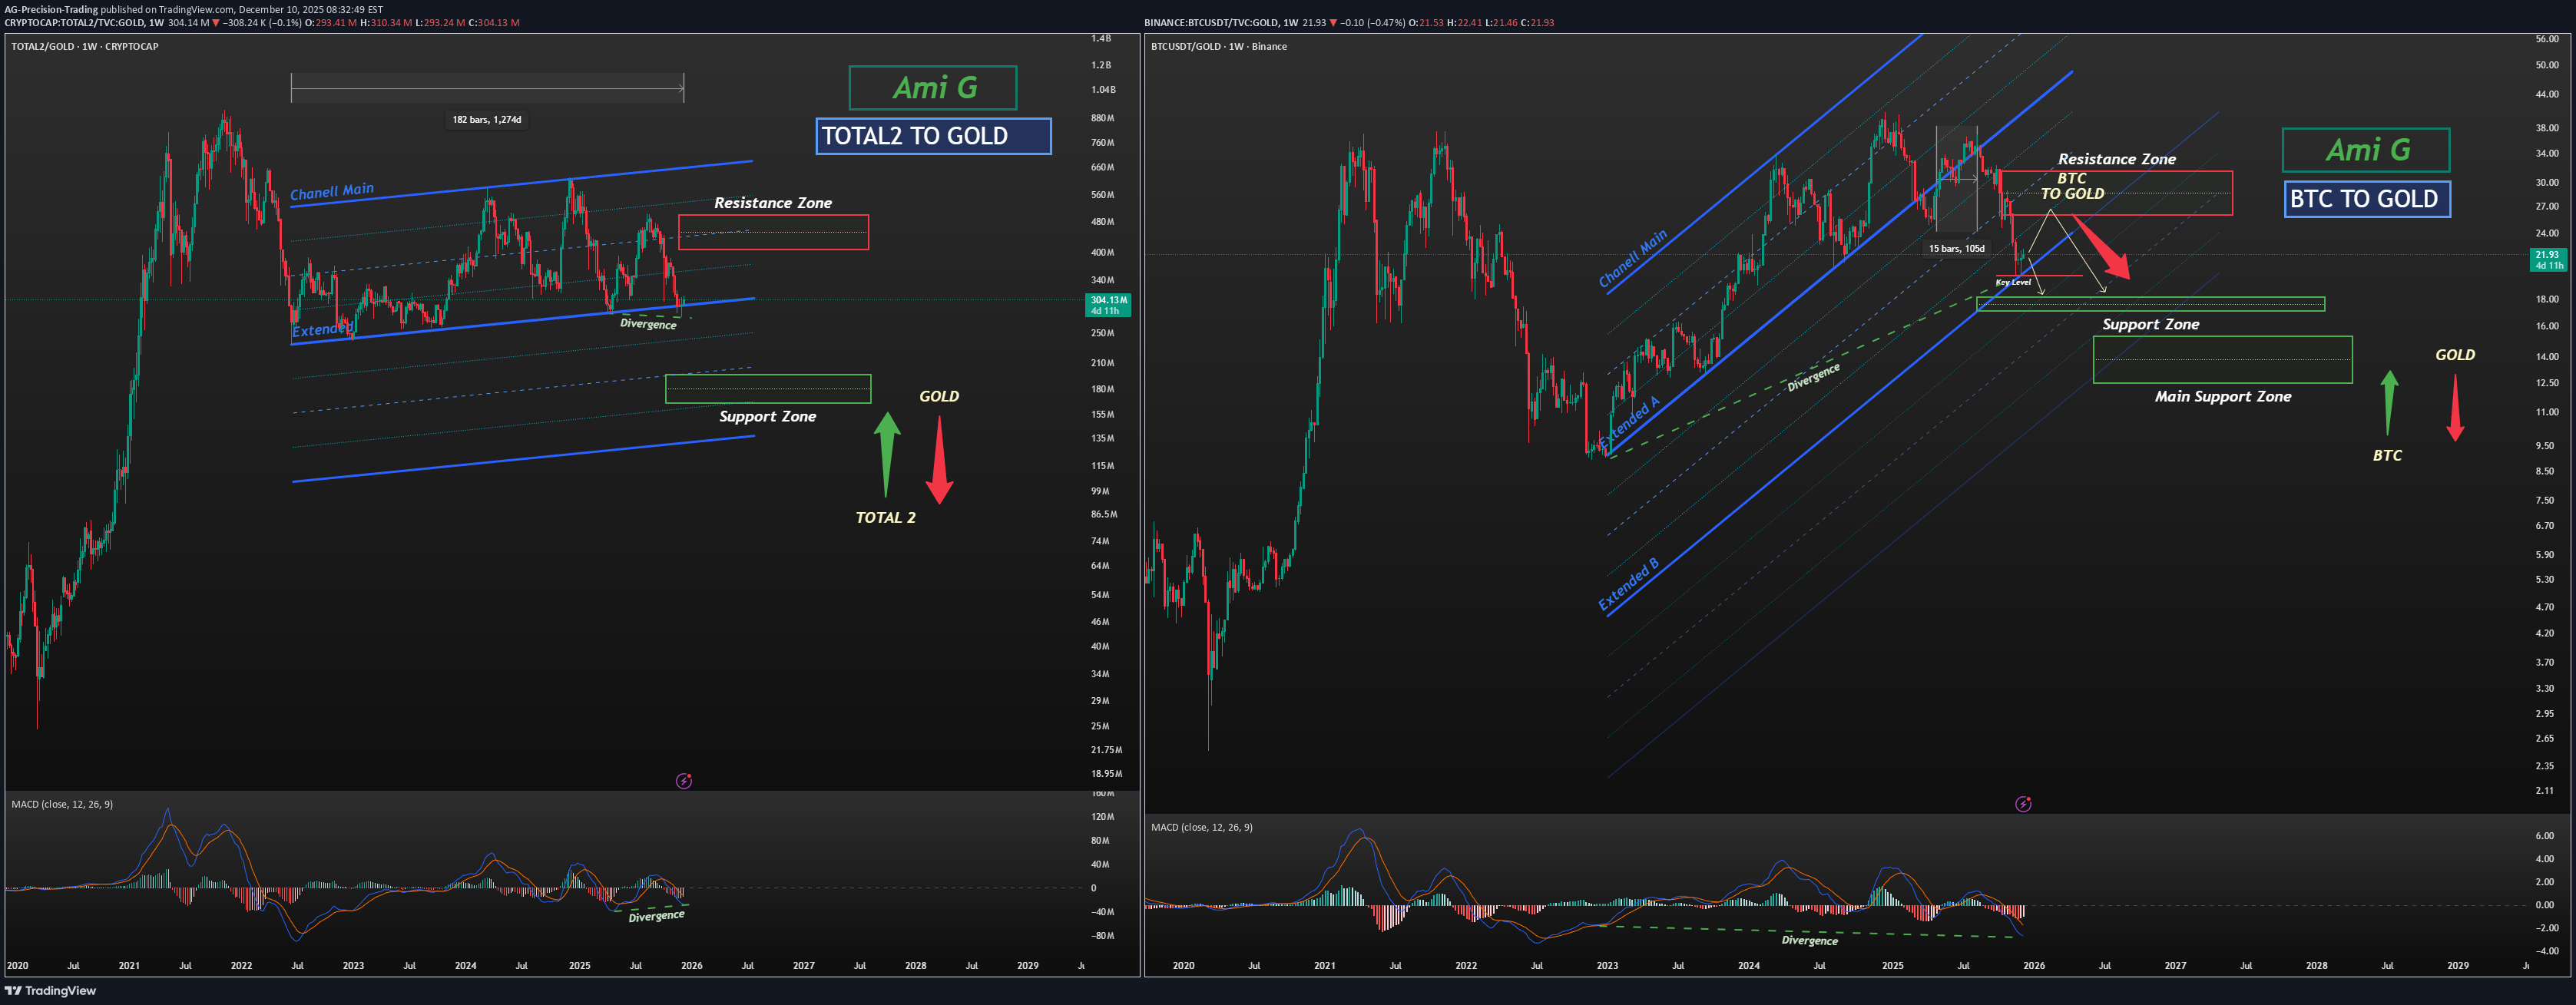
On the BTCUSDT / GOLD ratio chart, price attempted to re-enter the primary channel after the initial breakout, aiming to push back toward the channel’s upper boundary. However, despite (105) days of upward attempts, the ratio consistently struggled with the dynamic resistance area. After the breakdown, price extended toward the lower boundary of the extended channel, where it showed a strong and precise reaction. From here, the structure suggests a potential bullish corrective move toward the resistance zone, supported by: bullish divergence between price and MACD, clear weekly rejection candles, and price interaction at the channel’s lower boundary. This scenario is further reinforced by the Crypto Market Cap (excluding Bitcoin) TOTAL2 vs. Gold GOLD ratio. This chart has also reached the bottom of its (180-week) channel, formed a weekly bullish divergence, and has now returned back inside the channel. As shown on the chart, the TOTAL crypto channel exhibits cleaner and more consistent reactions compared to the Bitcoin channel. If our key level is broken, the bullish scenario becomes invalid, and price is likely to move toward the support zones. This analysis will be updated accordingly. BTCUSDT GOLD TOTAL2
Disclaimer
Any content and materials included in Sahmeto's website and official communication channels are a compilation of personal opinions and analyses and are not binding. They do not constitute any recommendation for buying, selling, entering or exiting the stock market and cryptocurrency market. Also, all news and analyses included in the website and channels are merely republished information from official and unofficial domestic and foreign sources, and it is obvious that users of the said content are responsible for following up and ensuring the authenticity and accuracy of the materials. Therefore, while disclaiming responsibility, it is declared that the responsibility for any decision-making, action, and potential profit and loss in the capital market and cryptocurrency market lies with the trader.