
AlfonsoMoreno
@t_AlfonsoMoreno

What symbols does the trader recommend buying?
Purchase History
پیام های تریدر
Filter
AlfonsoMoreno
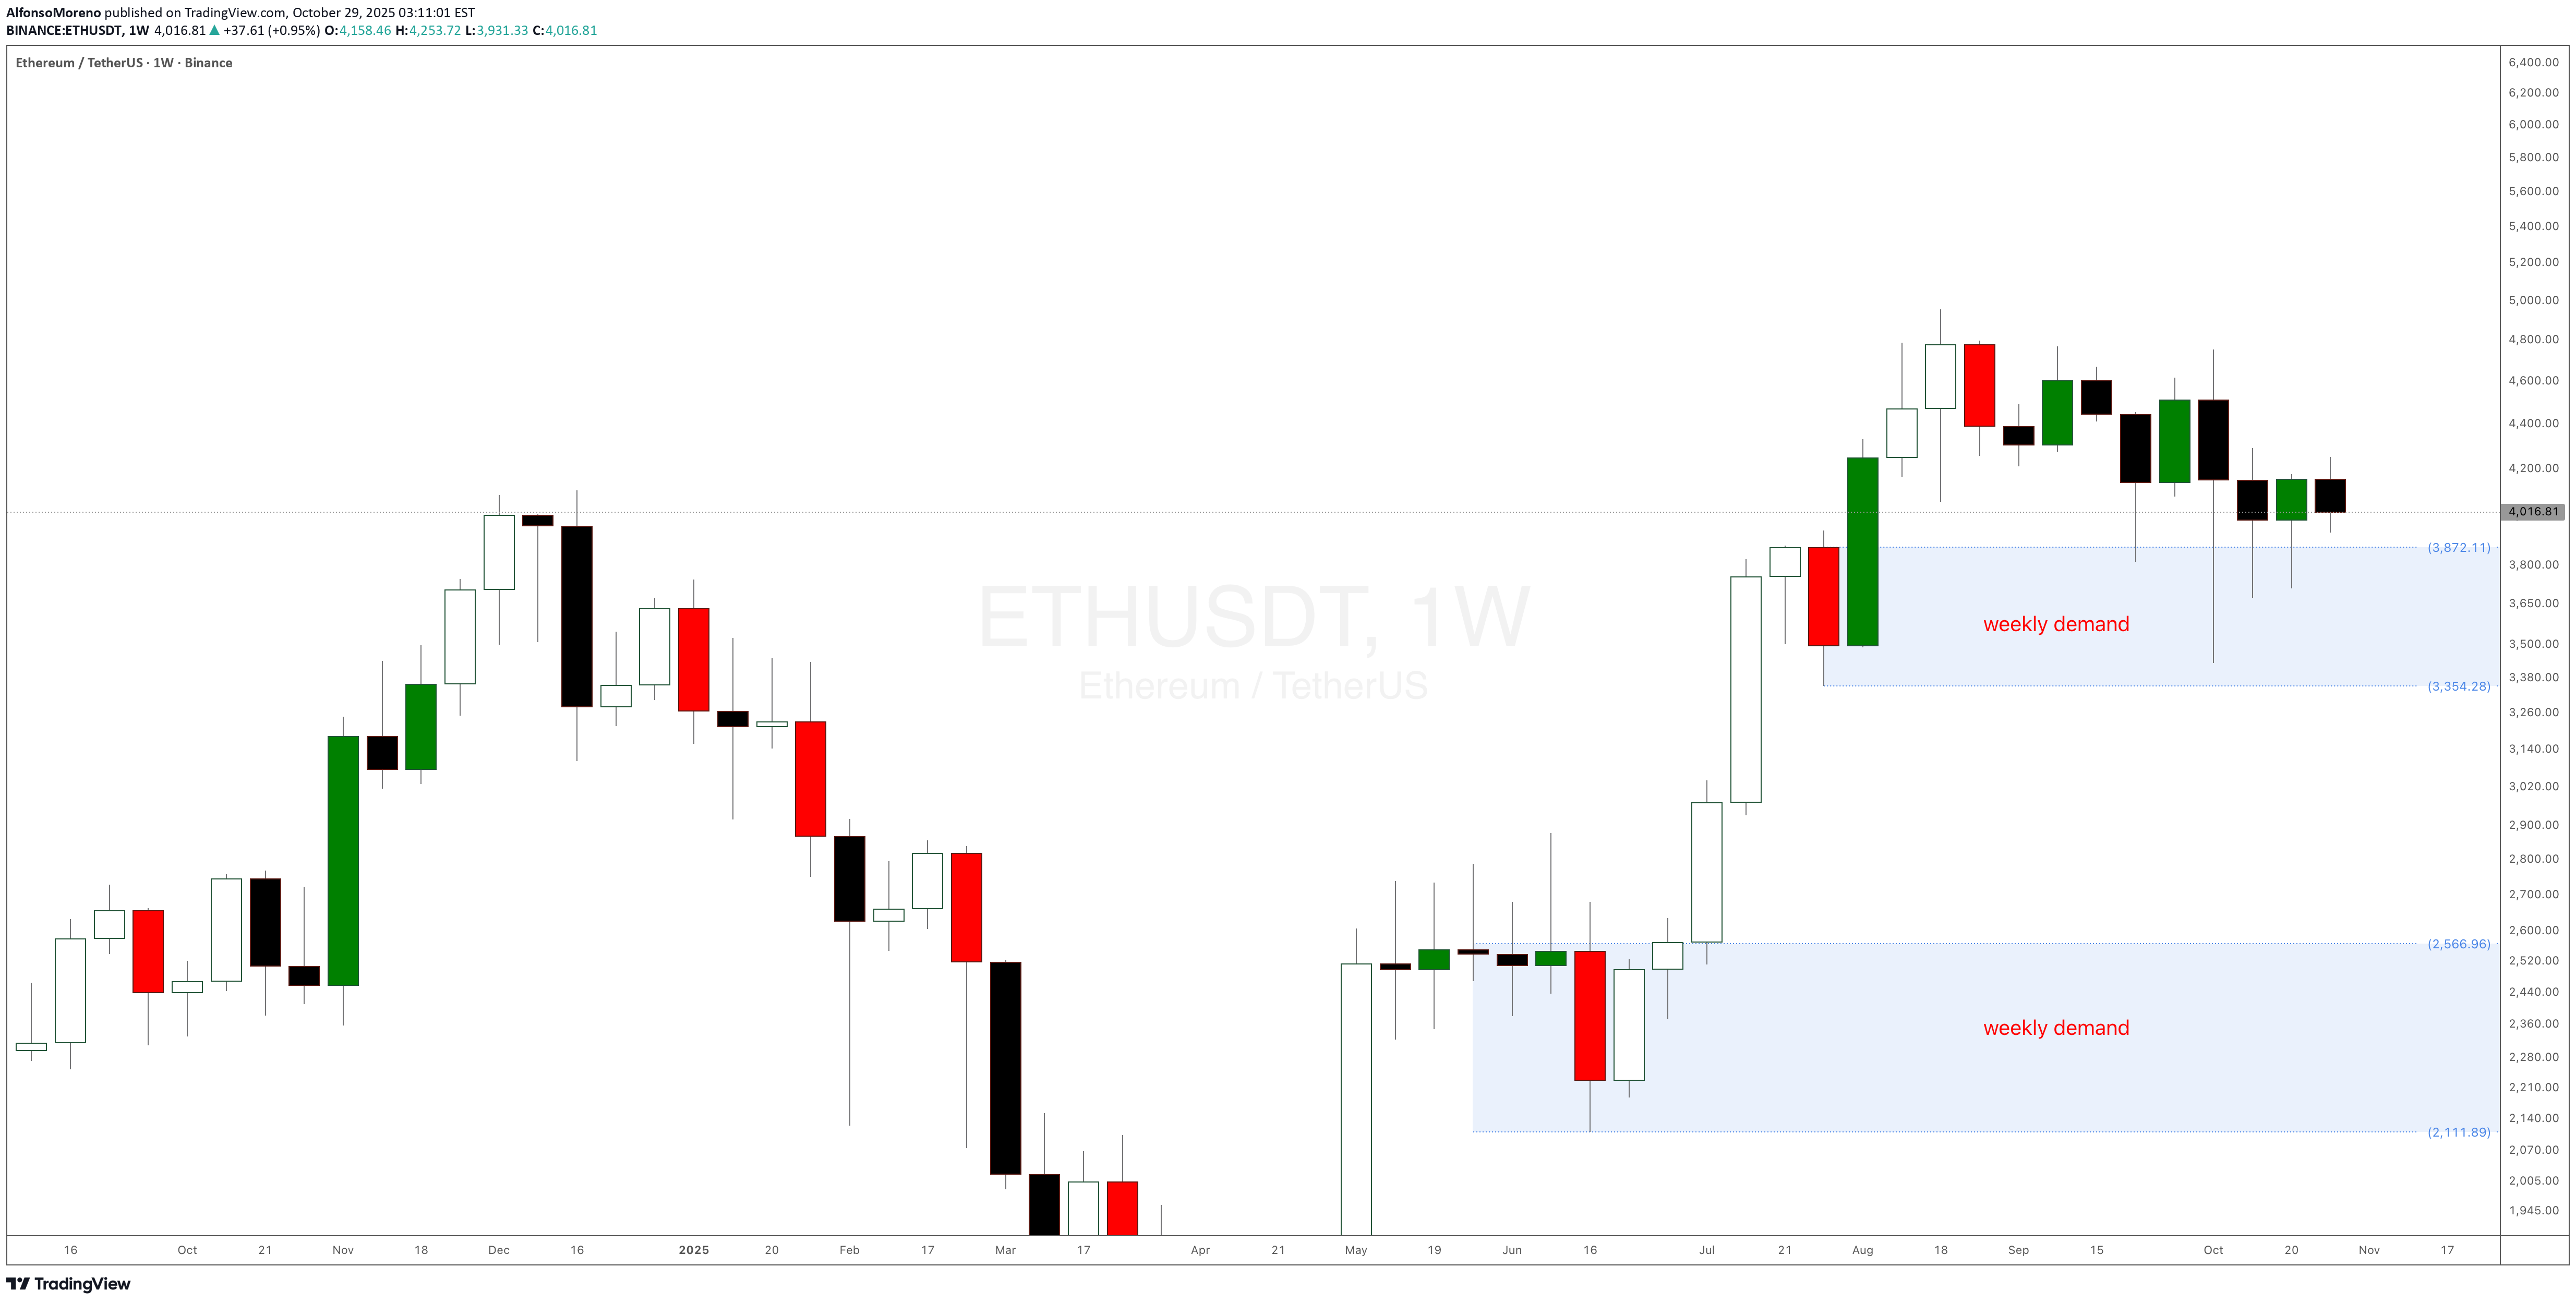
کنترل تقاضای هفتگی اتریوم ($ETH): آیا آماده صعود است یا منتظر پولبک به ۲۶۰۰ دلار؟
AlfonsoMoreno
Ethereum $ETH crypto trade idea using the weekly demand level
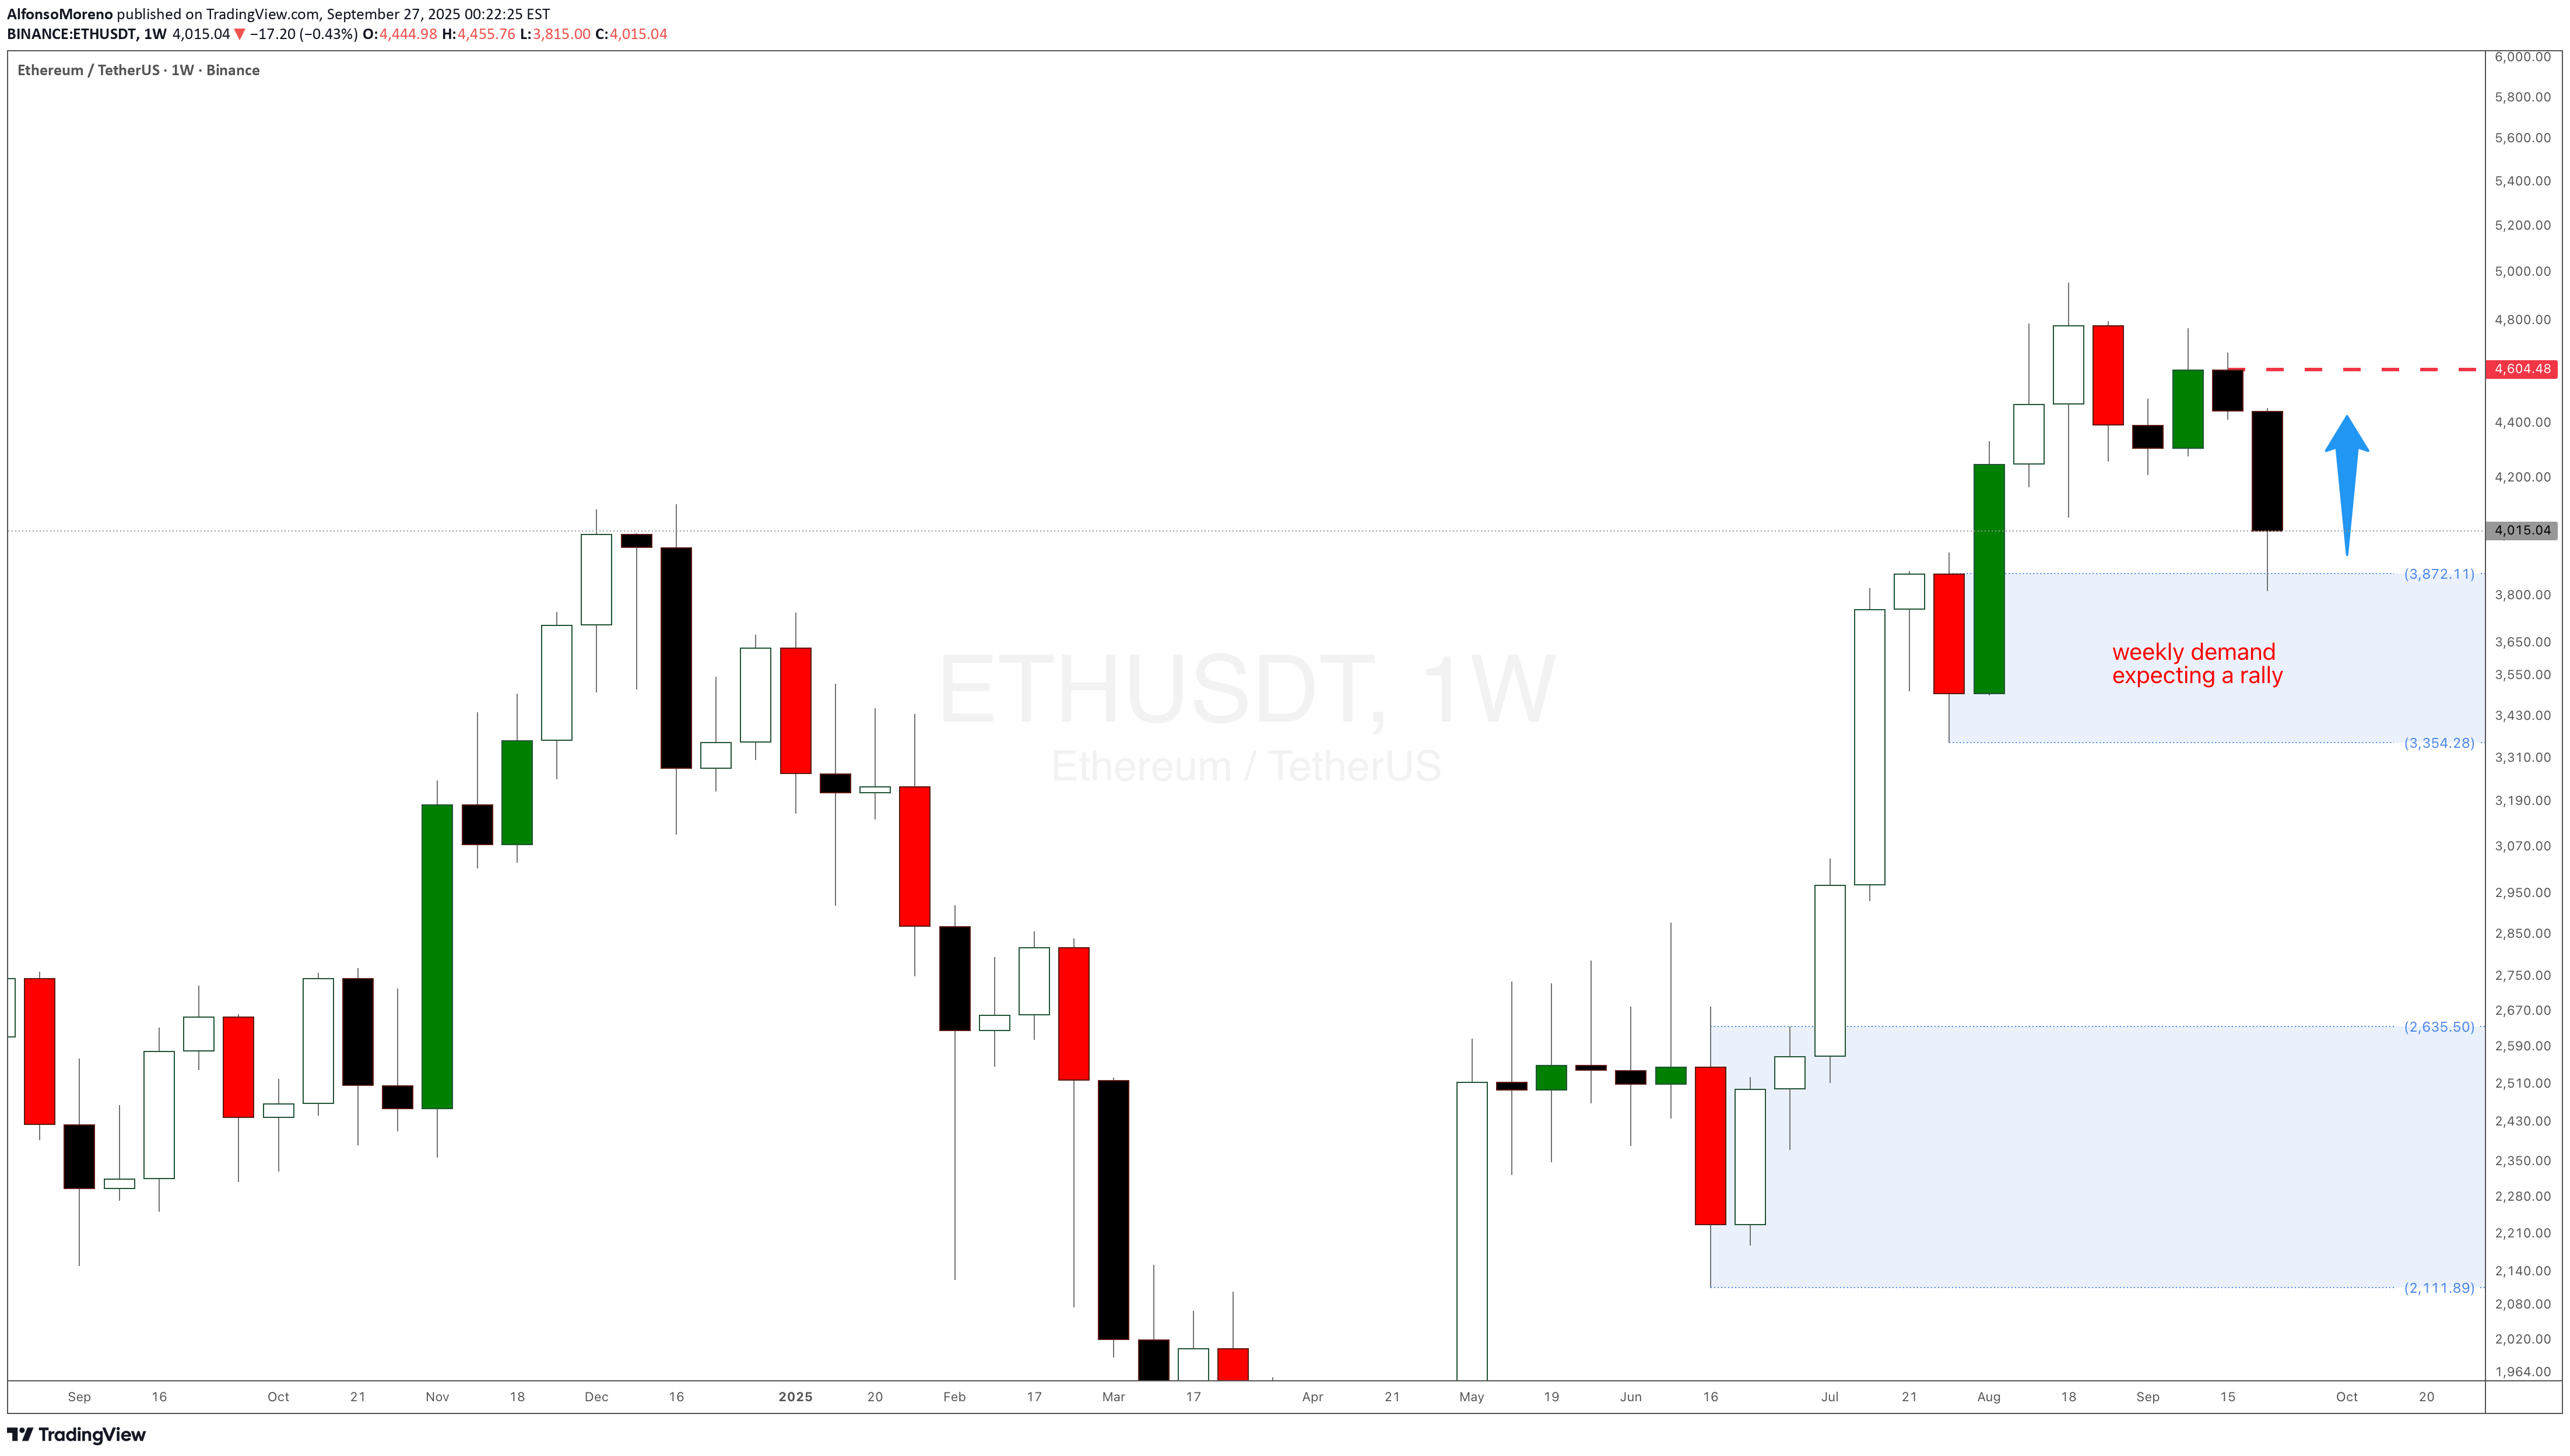
There is an Ethereum ETH crypto trade idea using the weekly demand at $3,872. This is a very similar crypto swing trade idea I recently shared with BitCoin. Let's see if it wants to rally for a couple of weeks. You can use the smaller timeframes to trade crypto intraday strategies or scalping strategies.
AlfonsoMoreno
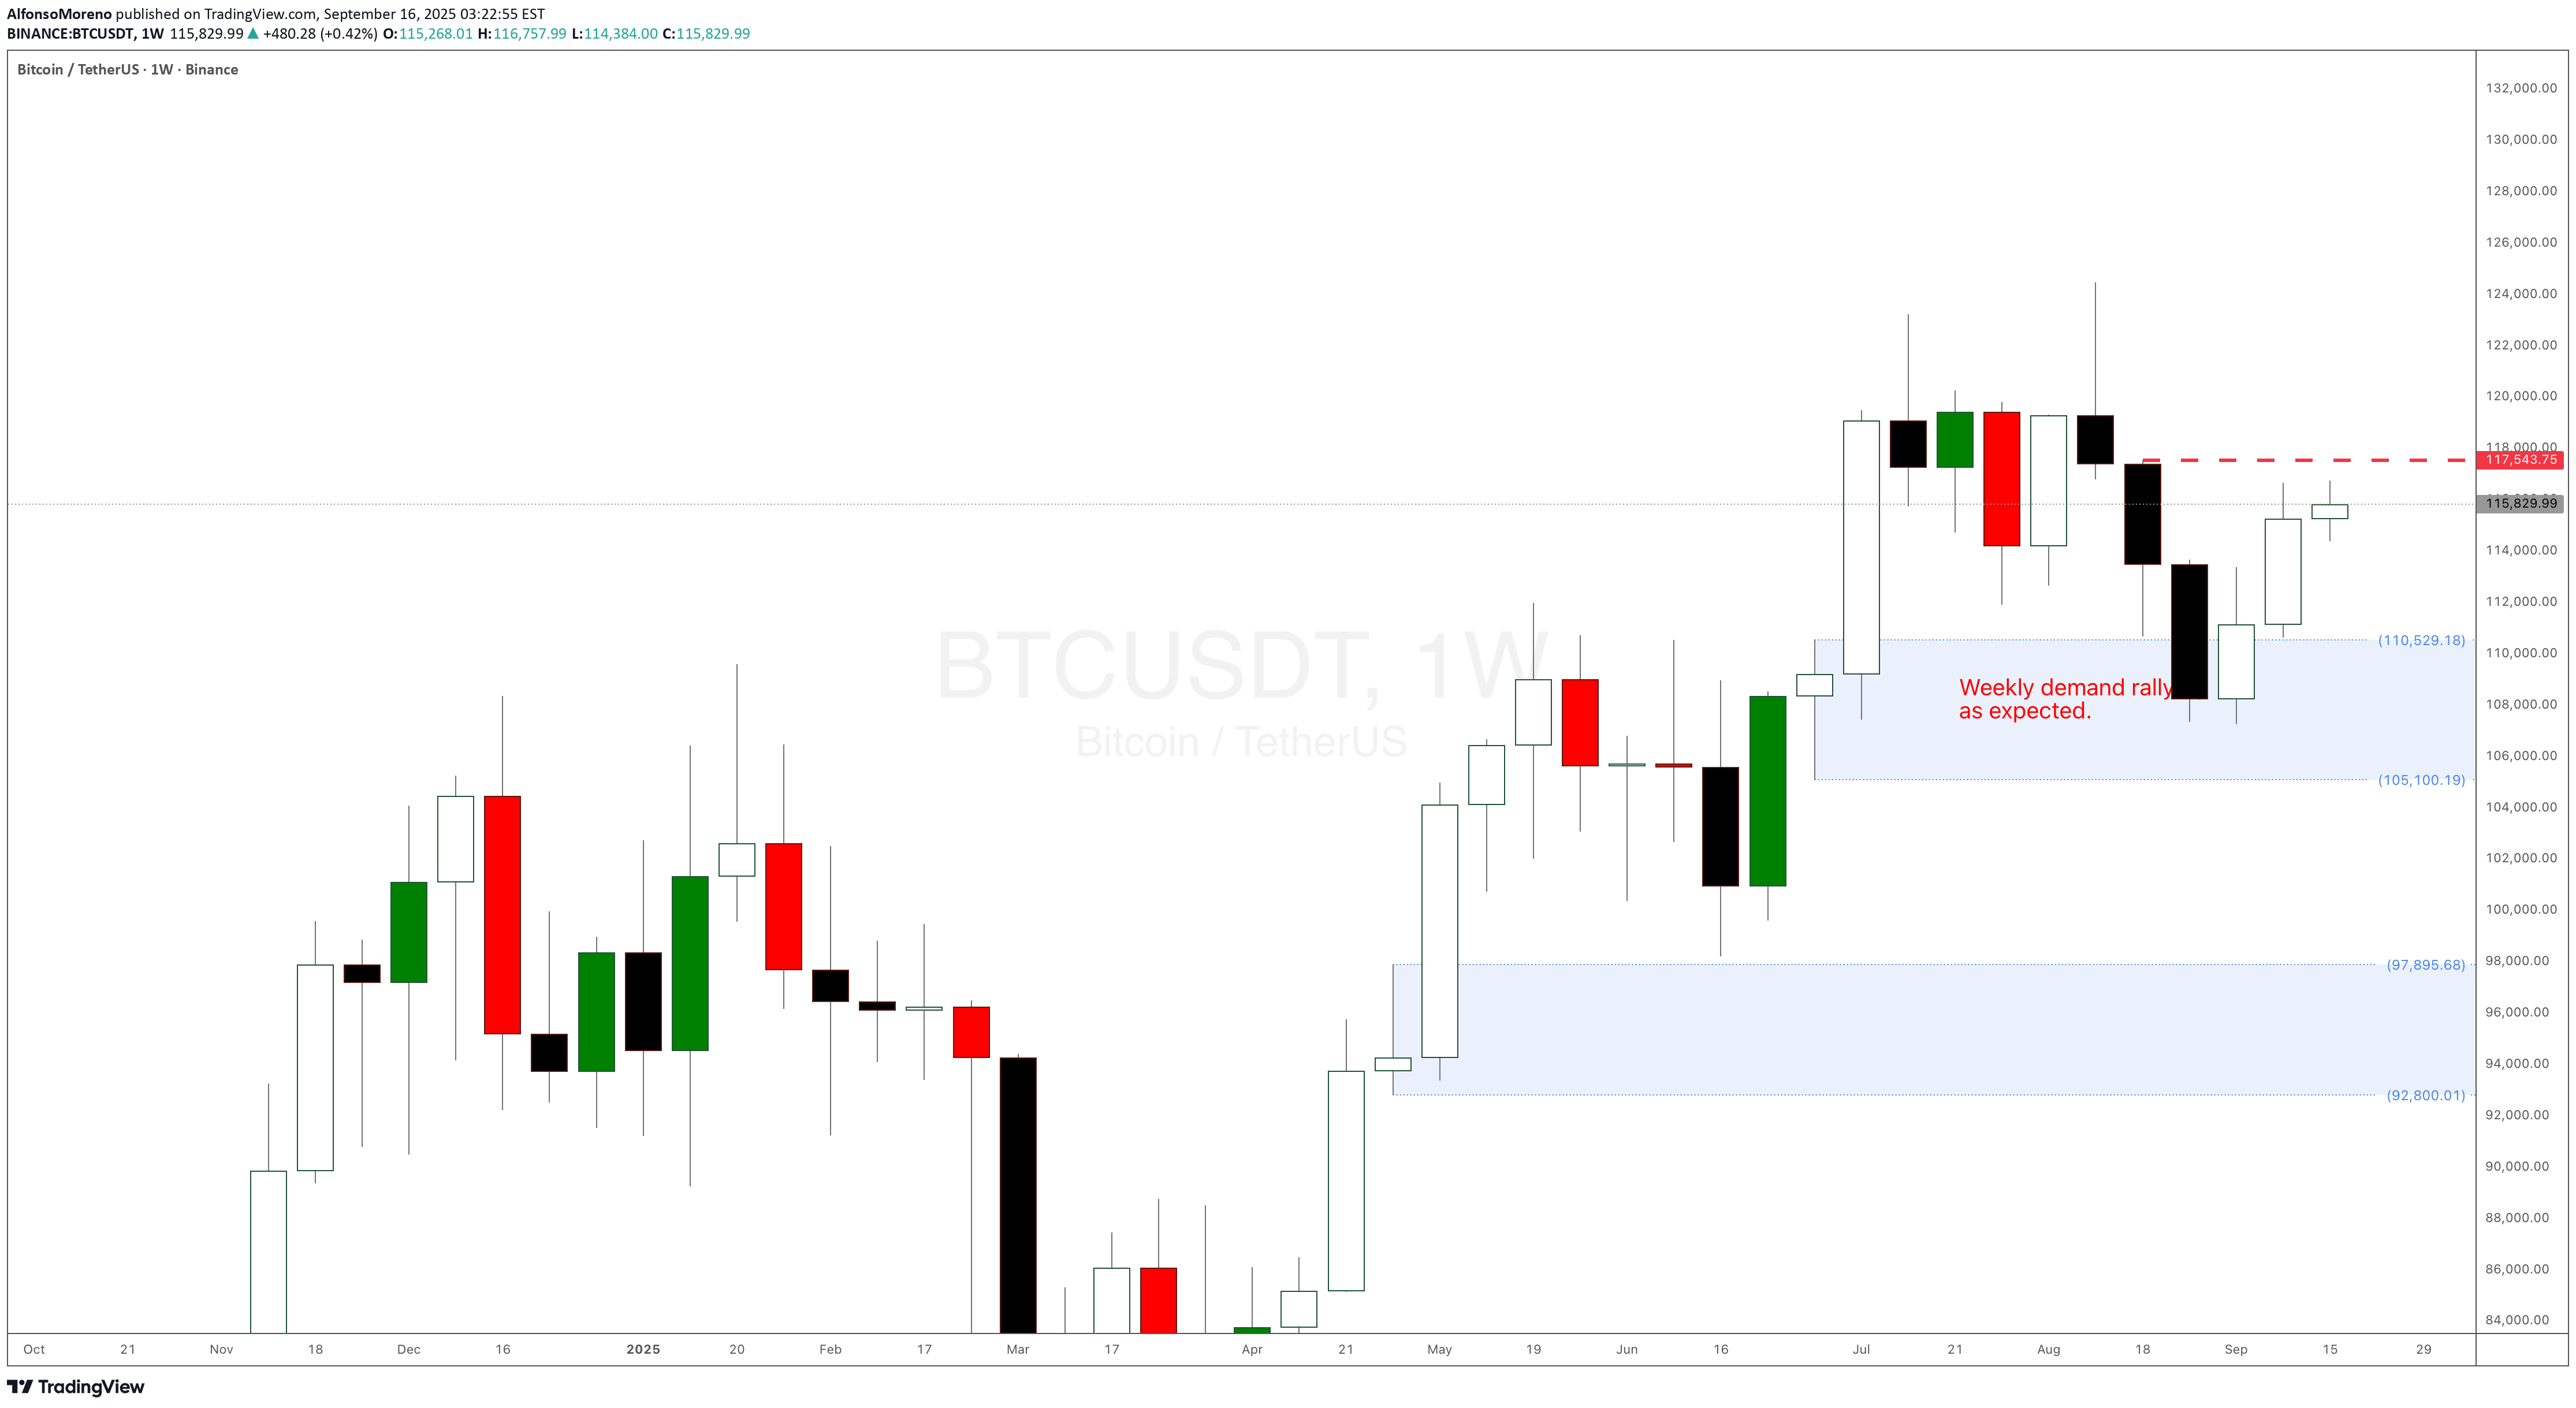
BitCoin $BTC weekly demand level helping the strong rally
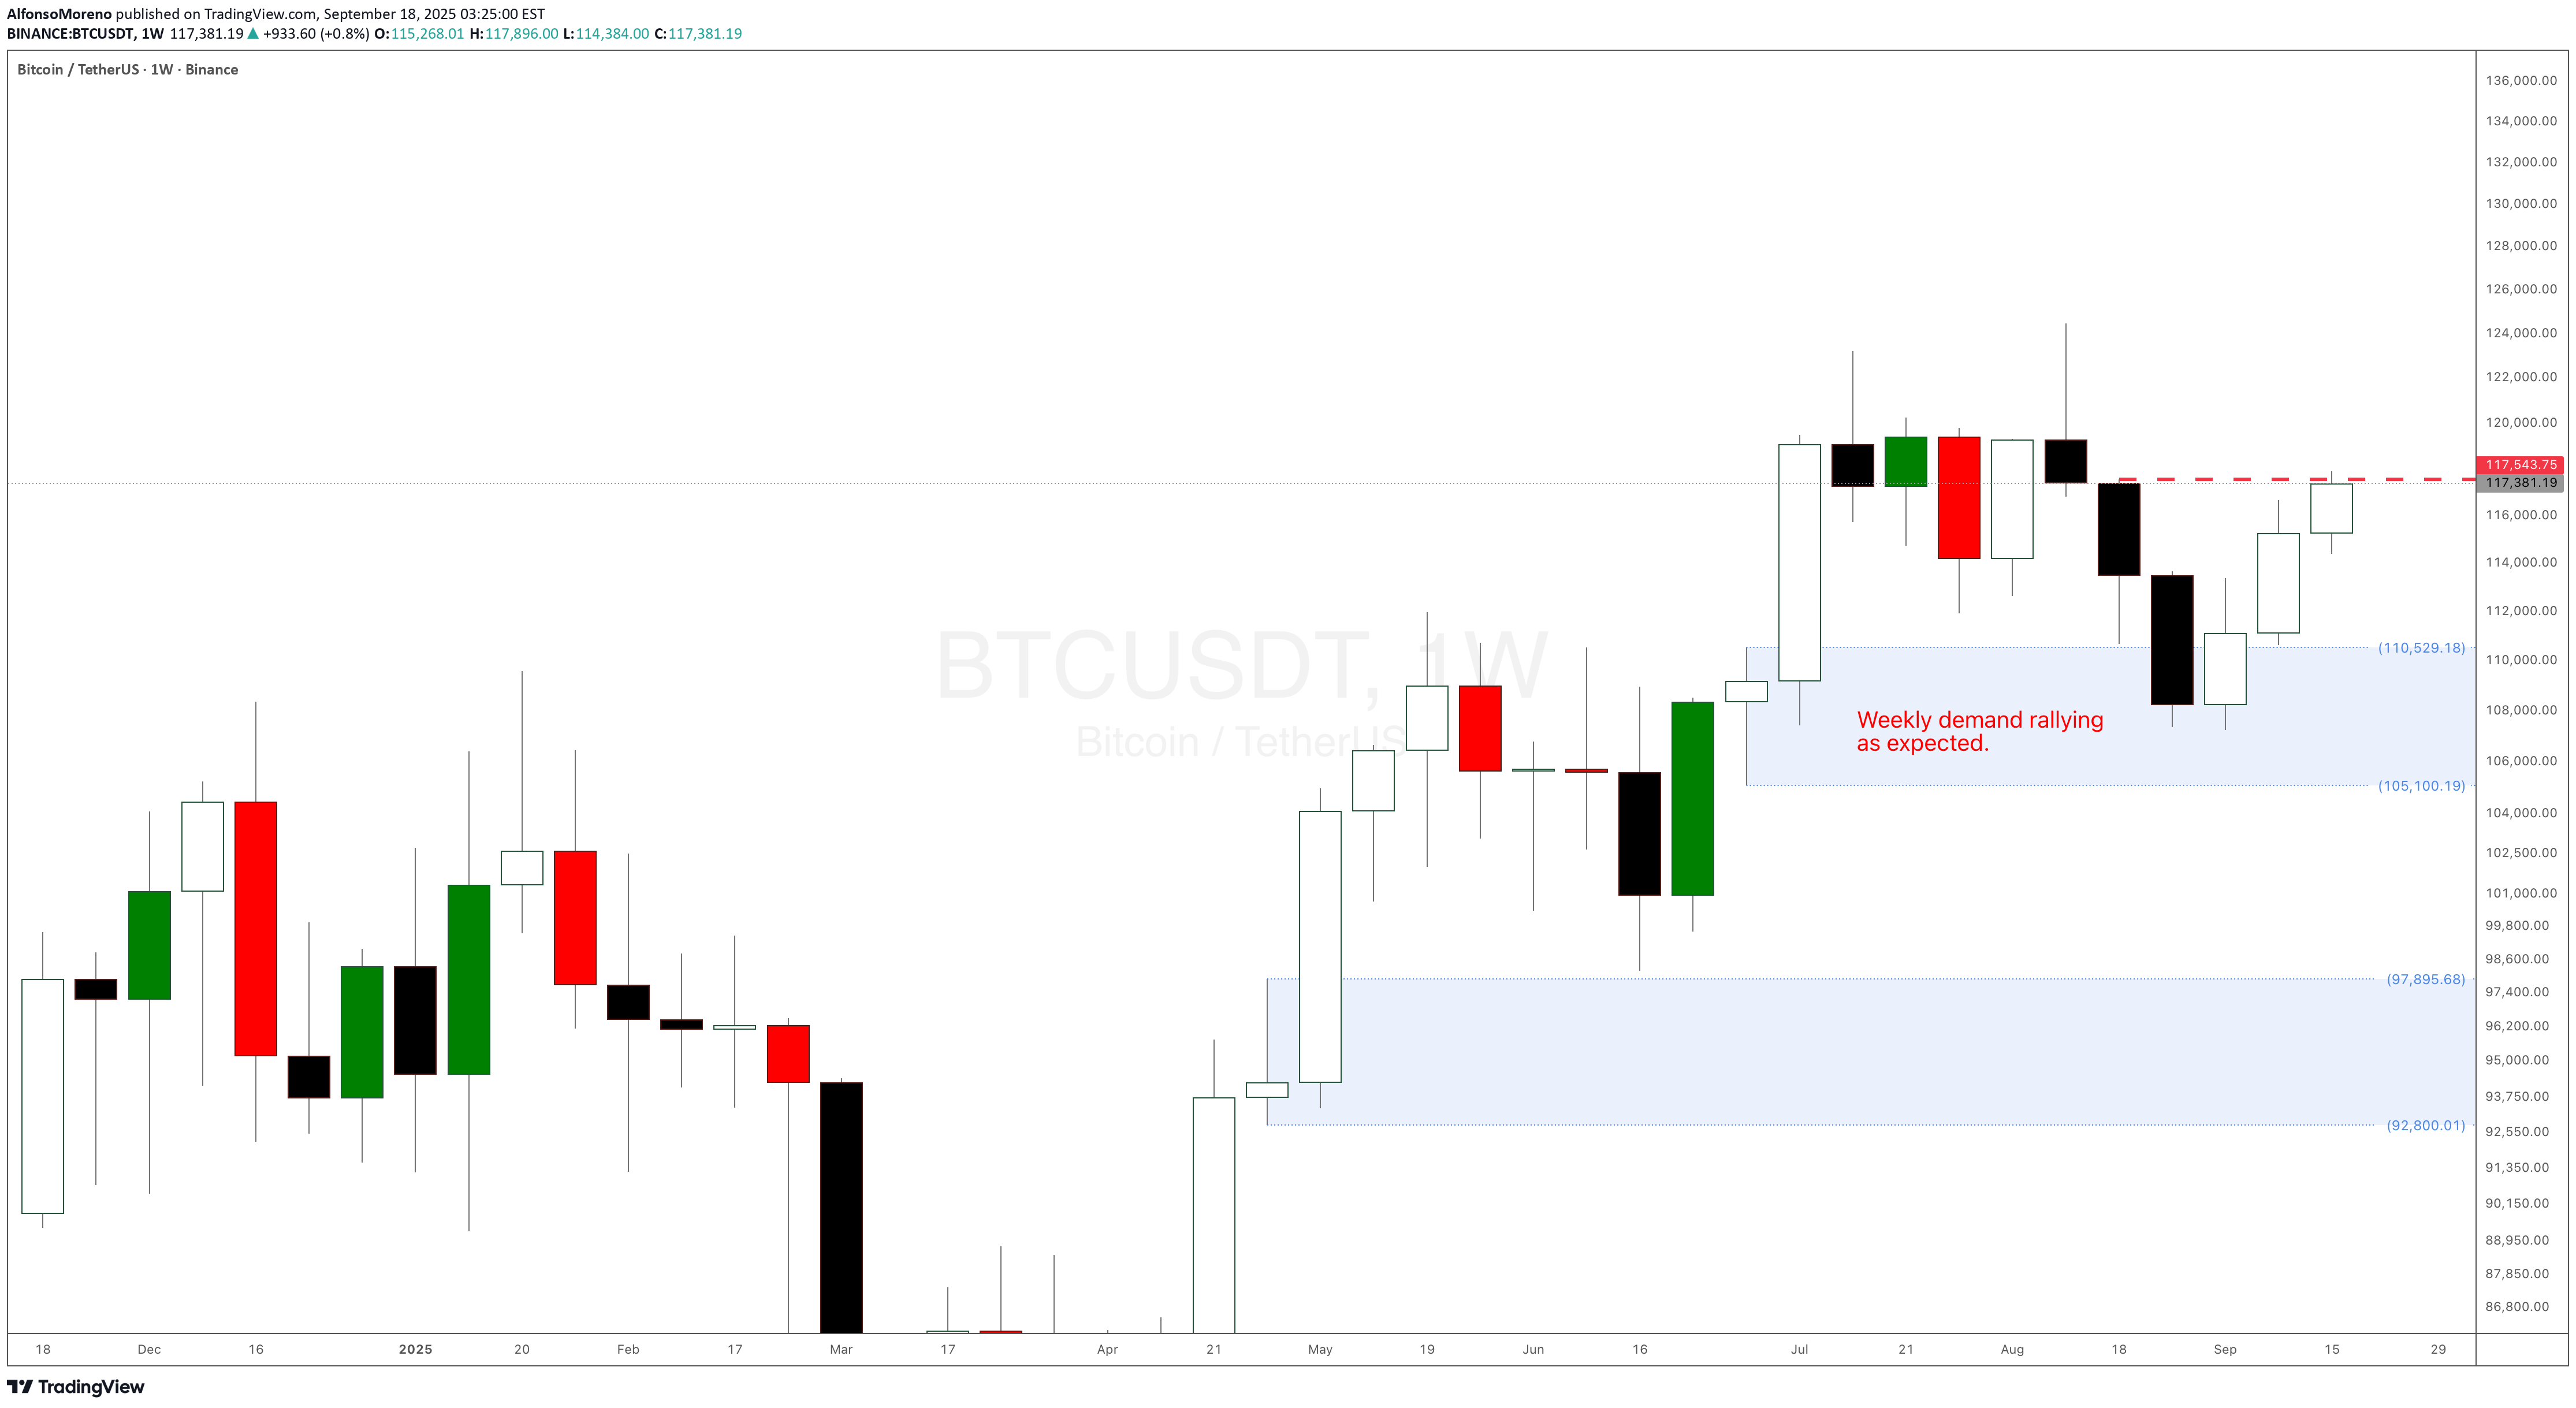
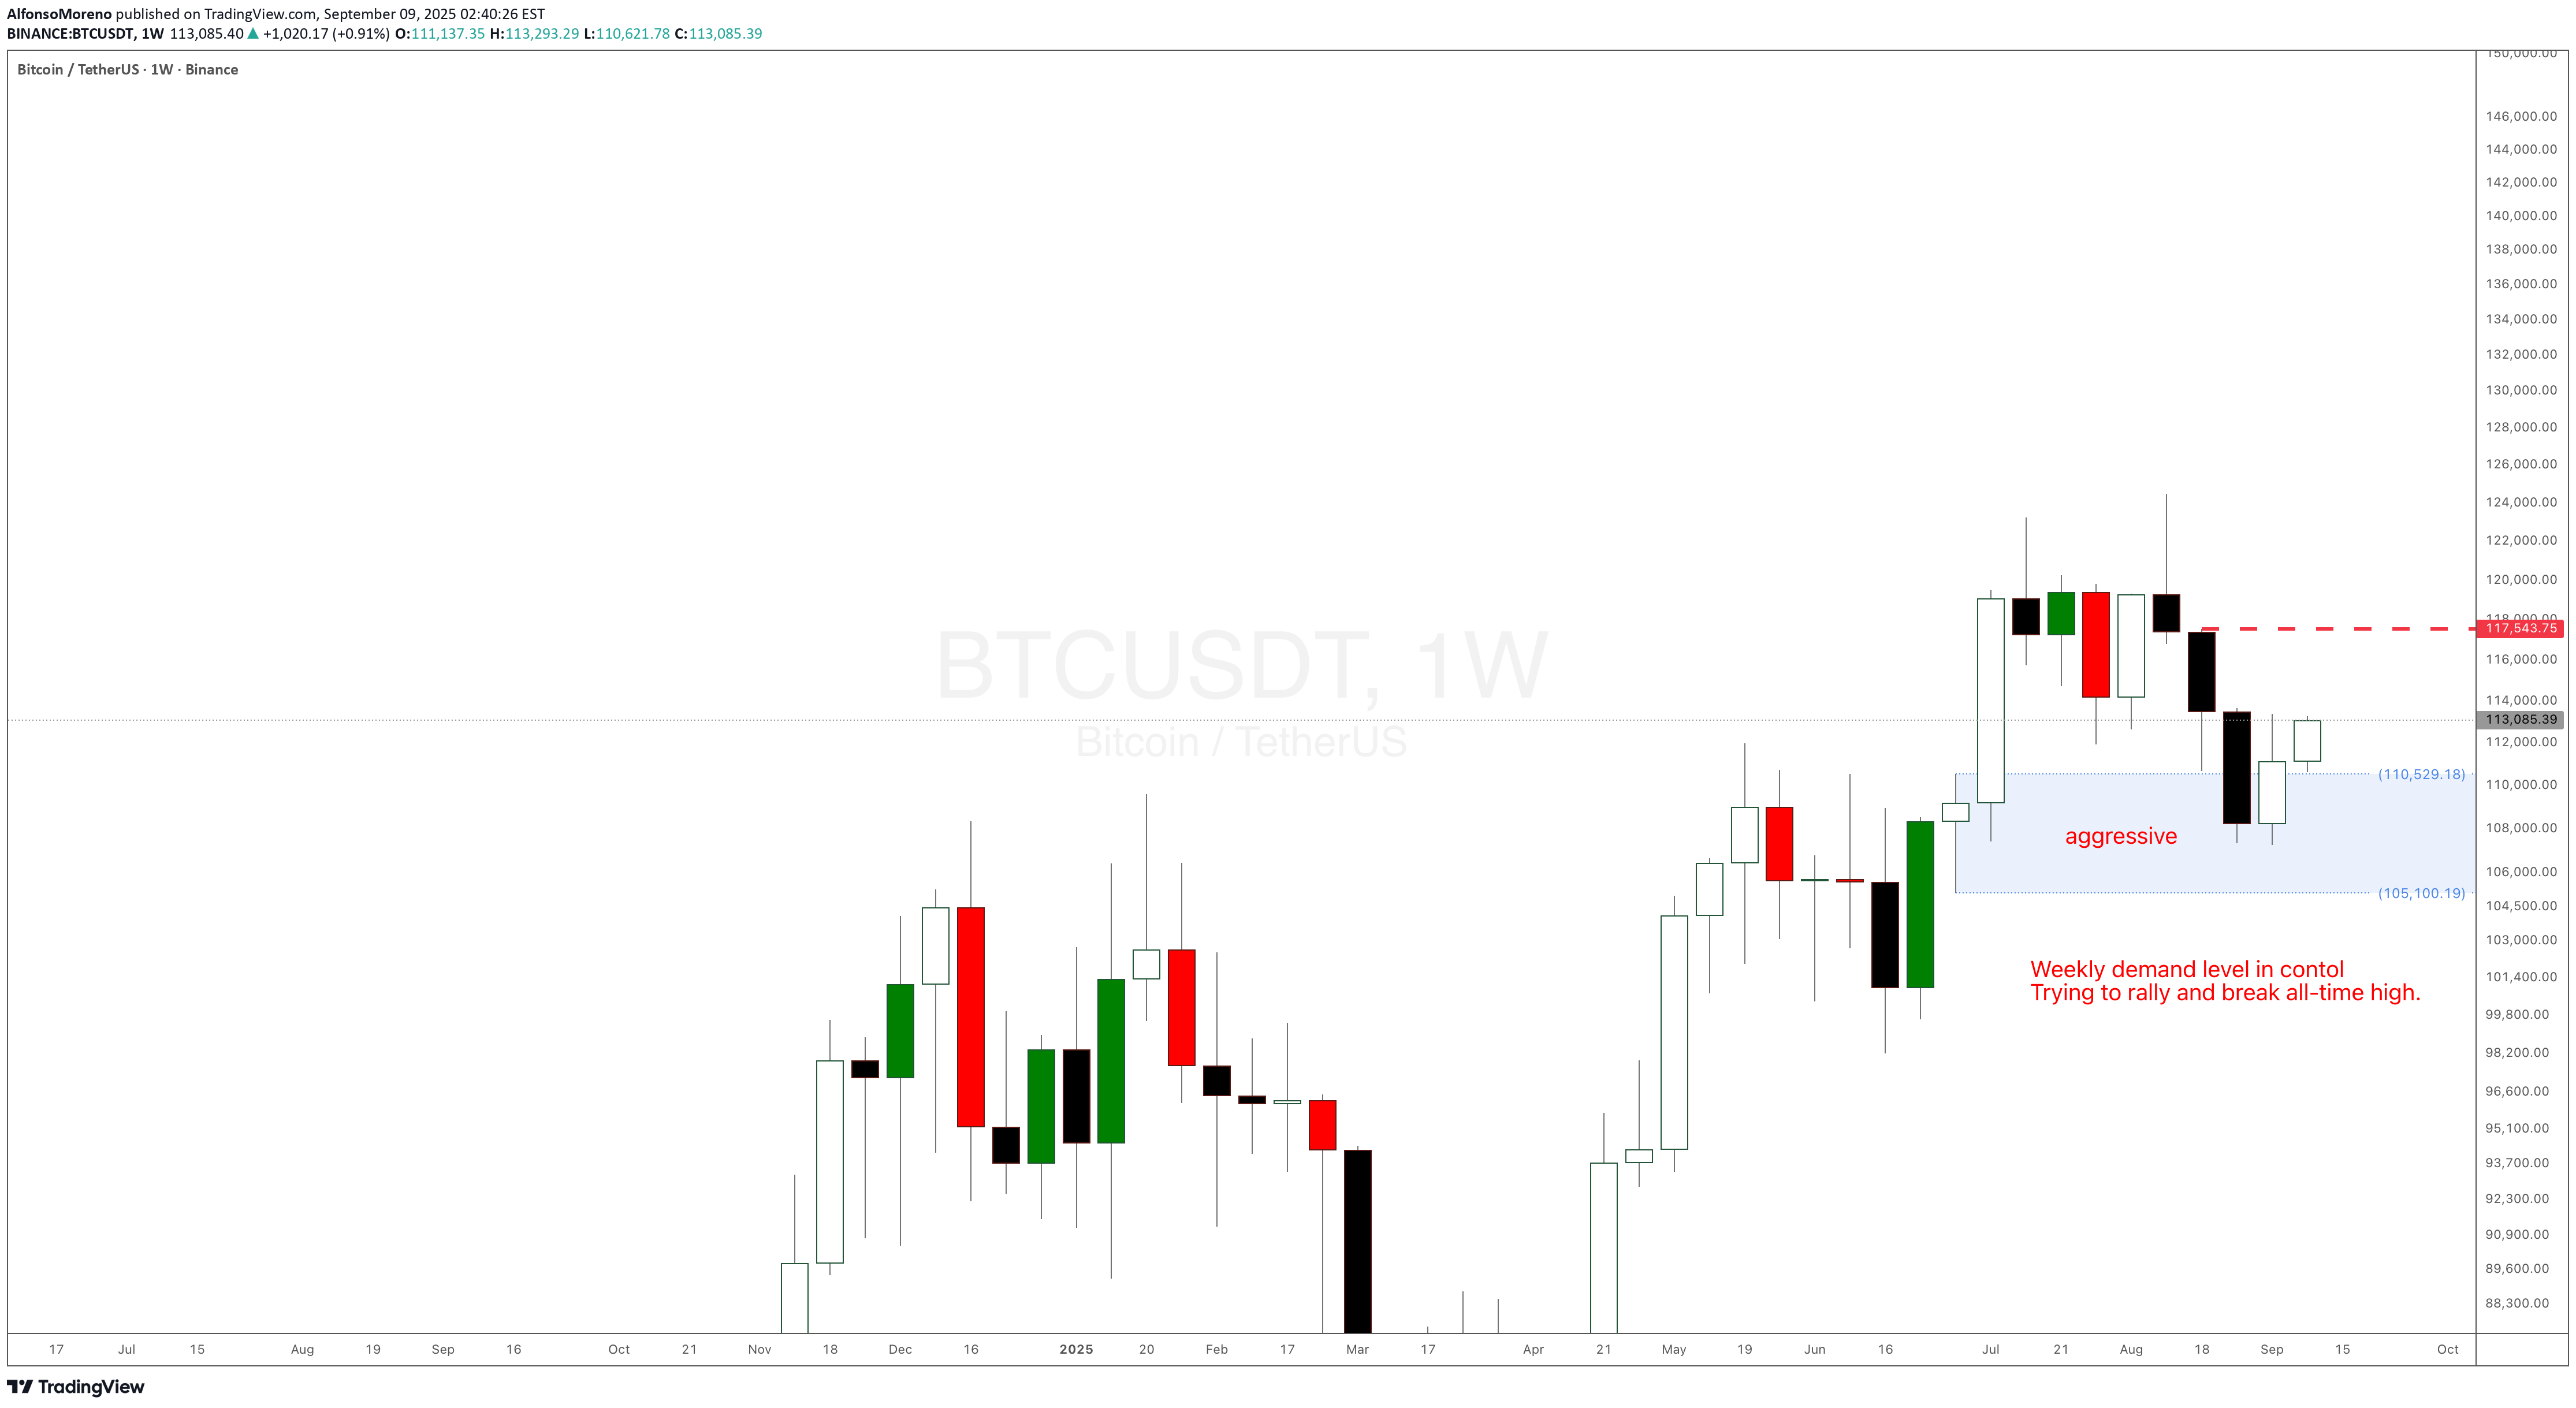
Weekly demand imbalance is still in control and is playing out well. A third large bullish candlestick body is being created. Trying to break the resistance level and the all-time highs.
AlfonsoMoreno
AlfonsoMoreno
AlfonsoMoreno
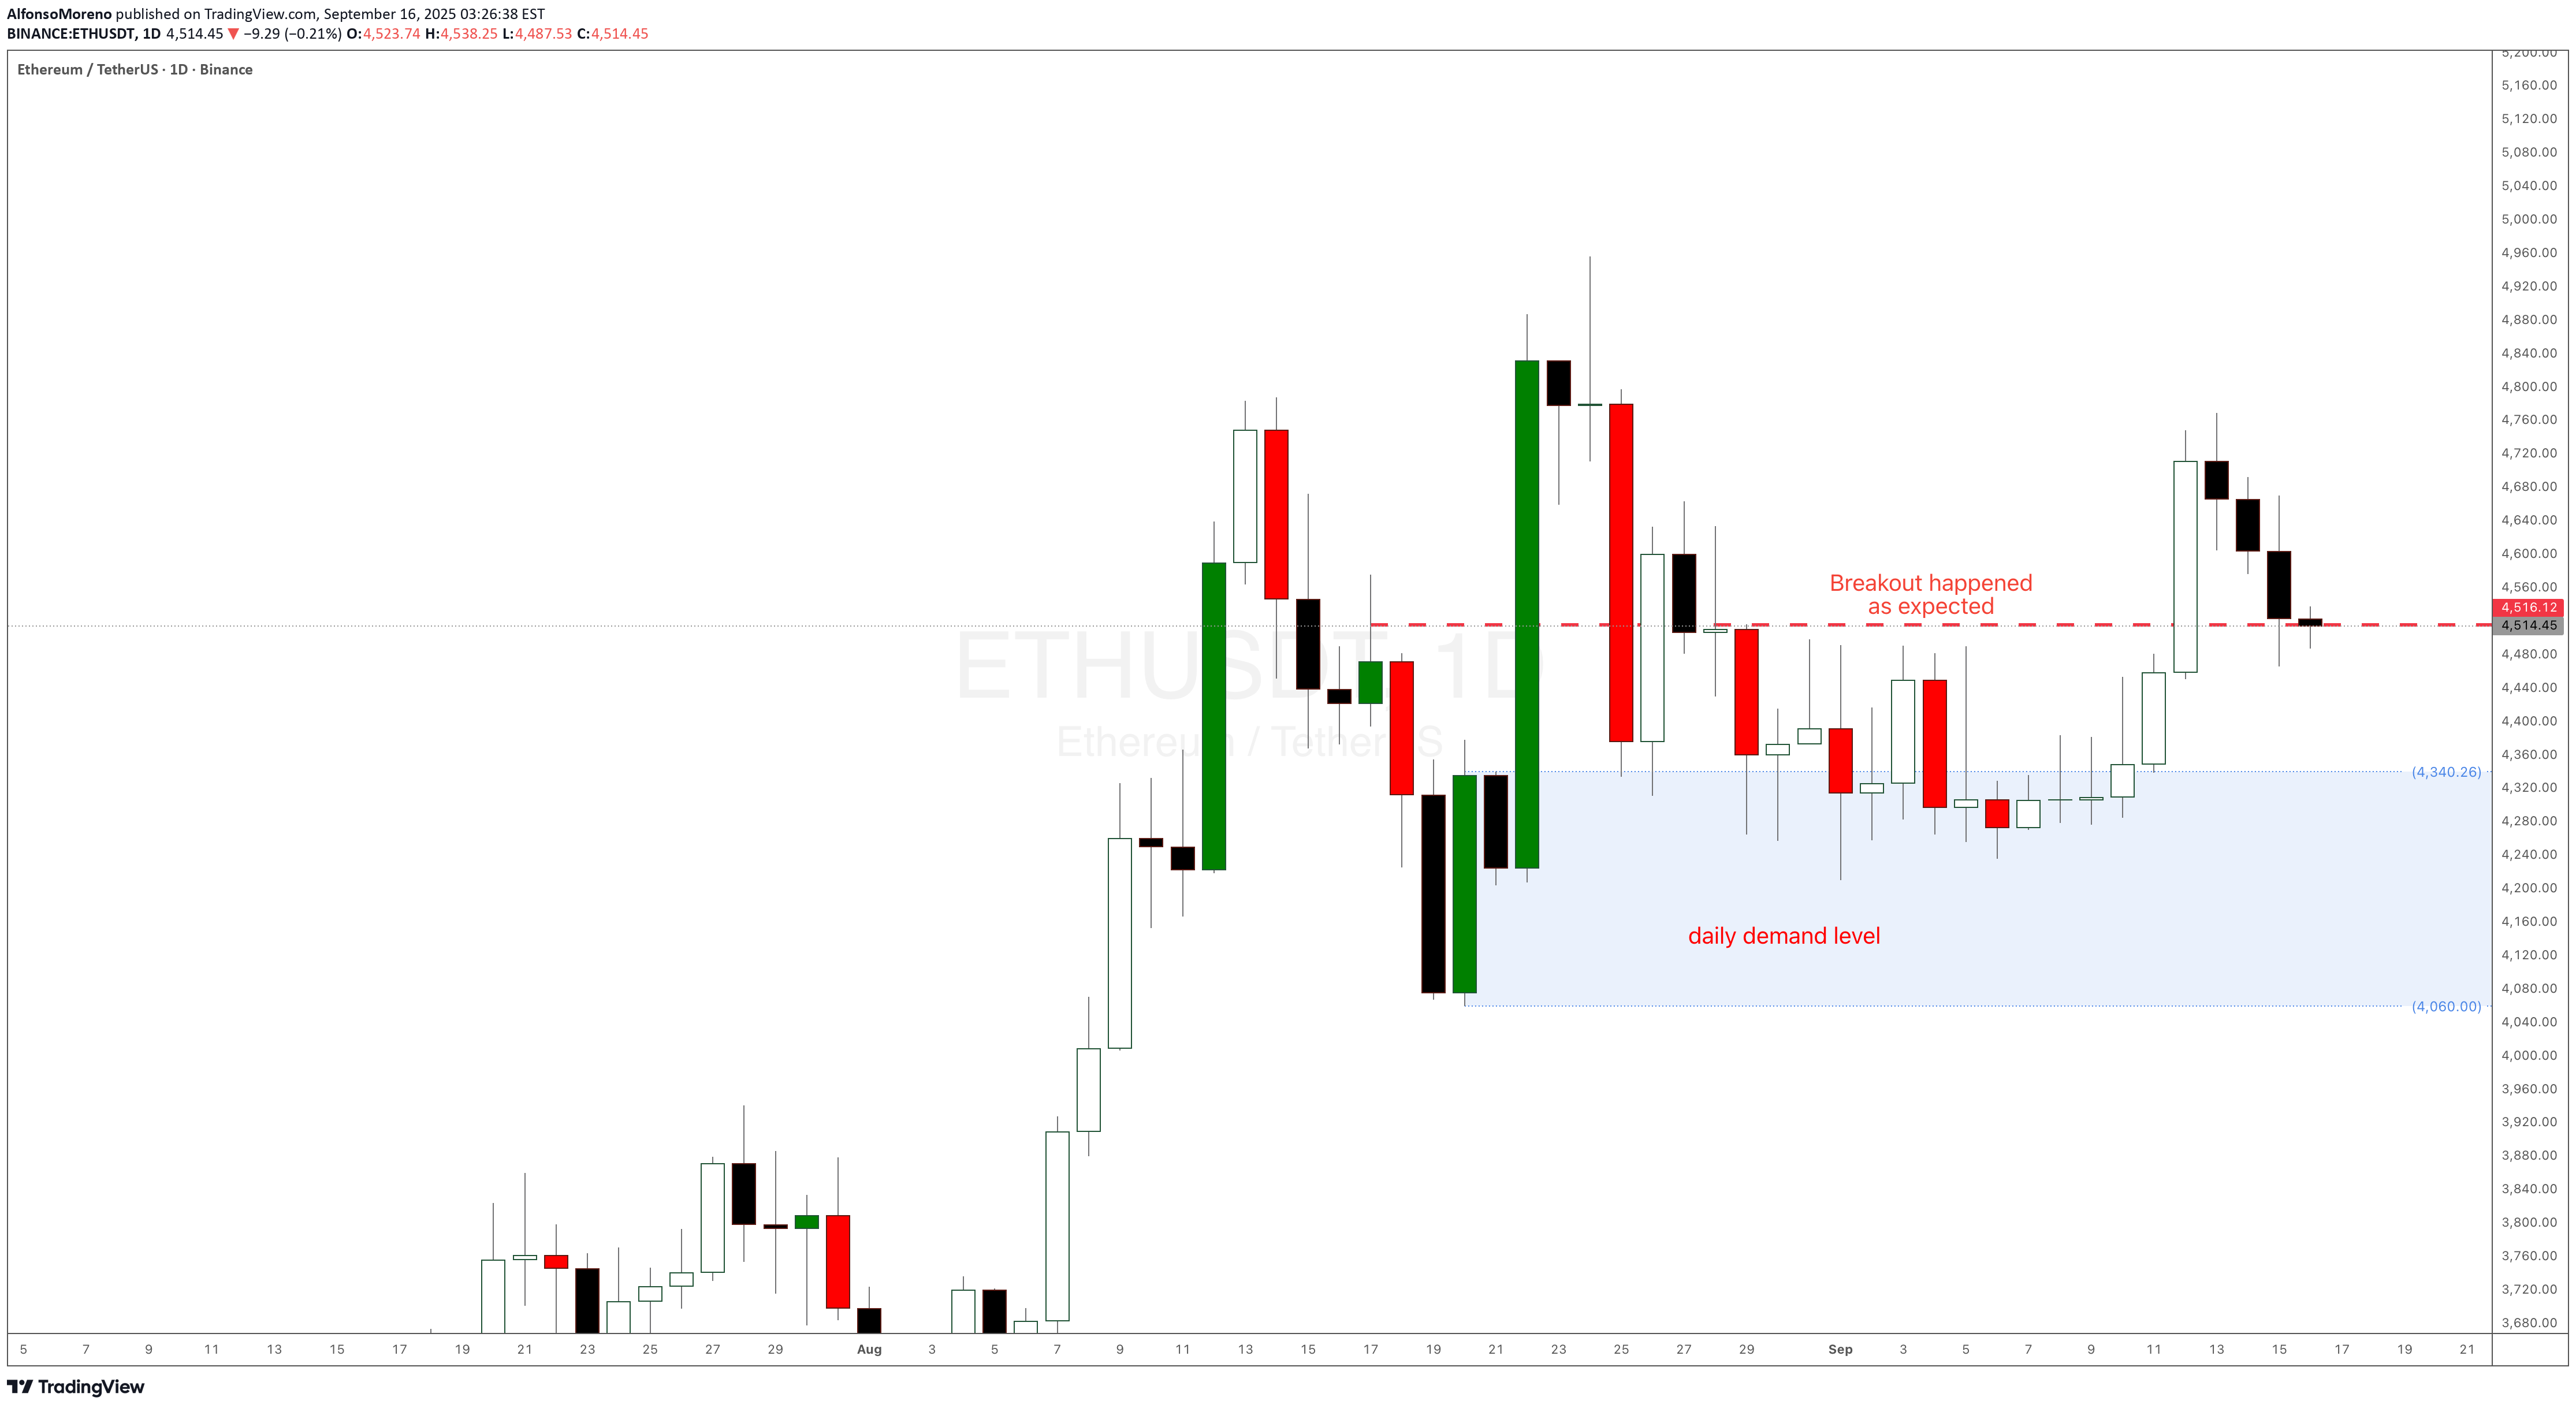
Ethereum ETH 2025 analysis and prediction daily demand level
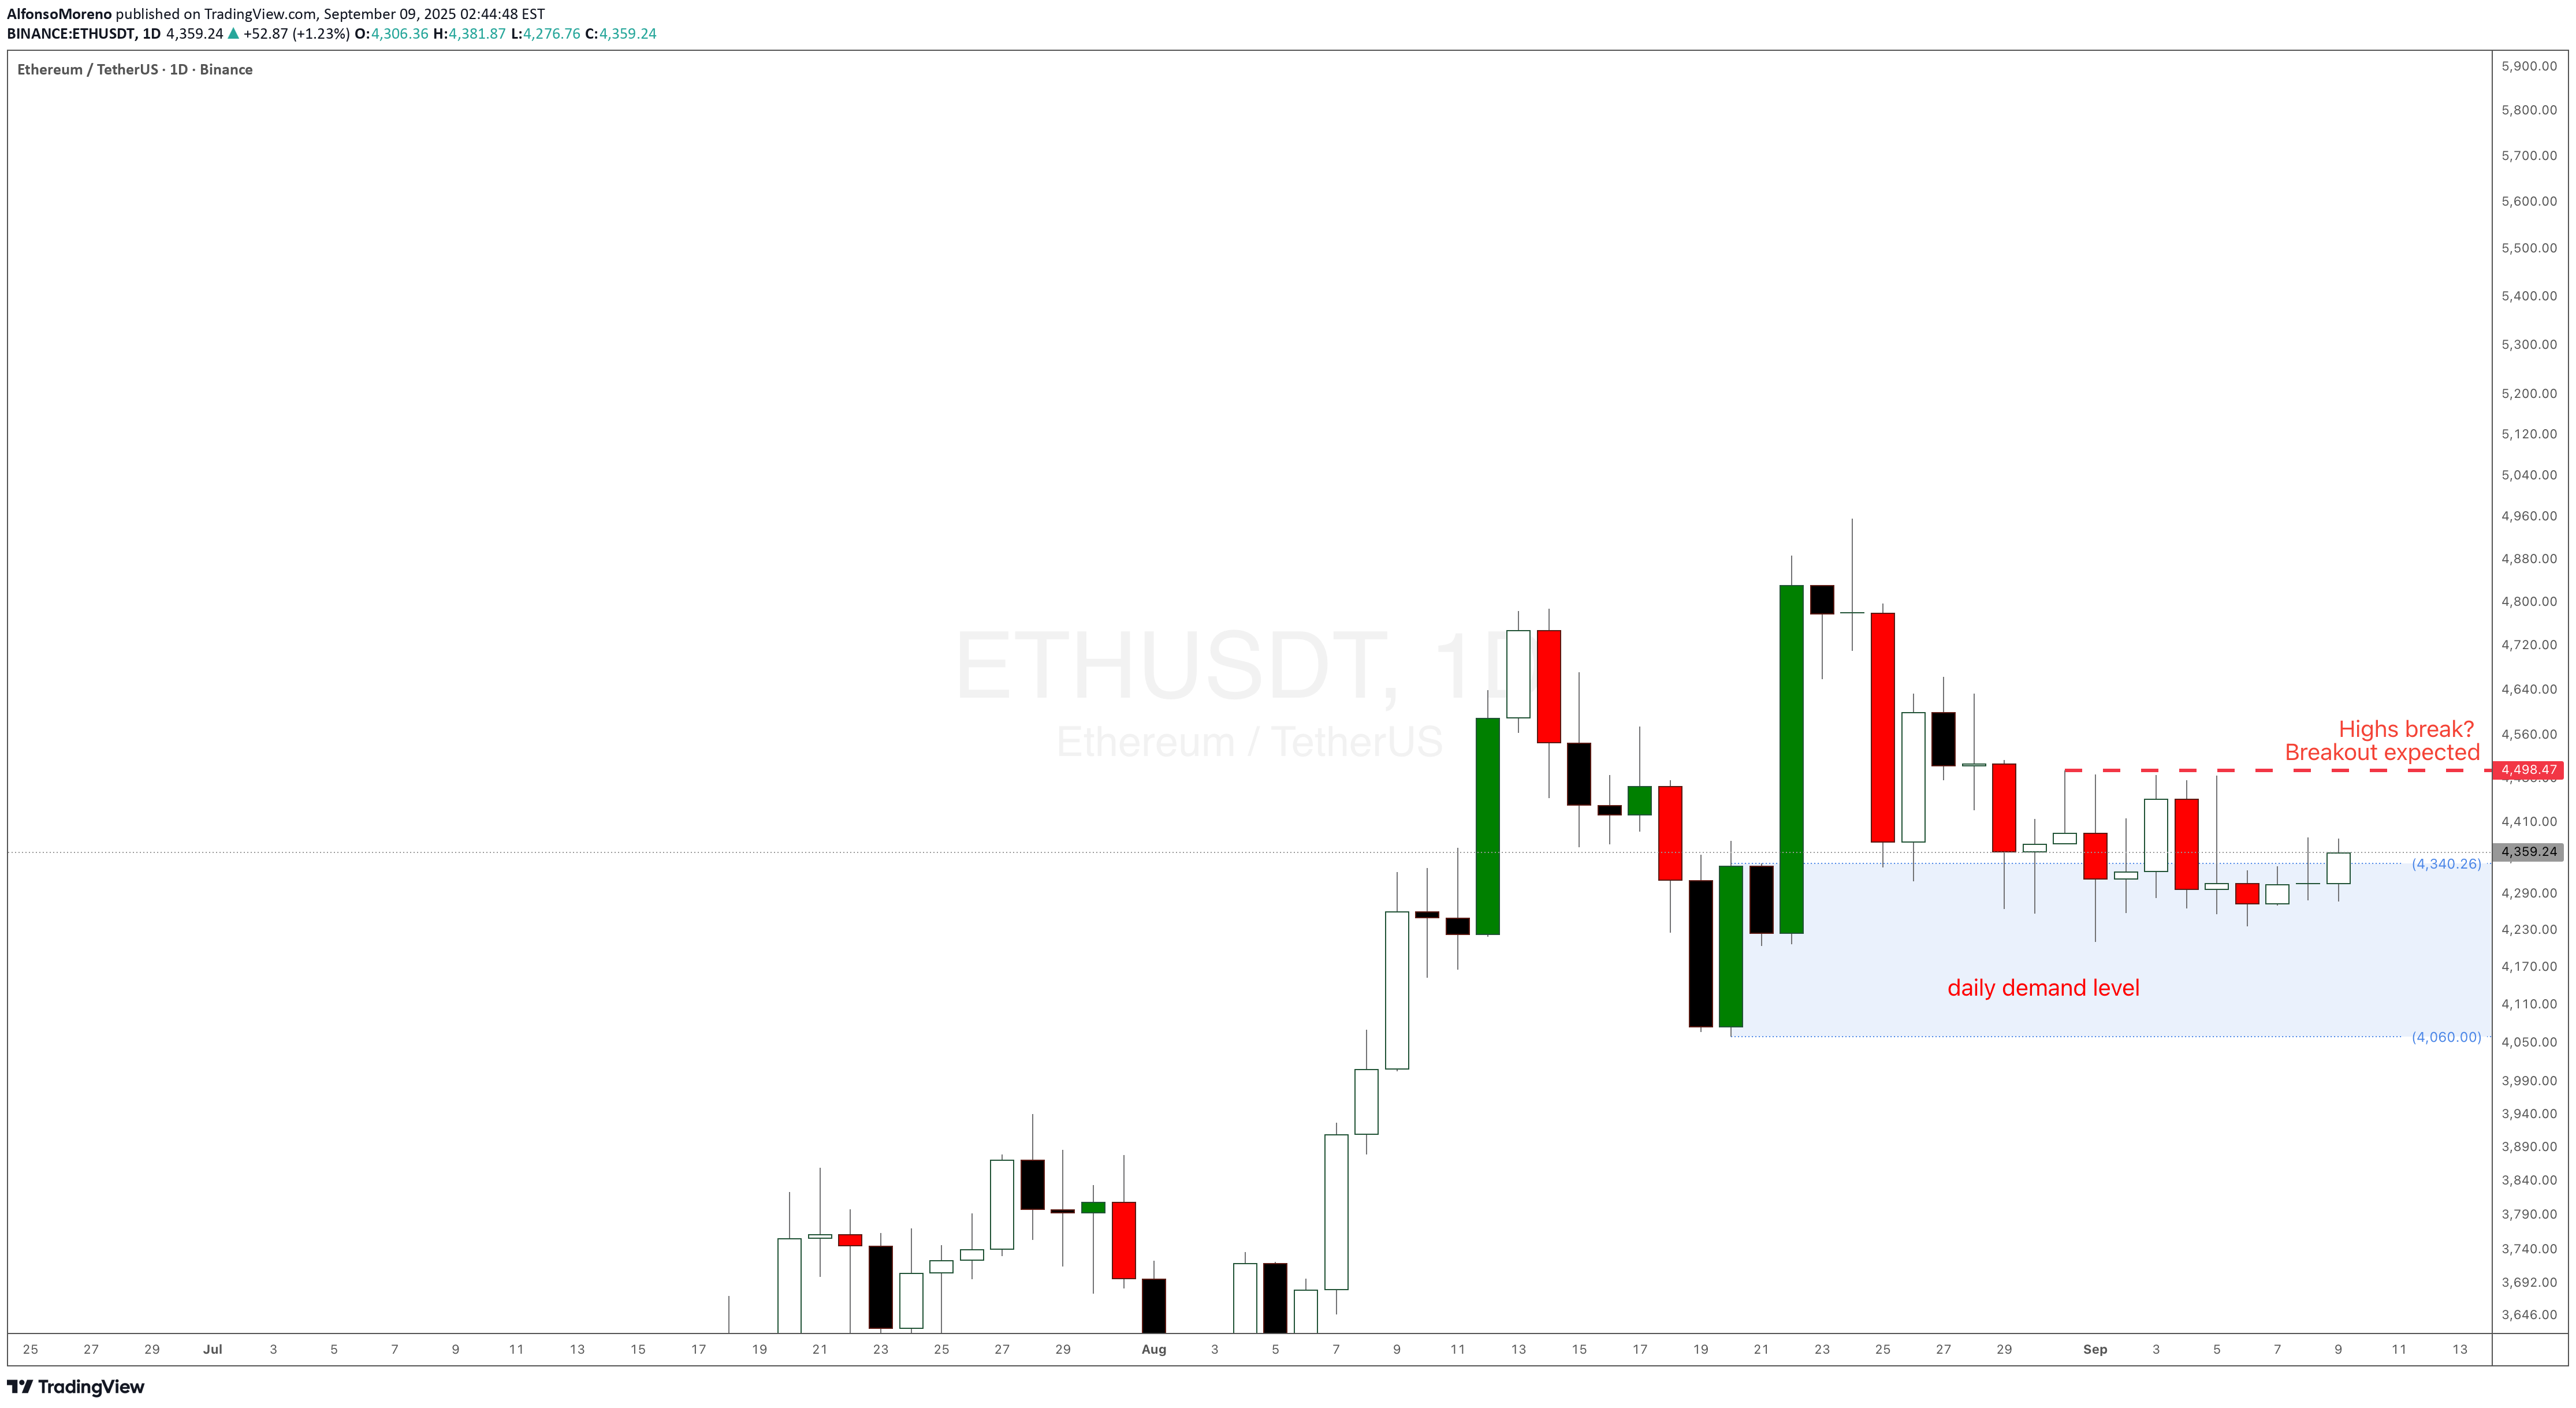
Ethereum ETH 2025 analysis and prediction as a reaction to the daily demand level at $4336. If the daily high in red is broken, a breakout is expected. ETH has been doing nothing for days, price action is not behaving as it usually does at these imbalances. This is happening with Bitcoin BTC weekly demand level in control and playing out well. Refer to my BTC analysis in another trading idea.
AlfonsoMoreno
BitCoin BTC is trying to break all-time high with weekly demand
AlfonsoMoreno
Moo Deng Crypto Meme Coin is dropping as expected
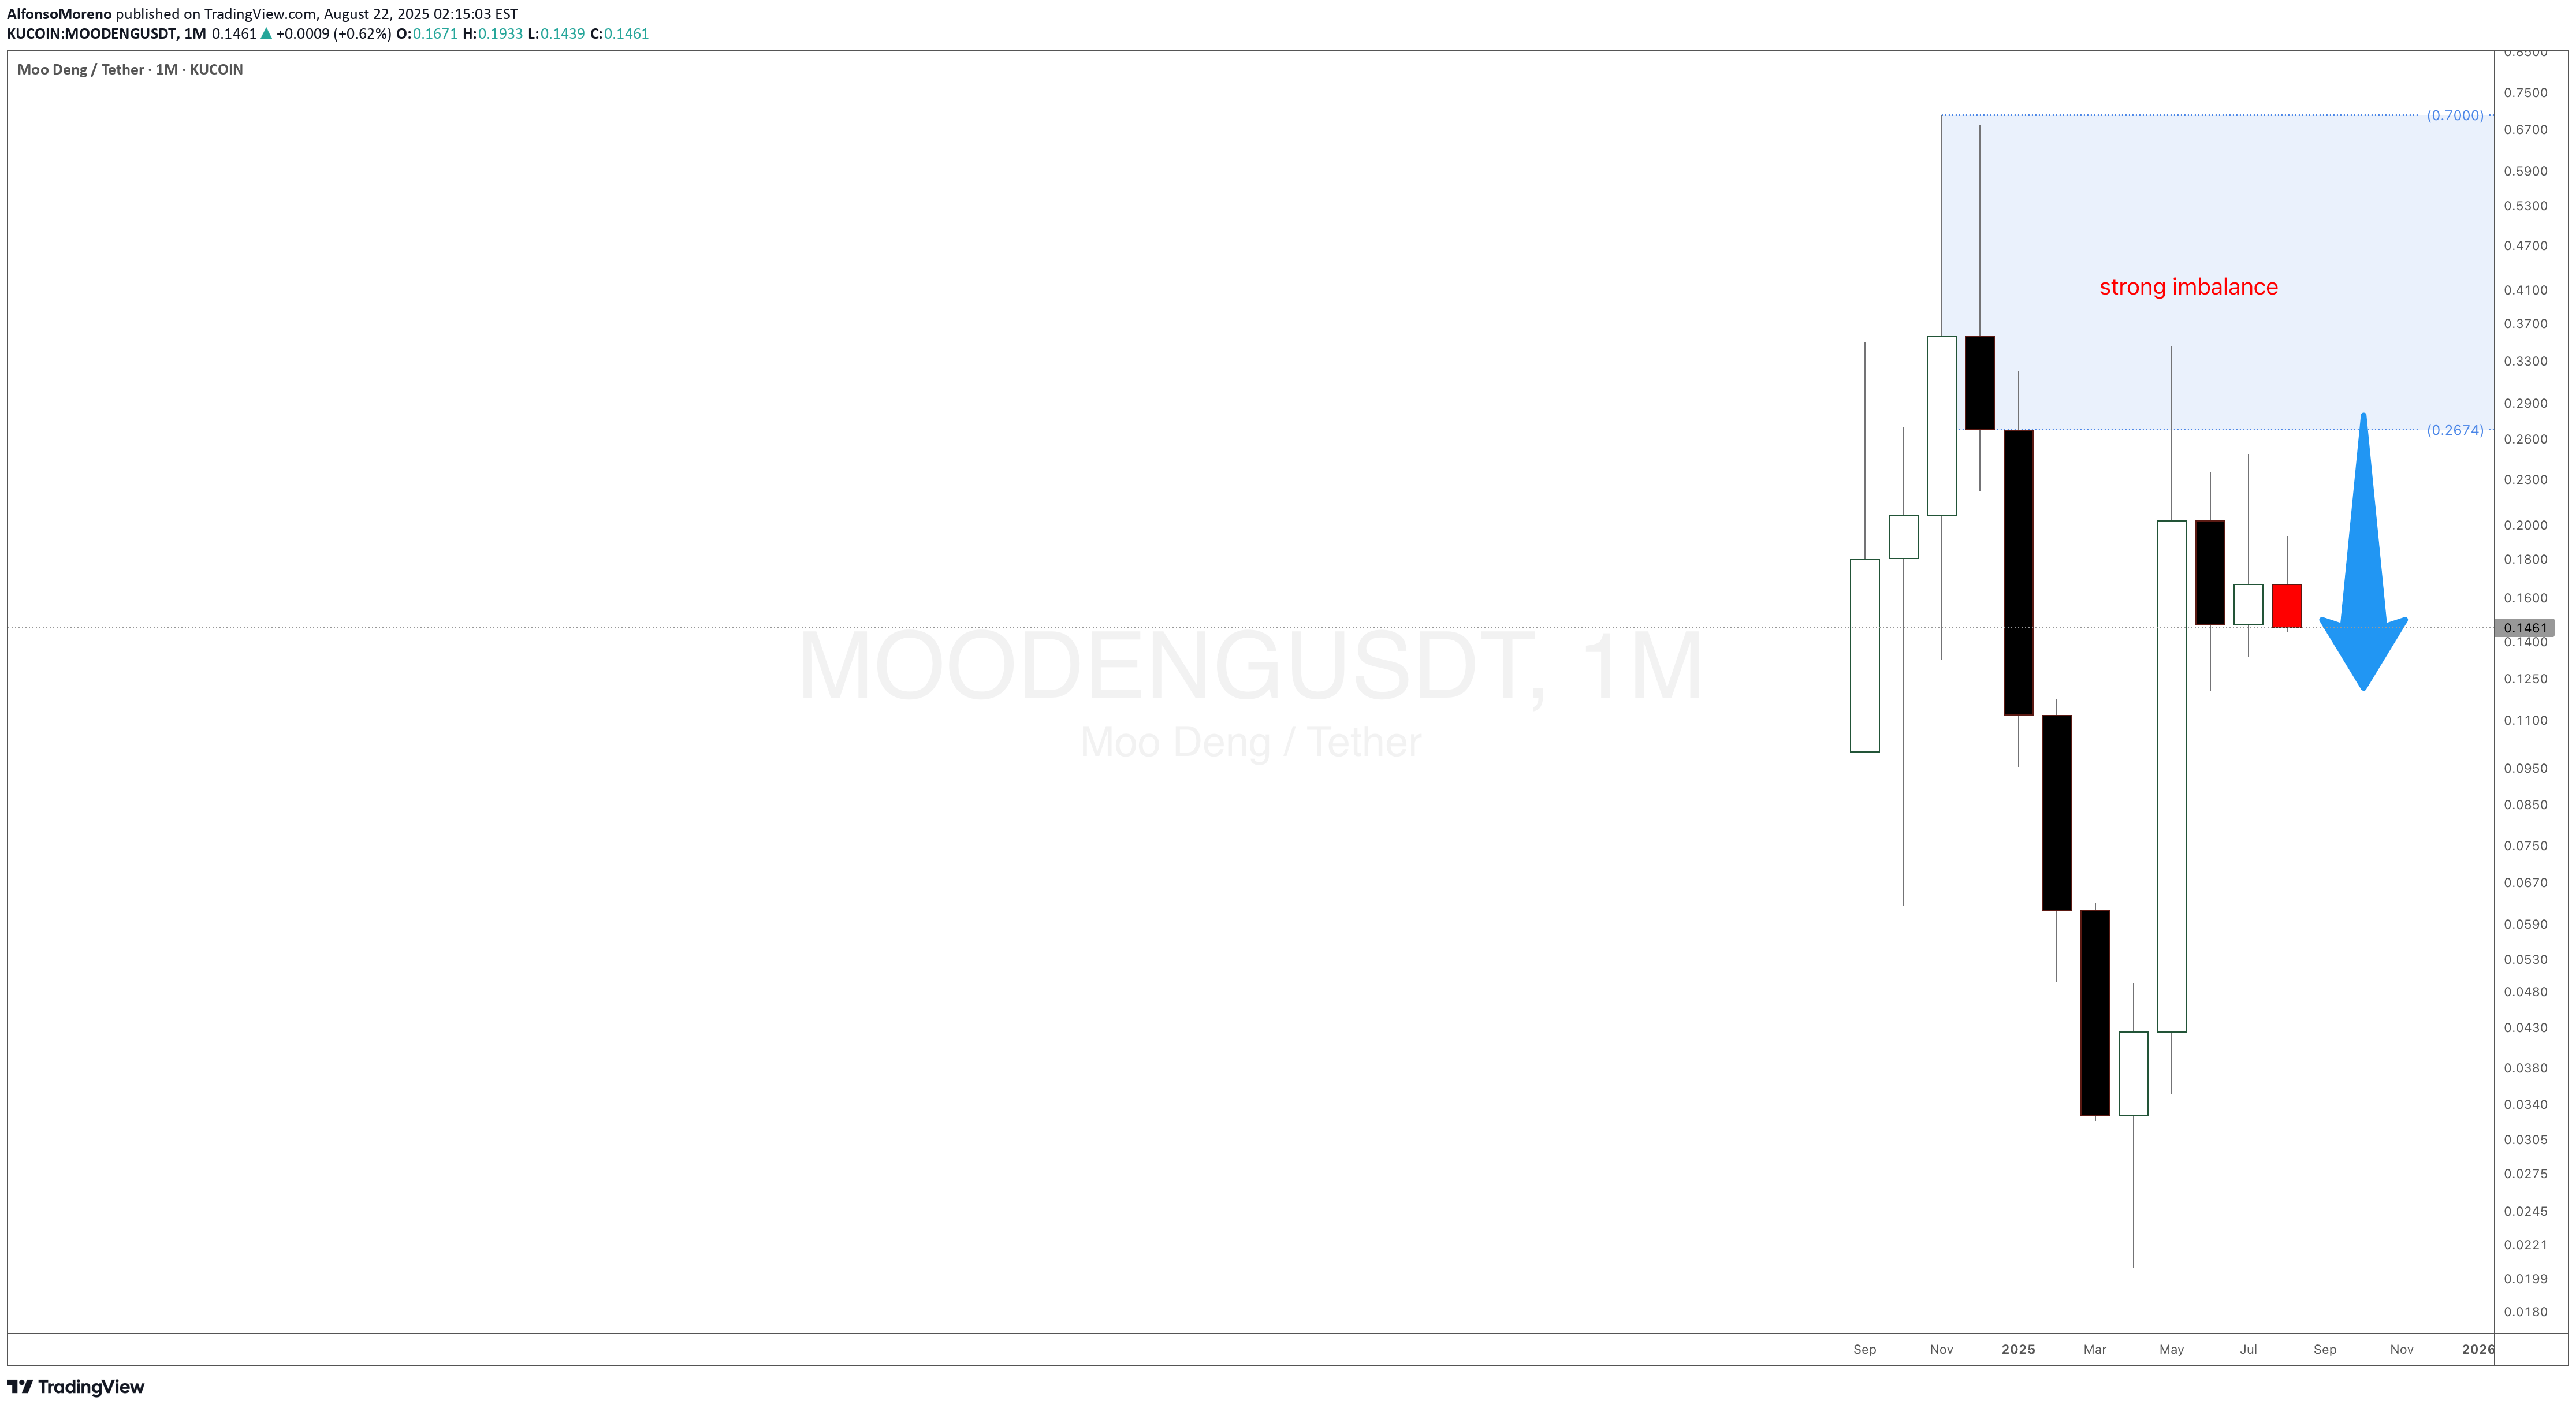
Moo Deng Crypto Meme Coin is dropping as expected. There is still a lot of room for this crypto to keep on dropping with the help of the strong monthly supply imbalance mentioned in a previous update.
AlfonsoMoreno
Don’t Listen to Elon Musk – Tesla Stock Chart Tells the REAL Sto

Tesla Stock Set to Break Records: The Power of Monthly and Weekly Demand Imbalances at $273 and $298. Welcome back, traders! In today’s supply and demand breakdown, we’re diving deep into Tesla Inc. (NASDAQ: TSLA) — not from the noisy headlines or what Elon Musk just tweeted, but strictly from raw price action, demand imbalances, and the truth on the charts. Forget the fundamentals, forget the hype, because that’s already been priced in. This is all about supply and demand, price action, and the power of patience. The $273 Monthly Demand Imbalance: The Big Fish Made Their Move A few weeks ago, Tesla stock pulled back to a significant monthly demand imbalance at $273. This level wasn’t just any zone—it was carved out by a strong impulsive move made of large-bodied bullish candlesticks, the kind that only institutions and whales create when they're loading up. What happened next? Boom. The market reacted exactly as expected, validating that monthly imbalance and setting the stage for higher prices. This is why we always trust the bigger timeframes—they hold the truth of what the smart money is doing. The $273 Monthly Demand Imbalance: The Big Fish Made Their Move A few weeks ago, Tesla stock pulled back to a significant monthly demand imbalance at $273. This level wasn’t just any zone—it was carved out by a strong impulsive move made of large-bodied bullish candlesticks, the kind that only institutions and whales create when they're loading up. What happened next? Boom. The market reacted exactly as expected, validating that monthly imbalance and setting the stage for higher prices. This is why we always trust the bigger timeframes—they hold the truth of what the smart money is doing.
AlfonsoMoreno
Apple Stock Is Surging! Here’s What Most People Miss

When it comes to trading, we don’t care about the latest news headlines or whether some analyst has upgraded or downgraded Apple stock. We focus on one thing and one thing only: the undeniable forces of supply and demand imbalances on higher timeframes. Right now, Apple’s monthly chart is a textbook example of how waiting for a strong demand imbalance pays off. That $178 monthly level is no random number. It’s the exact origin of a massive bullish impulse that happened in June 2024 — the kind of move that only happens when smart money and big institutions step in, creating an imbalance that pushes the price away rapidly. 📈 It’s Not About Fundamentals. It’s About Imbalances. Most retail traders waste time chasing news, earnings, or rumours about iPhone sales. But if you think about it, all those factors are already priced in once a strong imbalance is formed. Institutions don’t wait for tomorrow’s news — they plan their positions weeks or months ahead, and those footprints are visible right on your chart. The $178 level indicates a significant drop in supply and a surge in demand large enough to propel Apple higher, marked by consecutive large bullish candlesticks. That’s our signal — nothing more, nothing less.
Disclaimer
Any content and materials included in Sahmeto's website and official communication channels are a compilation of personal opinions and analyses and are not binding. They do not constitute any recommendation for buying, selling, entering or exiting the stock market and cryptocurrency market. Also, all news and analyses included in the website and channels are merely republished information from official and unofficial domestic and foreign sources, and it is obvious that users of the said content are responsible for following up and ensuring the authenticity and accuracy of the materials. Therefore, while disclaiming responsibility, it is declared that the responsibility for any decision-making, action, and potential profit and loss in the capital market and cryptocurrency market lies with the trader.