
bbqgio
@t_bbqgio

What symbols does the trader recommend buying?
Purchase History
پیام های تریدر
Filter
bbqgio
NVDA Neutral-Bullish

NVDA is stuck in a clean daily rectangle after a strong run into early November, with price repeatedly rotating between $178 support and $198 resistance. With EMA 20/60/120 now tightly clustered and volatility compressing, the market is effectively coiling—waiting for a decisive catalyst rather than offering easy trend follow-through inside the range. The most actionable plan is still the upside resolution: a decisive daily close above $198 (ideally supported by a clear volume expansion) would signal the range has broken and the prior trend is attempting to resume. If that breakout holds, the next magnet is the prior high area near $210, with the first risk-managed “line in the sand” being a loss back below the breakout zone. If price fails to reclaim the top of the box and instead breaks down, the structure flips. A daily close below $178 would invalidate the rectangle and shift focus to a deeper correction, with $160 as the next meaningful downside objective. This is a study, not financial advice. Manage risk and invalidations. Thought of the Day 💡 Compressing volatility doesn’t predict direction—but it often predicts a larger move once the market chooses. ------------------------- Thanks for your support! If you found this idea helpful or learned something new, drop a like 👍 and leave a comment, I’d love to hear your thoughts!
bbqgio
تحلیل تکنیکال اپل (AAPL): آیا خیز بزرگ به سمت ۳۰۰ دلار در راه است؟

AAPL is still in a long-term uptrend on the 1D chart (holding above the EMA(120) at $254.95), but price action has cooled into a rectangle after the early December 2025 peak. The tape is currently “stuck” between short-term pressure (SuperTrend bearish at $277.27 and MACD below zero) and underlying demand near the EMA(60) at $267.39, with ATR around 4.39 suggesting a decisive move could expand quickly once the range resolves. Fundamentally, the backdrop is mixed: Vision Pro demand/production concerns and valuation sensitivity (P/E 35.68 vs its 10-year average) are headwinds, while iPhone strength, Services growth, and AI/robotics narrative keep the longer-term bid intact. Analyst tone remains constructive with a ‘Moderate Buy’ consensus and an average target near $299.10, alongside a $300 bullish target call. For the bullish path, I want to see a daily close > $278.00 (reclaiming $277.27) and then a breakout/close above the range cap near $288 to open $295 and the $300 area. If bears force a daily close < $266.00, the rectangle fails and $254.95 becomes the next magnet, with $250 as the deeper downside objective; that breakdown is invalidated back above $273. This is a study, not financial advice. Manage risk and invalidations. Thought of the Day 💡 Discipline is simply executing your plan when the market is noisy. ------------------------- Thanks for your support! If you found this idea helpful or learned something new, drop a like 👍 and leave a comment, I’d love to hear your thoughts!
bbqgio
XAUUSD Bearish Continuation?

XAU/USD on the 4H chart is flashing a clear momentum shift: the prior uptrend peaked near 4,540, then rolled over hard and sliced beneath the key EMAs. Price is now consolidating below EMA(20) and EMA(60), which have flipped into dynamic resistance, keeping rallies heavy. MACD remains below both the signal line and zero, while ATR has cooled from the sell-off spike—classic “pause after impact” behavior. Structurally, this reads like a bearish flag: a sharp flagpole down, followed by a drifting consolidation capped near 4,440. As long as 4,440 holds, the path of least resistance favors another leg lower. The key trigger is a decisive 4H close below 4,340 to confirm the breakdown, opening room toward 4,350 first and potentially the major support near 4,260 if selling expands. If bulls flip the script with a clean 4H close above 4,440, that would invalidate the flag and shift focus toward 4,500, with upside extension possible toward 4,580. Until then, treat the EMAs overhead as the defining “ceiling,” and keep invalidations tight and respected. This is a study, not financial advice. Manage risk and invalidations. Thought of the Day 💡 A strong trend doesn’t need to move fast—most continuation legs begin with quiet compression and a clean trigger. -------------------------- Thanks for your support! If you found this idea helpful or learned something new, drop a like 👍 and leave a comment, I’d love to hear your thoughts!
bbqgio
BTCUSD Bearish
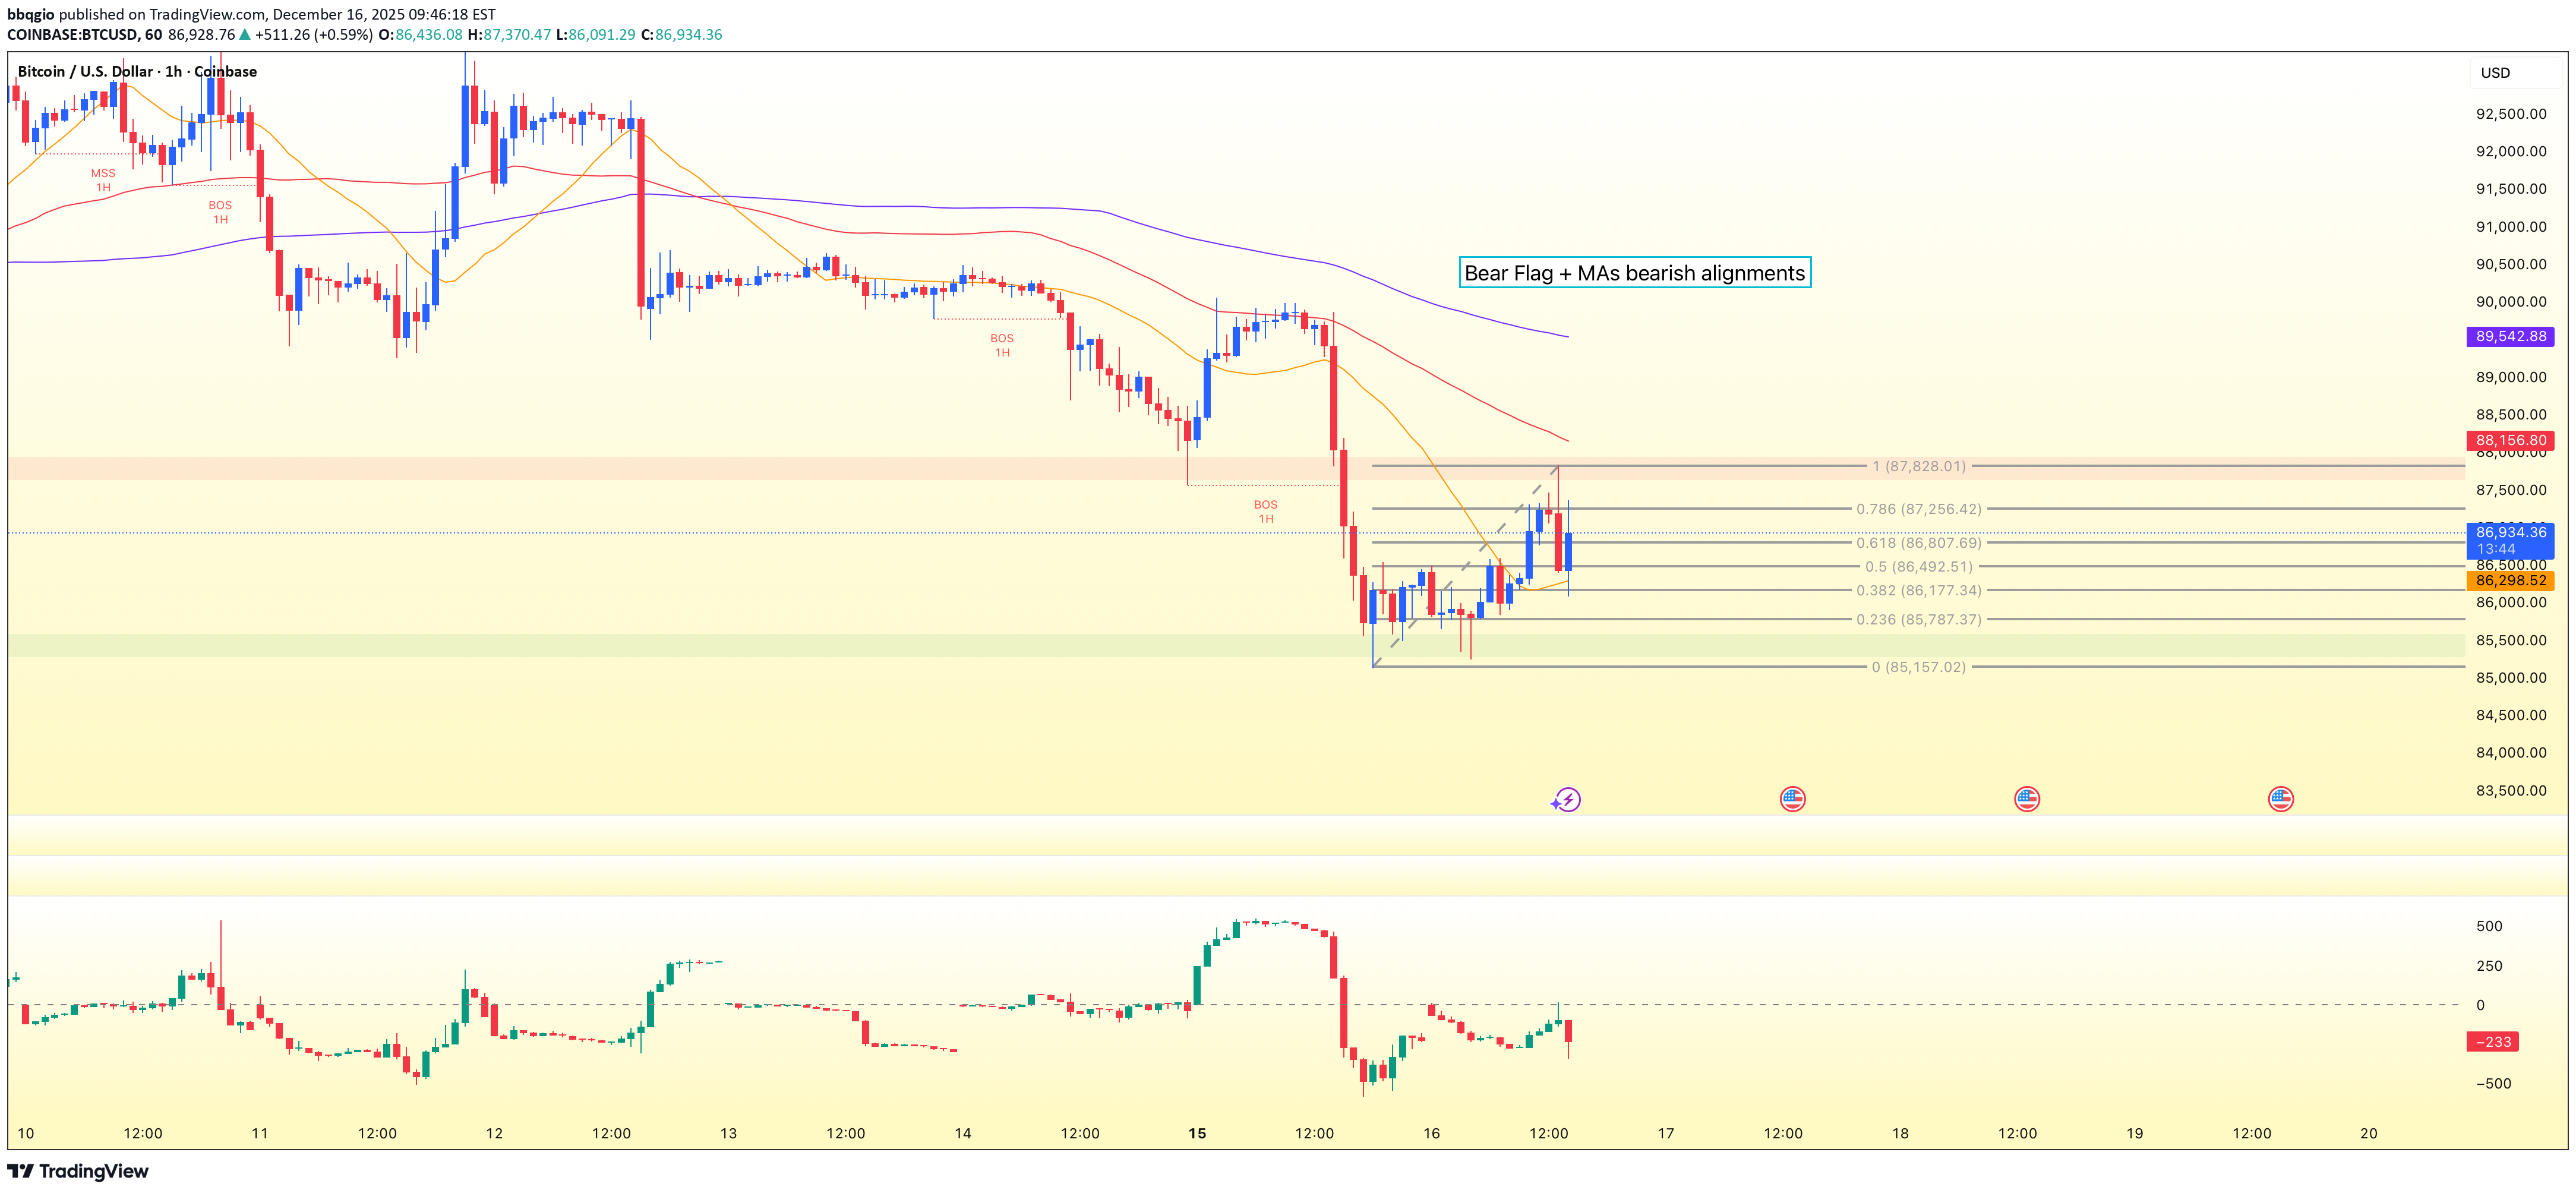
BTCUSD on the 1H is still wearing a bearish suit after a clean downside BOS and a sharp sell-off. Price is consolidating in a tight band, carving a classic bear flag while staying well below the 20/60/120 MAs (bearishly stacked). Momentum has cooled, but structure remains heavy, with the range effectively boxed between support near $85,500 and flipped resistance at $87,733.18 (also near the 0.786 retrace and the upper edge of the flag). The primary path is continuation: I’m watching for a decisive 1H close < $85,400 to confirm the breakdown. If that triggers, the first pressure point is $84,500, with continuation potential toward $82,600. Any sustained reclaim back above $87,733.18—and especially a 1H close > $87,800—would weaken the bear-flag thesis and force caution. If bulls do flip it with a confirmed close above $87,800, the squeeze risk is toward the higher inefficiencies: $88,260–$89,281, then $90,699–$91,908 (with $91,000 as a practical objective). With ATR near 767, expect whips and size accordingly. This is a study, not financial advice. Manage risk and invalidations. Thought of the Day 💡: The best trades are the ones that become obvious only after confirmation—let price do the talking. --------------------- Thanks for your support! If you found this idea helpful or learned something new, drop a like 👍 and leave a comment, I’d love to hear your thoughts!
bbqgio
XAUUSD Bullish
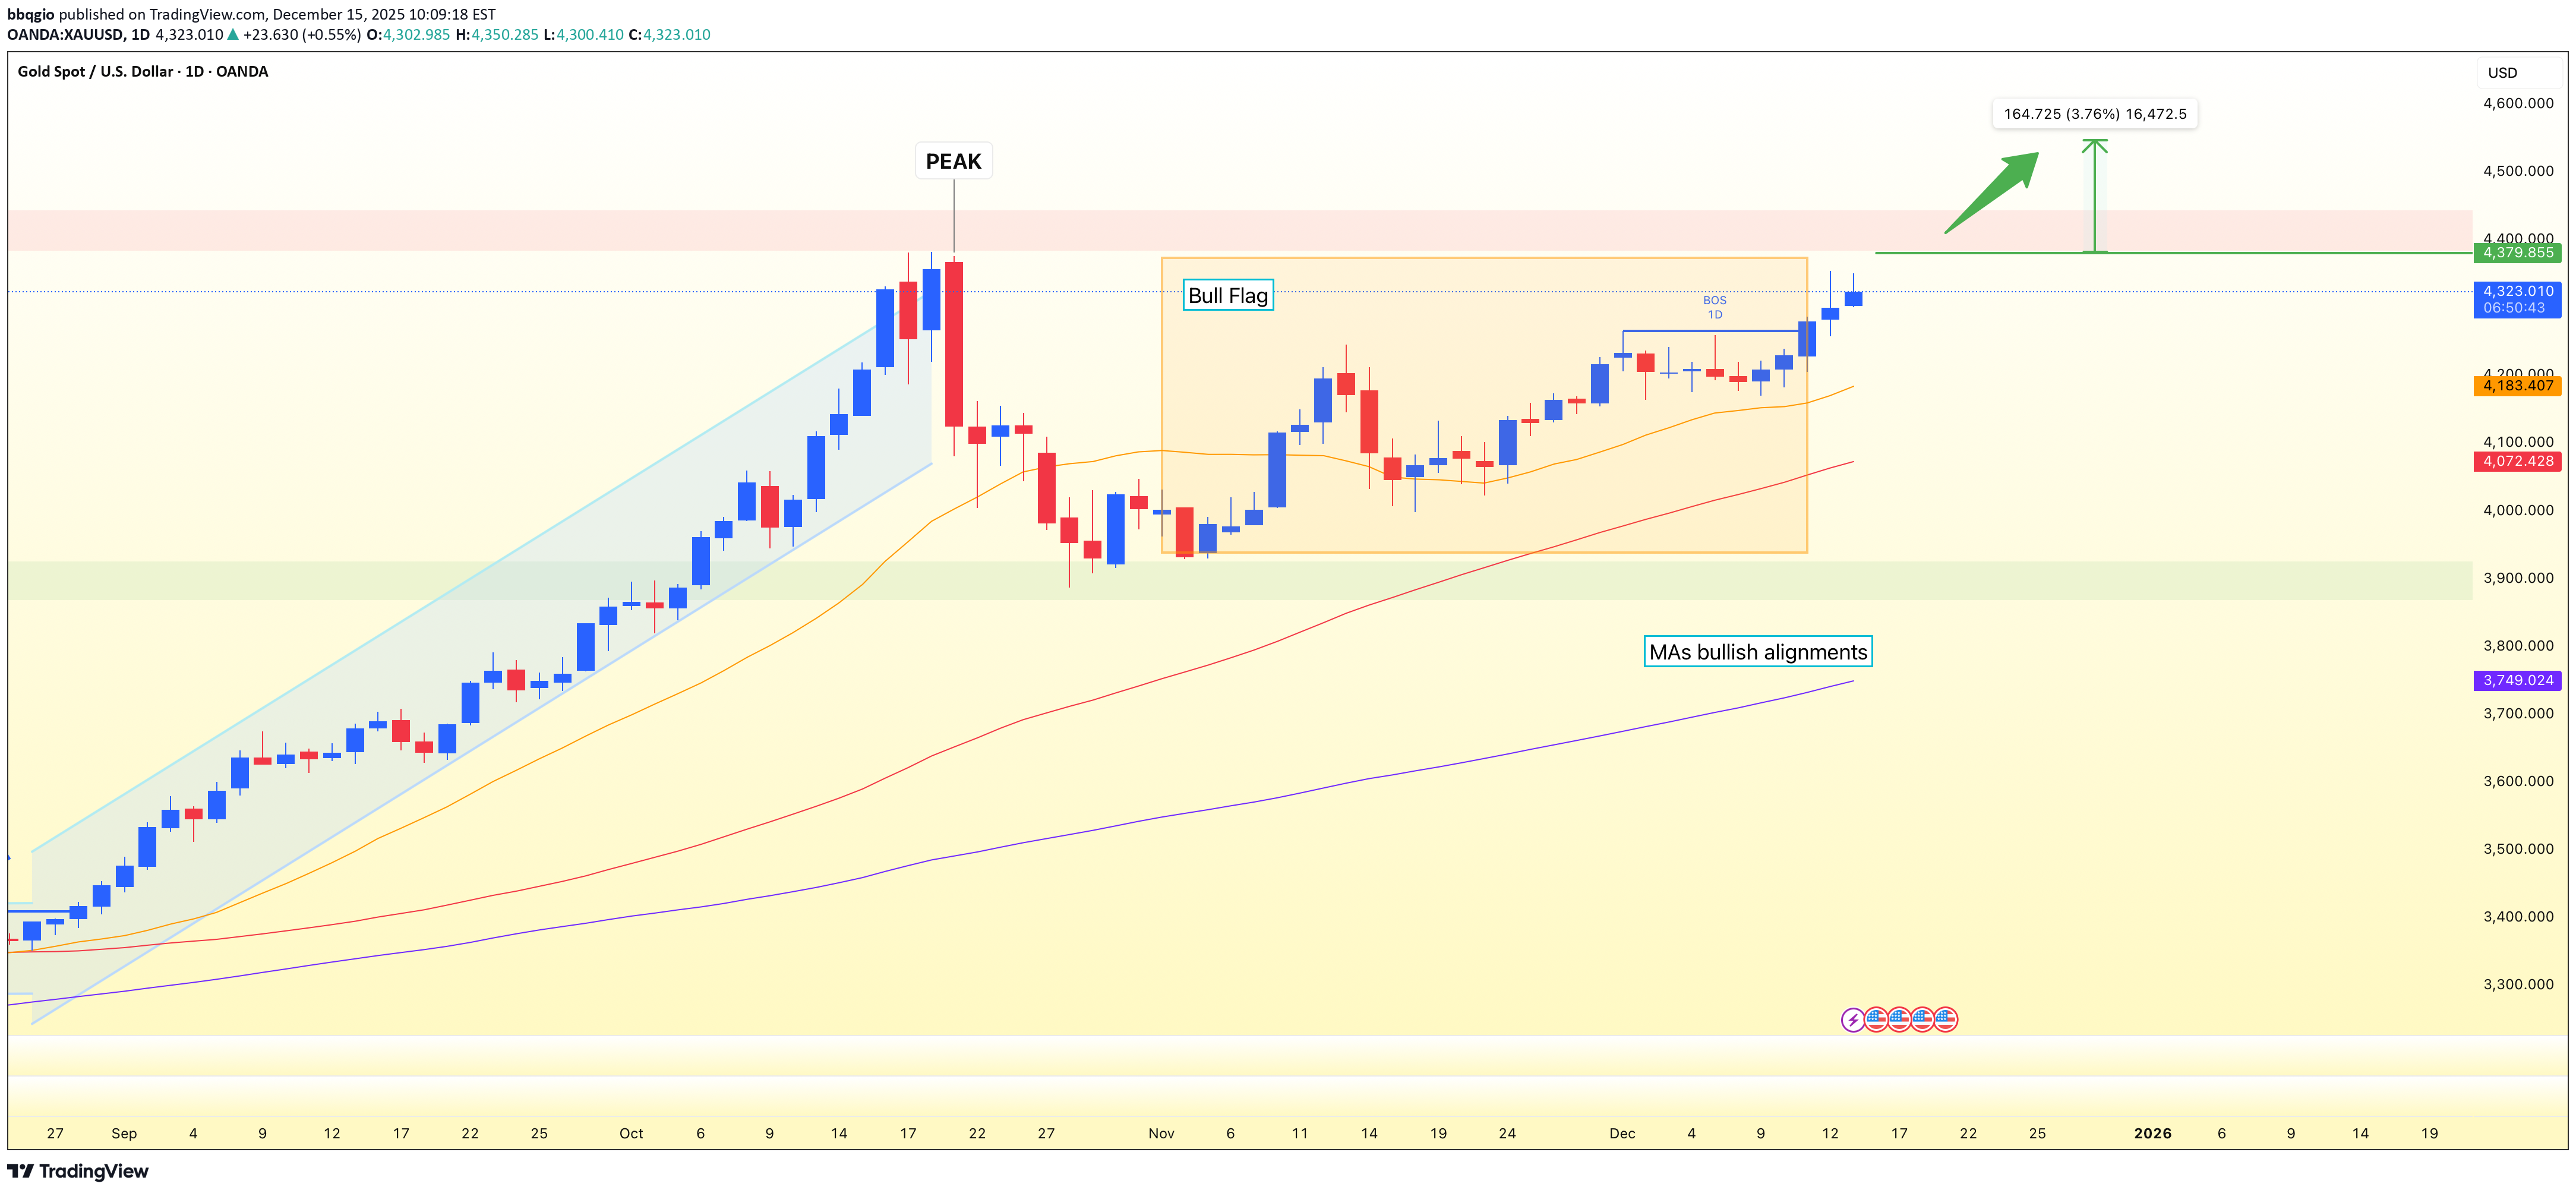
XAUUSD (1D) remains in a clean, sustained uptrend, holding above the 20/60/120 moving averages with bullish stacking (20 > 60 > 120). After the mid-October peak and a controlled consolidation, price has already broken out of a bullish flag with a clear BOS, keeping the higher-high/higher-low structure intact. The immediate focus is the 4400 resistance (mid-October peak). A daily close > 4350 keeps the breakout path active, with 4445 as the first push zone and 4575 as the higher extension if momentum accelerates. If price hesitates, a grind and brief consolidation around 4360–4400 would still fit the bullish continuation script. On the downside, the first dynamic support is MA(20) at 4185.92, with the structure line to watch at 4250. A deeper pullback can still be constructive if buyers reclaim strength with a daily close > 4100, while 3950 remains the key “line in the sand” for trend validity. A daily close < 4250 increases odds of a corrective slide toward 4145, and potentially 3950. This is a study, not financial advice. Manage risk and invalidations. Thought of the Day 💡 Trend continuation is often quiet—until the key level breaks. ------------------------- Thanks for your support! If you found this idea helpful or learned something new, drop a like 👍 and leave a comment, I’d love to hear your thoughts!
bbqgio
BTCUSD Bearish
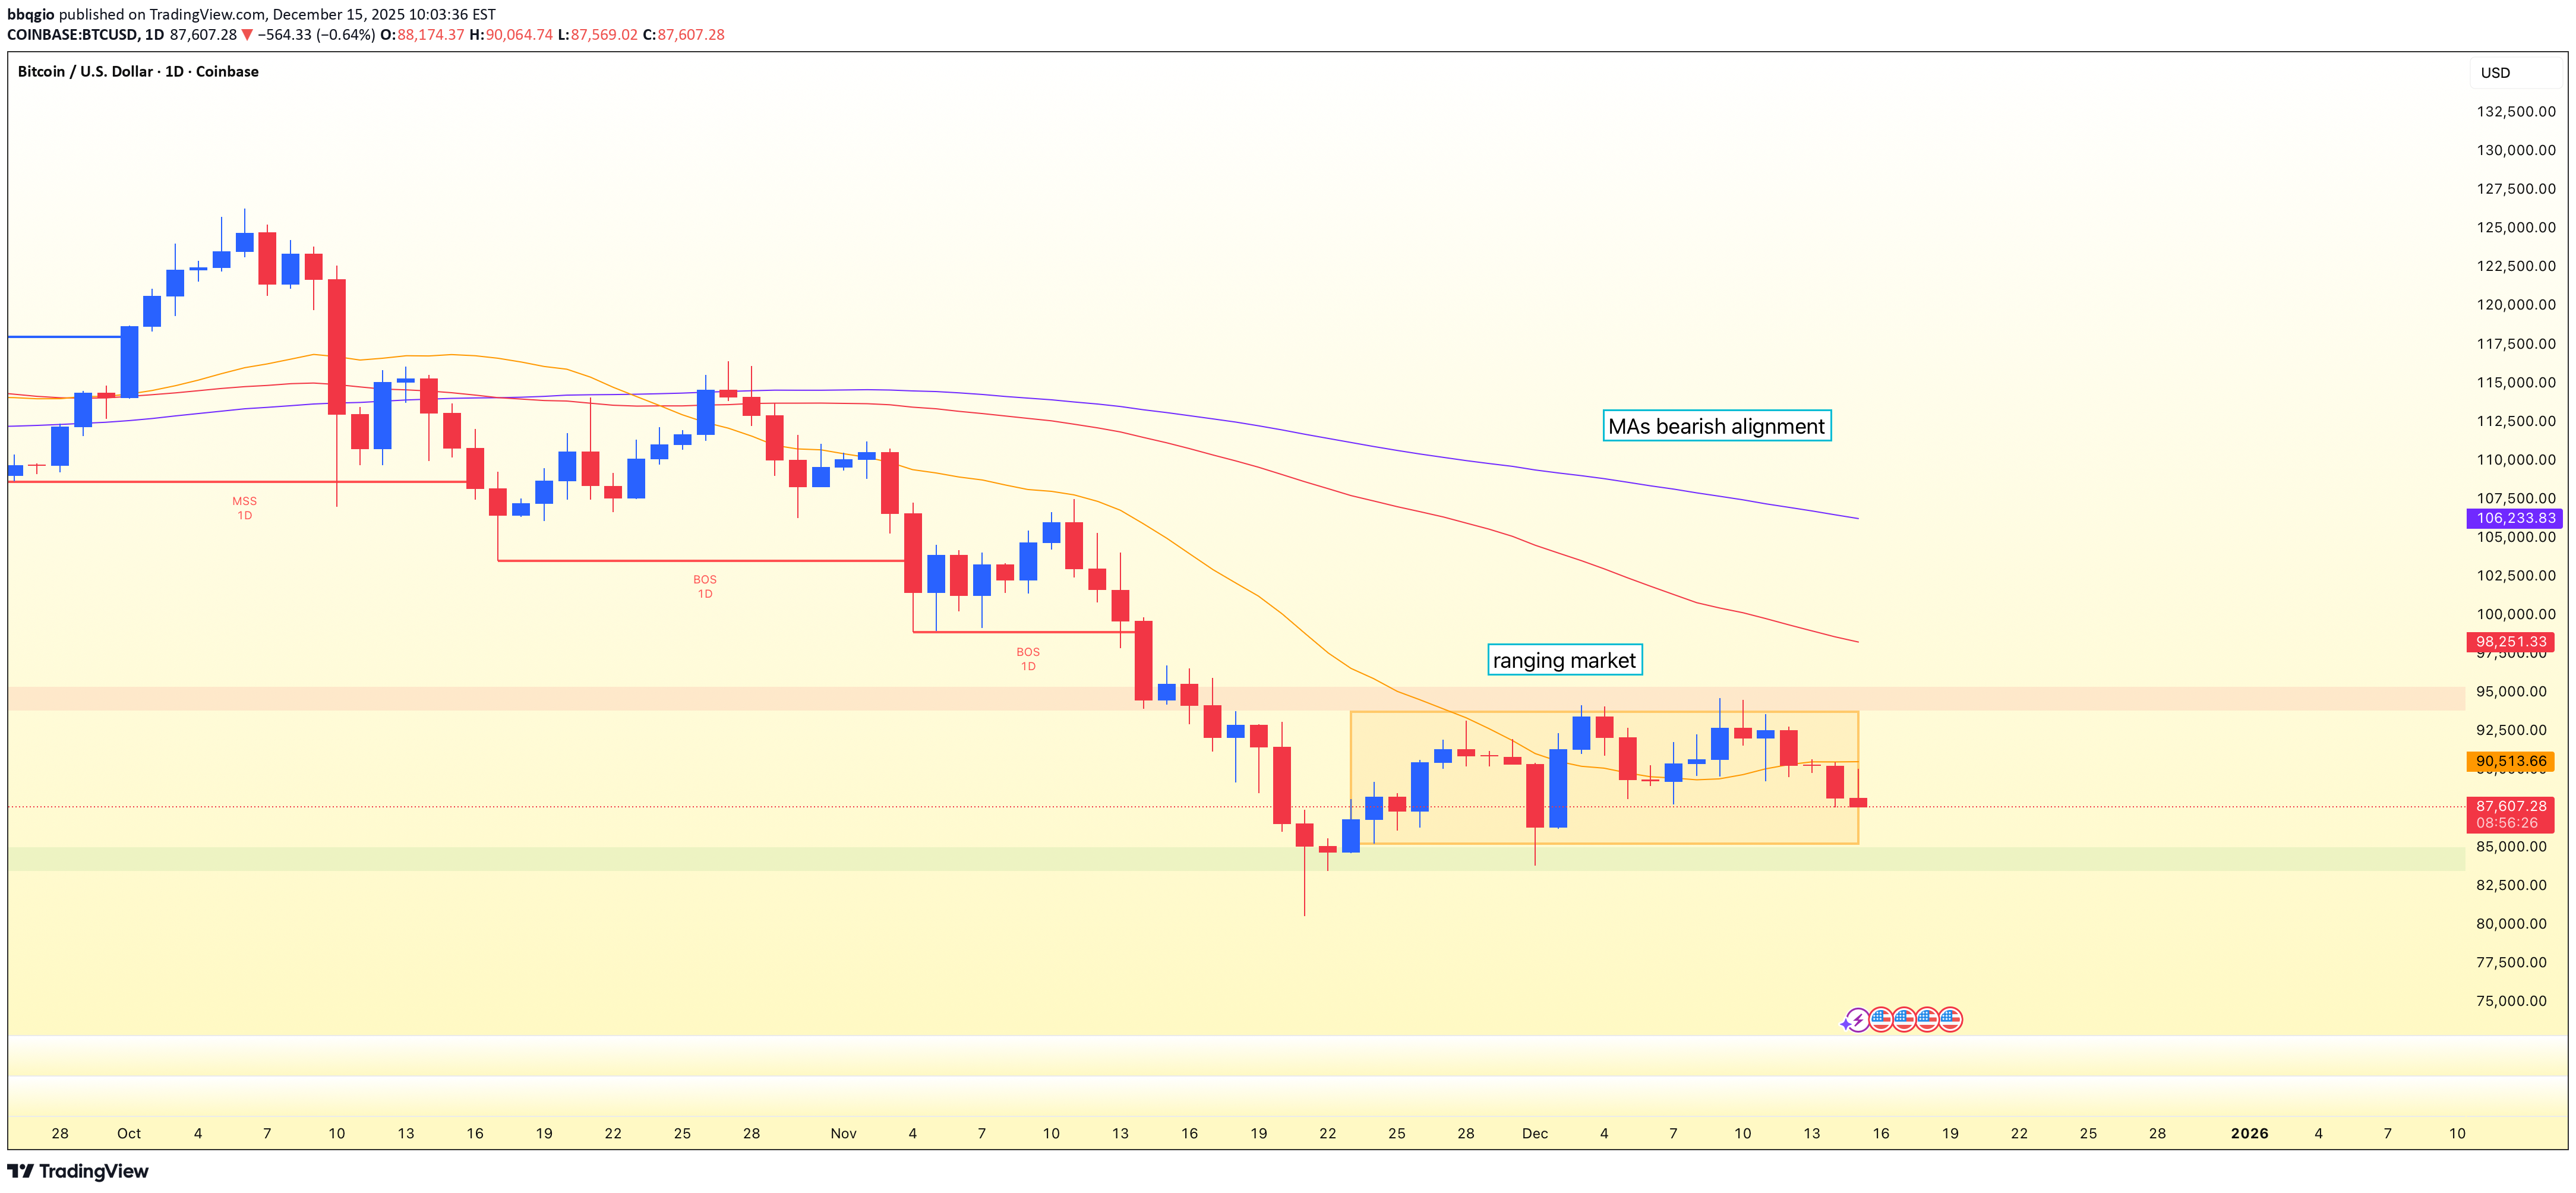
BTCUSD remains in a confirmed daily downtrend after the $127,500 peak, with a clear MSS followed by multiple bearish BOS and a firmly bearish MA stack (MA20 < MA60 < MA120). That said, late November brought a volatility contraction, and price has been digesting inside a clean range between $85,000 support and $95,000 resistance—a classic pause that often resolves in the direction of the larger trend. The primary path stays bearish while price is capped below $95,000–$95,500 and the MA20 (~$90,558) acts as dynamic resistance. A decisive daily close below $85,000 is the trigger that ends the range and favors continuation, with downside focus toward $77,000 as the next logical objective. If that breakdown fails and BTC reclaims higher ground, the bearish continuation idea is weakened. The alternative scenario is a counter-trend squeeze: a daily close above $95,500 would shift short-term momentum and open a run toward $98,292 (MA60) and potentially $105,500. Until then, treat the current structure as a bearish range with defined edges and clear invalidations. This is a study, not financial advice. Manage risk and invalidations. Thought of the Day 💡: The best trades often come from waiting for a range to pick a side—let the close confirm the story. ------------------------- Thanks for your support! If you found this idea helpful or learned something new, drop a like 👍 and leave a comment, I’d love to hear your thoughts!
bbqgio
AMZN Bullish Flag & Breakout Setup?
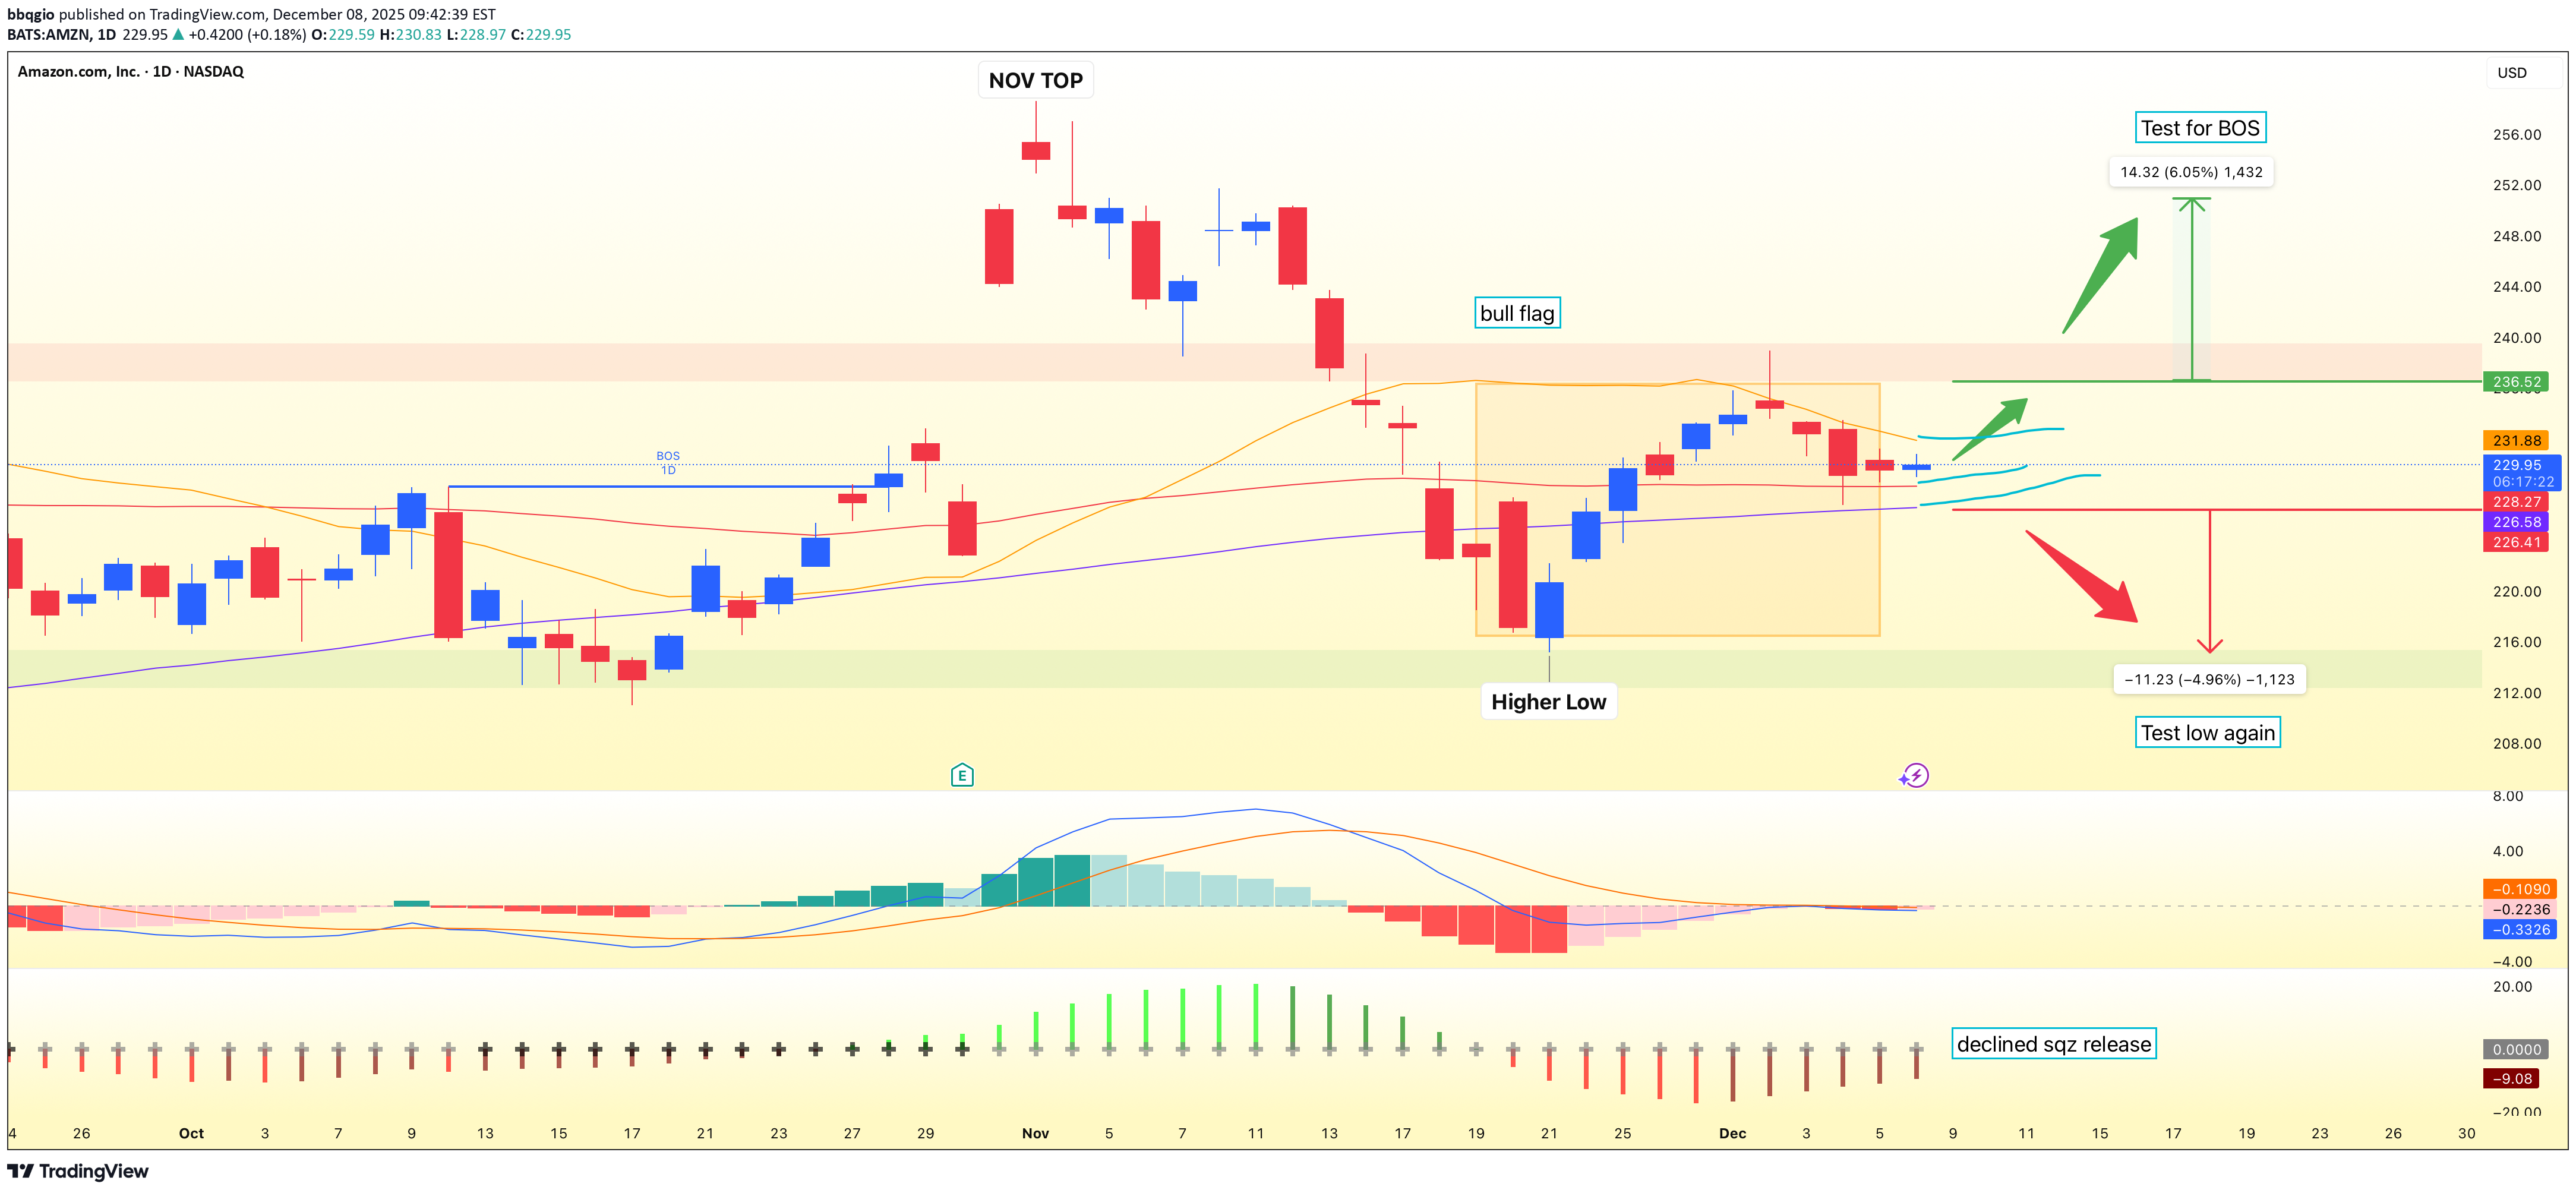
Amazon (AMZN) is trending higher on the daily chart after a strong rally off the mid-October low, confirmed by a bullish Break of Structure and price holding above the rising 60-day and 120-day moving averages. Price is now consolidating in a classic bull flag beneath resistance, with key demand anchored near the $215.00 base of the prior reversal and a major support zone building around $218–224. The primary path is continuation. A decisive daily close above $236 would confirm a breakout from the flag and clear the $235.50 resistance ceiling, opening room toward the $240 area and then the $248–250 zone as trend-followers step back in. A more conservative trend approach looks for a dip toward the 60-day moving average near $228 and a subsequent reclaim of $229, signaling buyers defending dynamic support and aiming for a retest of the recent highs. If price instead closes below $226, that would warn of pattern failure and invite a deeper correction toward the $218 major support and potentially lower. Below that, the bullish thesis weakens materially and any long bias should be reassessed until structure improves. This is a study, not financial advice. Manage risk and invalidations. Thought of the Day 💡 Strong trends rarely move in straight lines—most of the edge is found in how you trade the pauses. ------------------------ Thanks for your support! If you found this idea helpful or learned something new, drop a like 👍 and leave a comment, I’d love to hear your thoughts!
bbqgio
بیت کوین در آستانه انفجار صعودی: آیا پول هوشمند پرچم صعودی را میشکند؟
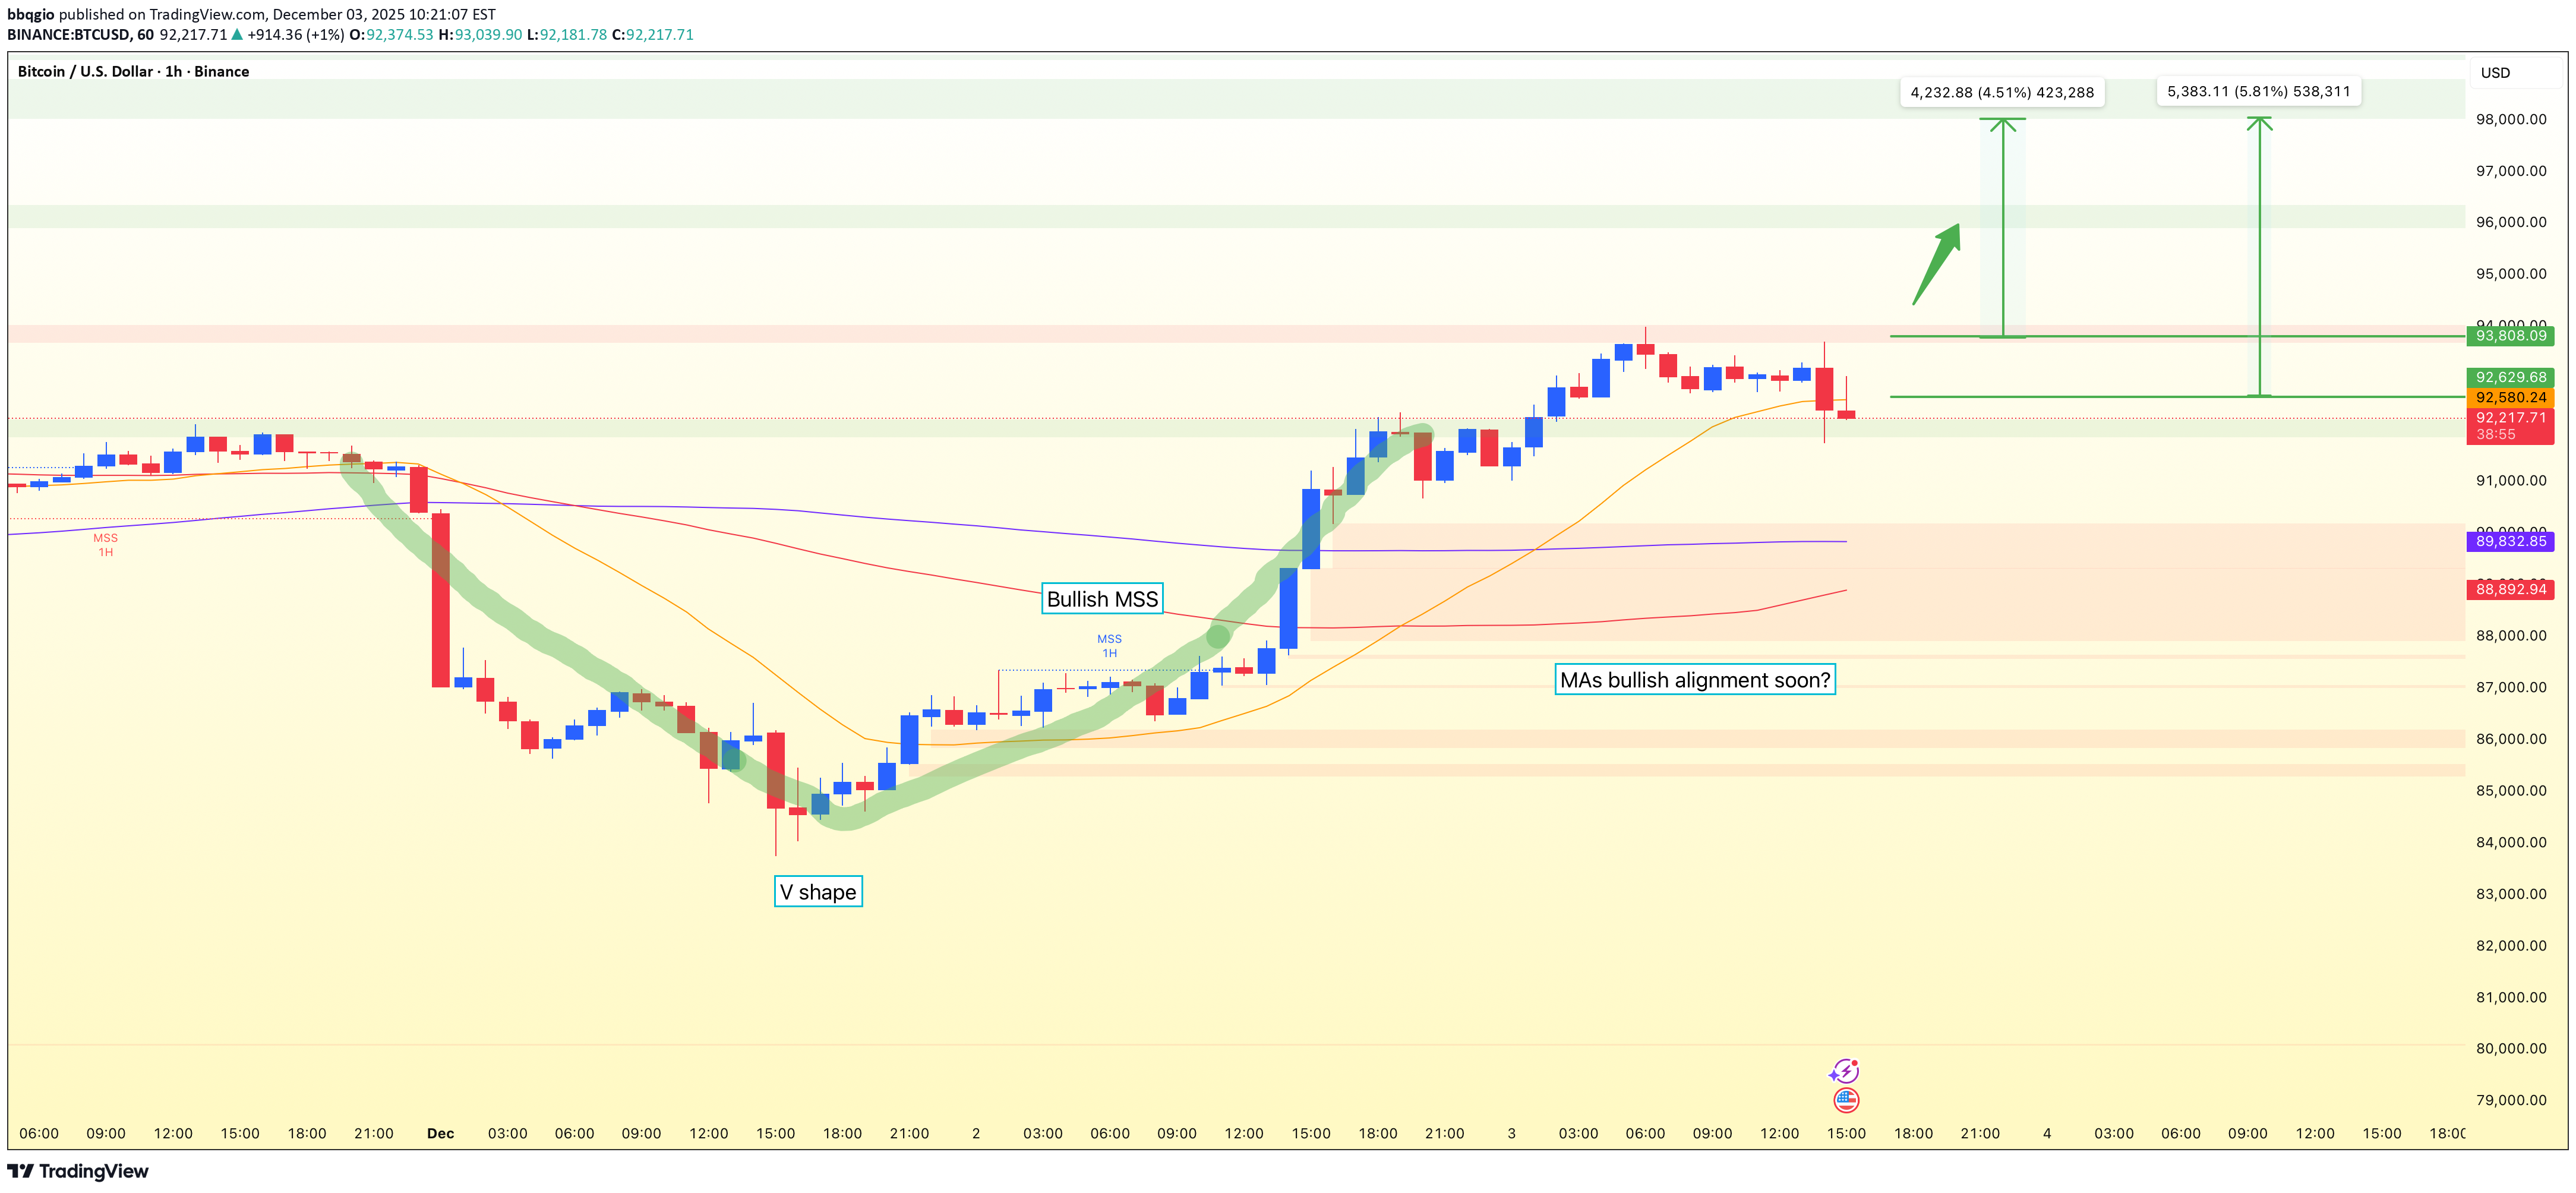
BTCUSD on the 1H chart has snapped back in a sharp V-shaped recovery and is now cooling off in a tight consolidation. Using Smart Money Concepts, the recent bullish Market Structure Shift (MSS) and price holding above the 20, 60 and 120 MAs frame a clear bullish bias. Short-term demand is building around support near 92,340, while resistance at 93,161.86 caps the top of the range and defines the “flag” portion of a Bullish Flag structure. The primary path favors continuation higher if buyers can force a clean breakout. A sustained 1H close above 93,800 would confirm strength through resistance and signal a potential trend continuation toward 95,000 and 97,000, with an extension into the 98,000 region if momentum and ATR expand. As long as 92,340 holds, pullbacks into this zone can be treated as constructive rather than bearish, in line with the bullish MSS. If 92,340 fails decisively, Smart Money traders will watch the next downside liquidity zones around 91,250–90,600 and the bearish Fair Value Gaps in the 87,962–90,200 area as potential draw targets. A more conservative SMC-style “reclaim” idea looks for a dip and then a 1H close back above 92,600, with invalidation below 91,500 and upside focus still on 98,000. This is a study, not financial advice. Manage risk and invalidations. Thought of the Day 💡: A clear structure plus a clear invalidation is the real edge—protect it. -------------------------- Thanks for your support! If you found this idea helpful or learned something new, drop a like 👍 and leave a comment, I’d love to hear your thoughts!
bbqgio
آیا بیت کوین در آستانه سقوط است؟ تحلیل تکنیکال و سطوح کلیدی قیمت BTC
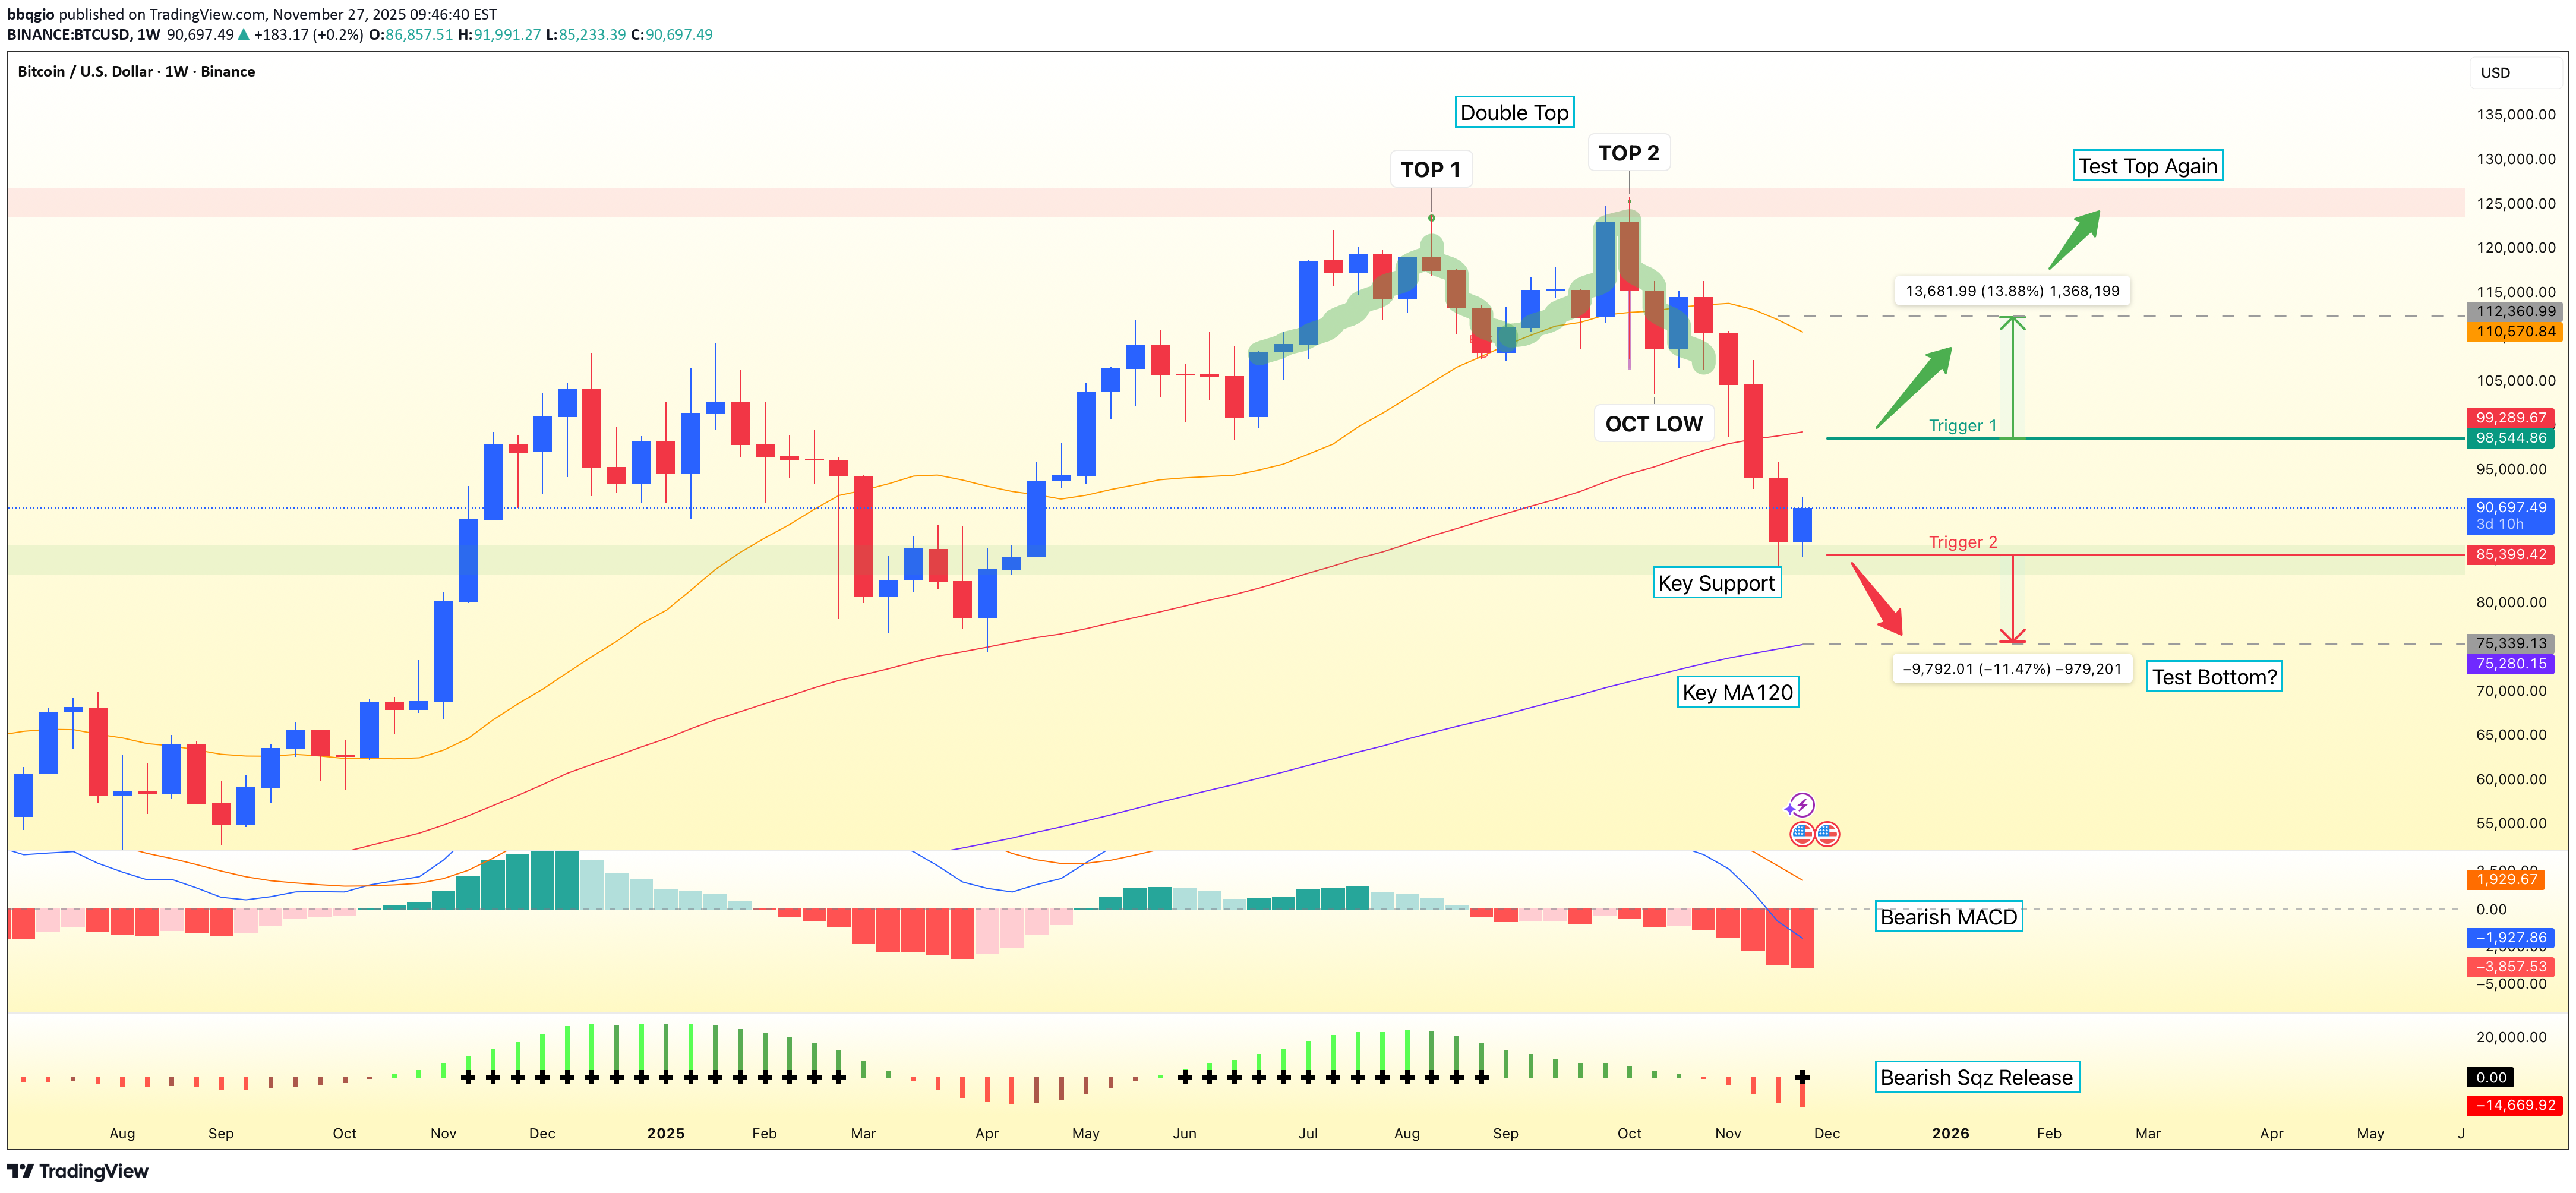
Bitcoin on the weekly chart has shifted from strong trend to corrective territory. After topping twice near the 125,000 resistance, price has broken below the 20-week and 60-week MAs (around 110,662 and 99,350), and is now pressing into the 86,000 demand area and the prior swing low near 85,250. This aligns with a moderately confirmed Double Top, with the neckline around 105,000 now acting as key resistance within a broader, still-intact long-term uptrend supported by the 120-week MA near 75,292. The primary path favors further downside as long as BTCUSD holds below the neckline and the 99,000–105,000 region. A weekly close below 85,250 would confirm a bearish Market Structure Shift, validating the Double Top and opening room toward 82,000 and then the 75,500 target just above the 120-week MA. In this scenario, rallies back toward 95,000–99,000 are likely to be treated as corrective bounces within a dominant downtrend. If buyers can defend 86,000 and push for a 1W close above 98,000, the focus shifts to a mean-reversion move toward the 60-week MA and the 105,000 neckline, with potential extension toward 112,000. A sustained weekly close back above 95,000–98,000 would begin to weaken the bearish thesis. This is a study, not financial advice. Manage risk and invalidations. Thought of the Day 💡: Clear triggers and invalidations matter more than perfect forecasts. -------------------------- Thanks for your support! If you found this idea helpful or learned something new, drop a like 👍 and leave a comment, I’d love to hear your thoughts!
bbqgio
HOOD Bearish Setup?
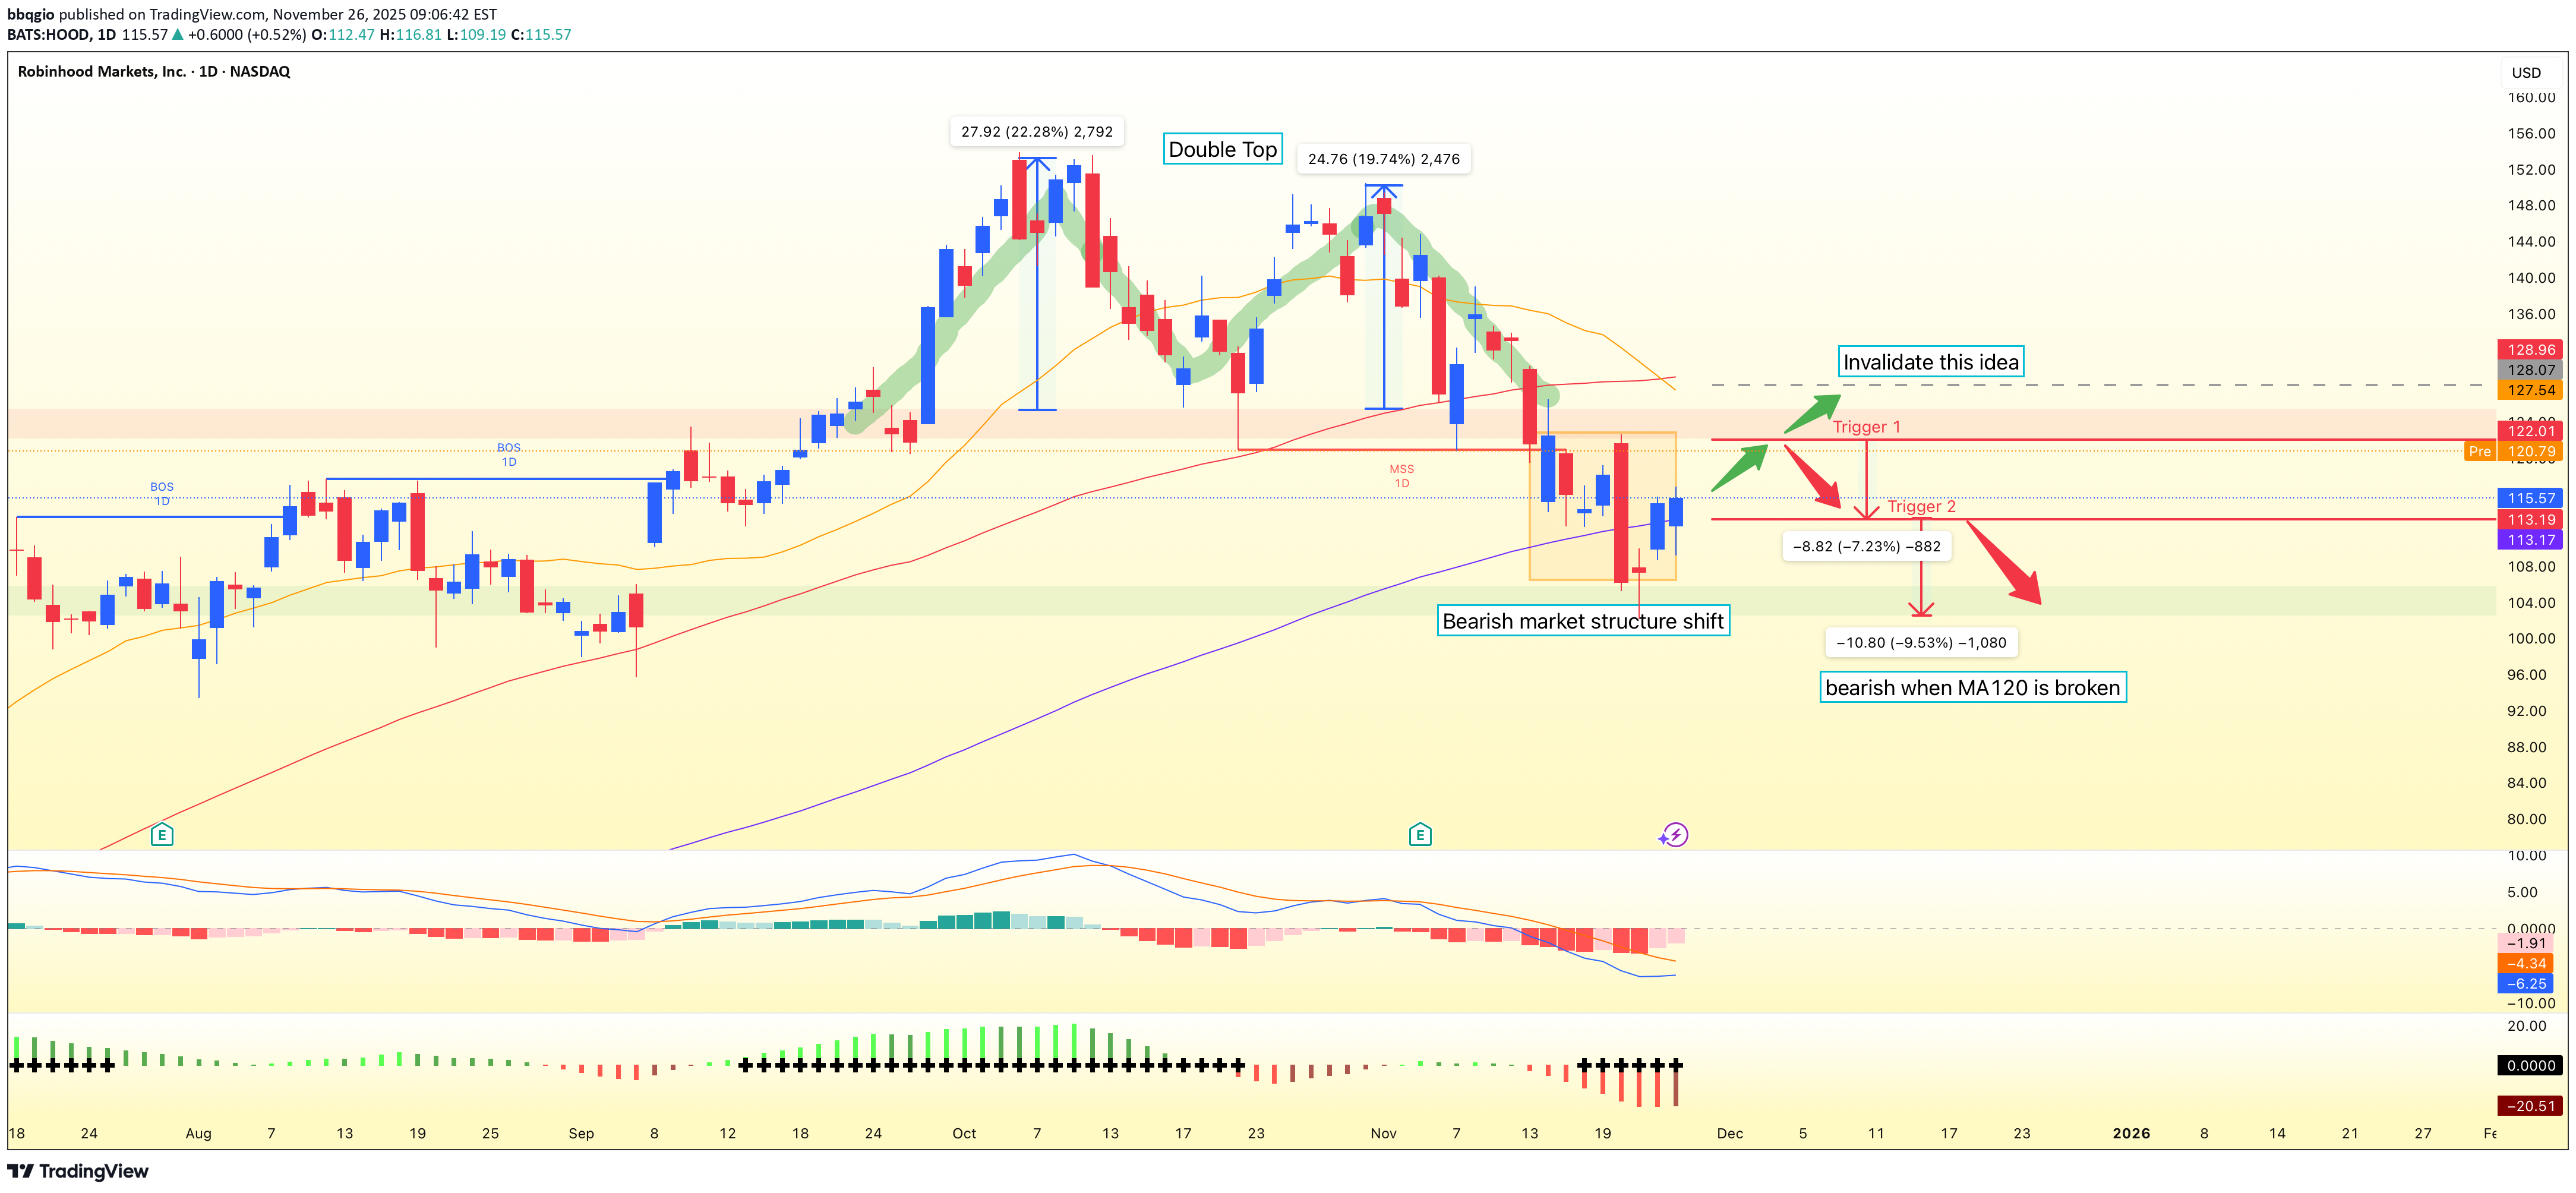
HOOD on the daily chart has completed a clear bearish Market Structure Shift after its October peak. Price is now trading below the 20-day and 60-day moving averages (around 127.54 and 128.96), confirming short- to mid-term downside momentum, while resting on long-term support near the 120-day MA around 113.17. We’ve already seen price bounce off this zone, and with premarket now around 121, the earlier “bounce long” idea is effectively behind us. From here, the primary plan is to fade strength into the former support turned resistance around 122.50. If price pushes into that zone and fails—confirmed by a bearish daily candle or a close back below 121.00—the short bias is favored. The first downside objective is a retest of the 110.00–113.00 area around the 120-day MA and recent lows. A clean break below 104.00 would open the door to a deeper move toward the psychological 100.00 level. Invalidation for the bearish view sits above 128.00, where a daily close would reclaim the 20- and 60-day MAs and negate the idea of simple rally-fades. This is a study, not financial advice. Manage risk and invalidations. Thought of the Day 💡 Good trade ideas are built around “if–then” conditions, not predictions. Define the path, then wait for price to prove it. -------------------------- Thanks for your support! If you found this idea helpful or learned something new, drop a like 👍 and leave a comment, I’d love to hear your thoughts
Disclaimer
Any content and materials included in Sahmeto's website and official communication channels are a compilation of personal opinions and analyses and are not binding. They do not constitute any recommendation for buying, selling, entering or exiting the stock market and cryptocurrency market. Also, all news and analyses included in the website and channels are merely republished information from official and unofficial domestic and foreign sources, and it is obvious that users of the said content are responsible for following up and ensuring the authenticity and accuracy of the materials. Therefore, while disclaiming responsibility, it is declared that the responsibility for any decision-making, action, and potential profit and loss in the capital market and cryptocurrency market lies with the trader.