
ADA
Cardano
| تریدر | نوع سیگنال | حد سود/ضرر | زمان انتشار | مشاهده پیام |
|---|---|---|---|---|
 VasilyTraderRank: 18 | خرید | حد سود: تعیین نشده حد ضرر: تعیین نشده | 12/5/2025 | |
 BULLSTAR1Rank: 594 | خرید | حد سود: تعیین نشده حد ضرر: تعیین نشده | 12/9/2025 | |
 Smarttrader0786Rank: 1102 | خرید | حد سود: تعیین نشده حد ضرر: تعیین نشده | 15 hour ago | |
 tomas_jntxRank: 3846 | خرید | حد سود: تعیین نشده حد ضرر: تعیین نشده | 12/13/2025 | |
 TuffyBroRank: 4076 | خرید | حد سود: تعیین نشده حد ضرر: تعیین نشده | 12/15/2025 |
Price Chart of Cardano
سود 3 Months :
خلاصه سیگنالهای Cardano
سیگنالهای Cardano
Filter
Sort messages by
Trader Type
Time Frame
Smarttrader0786
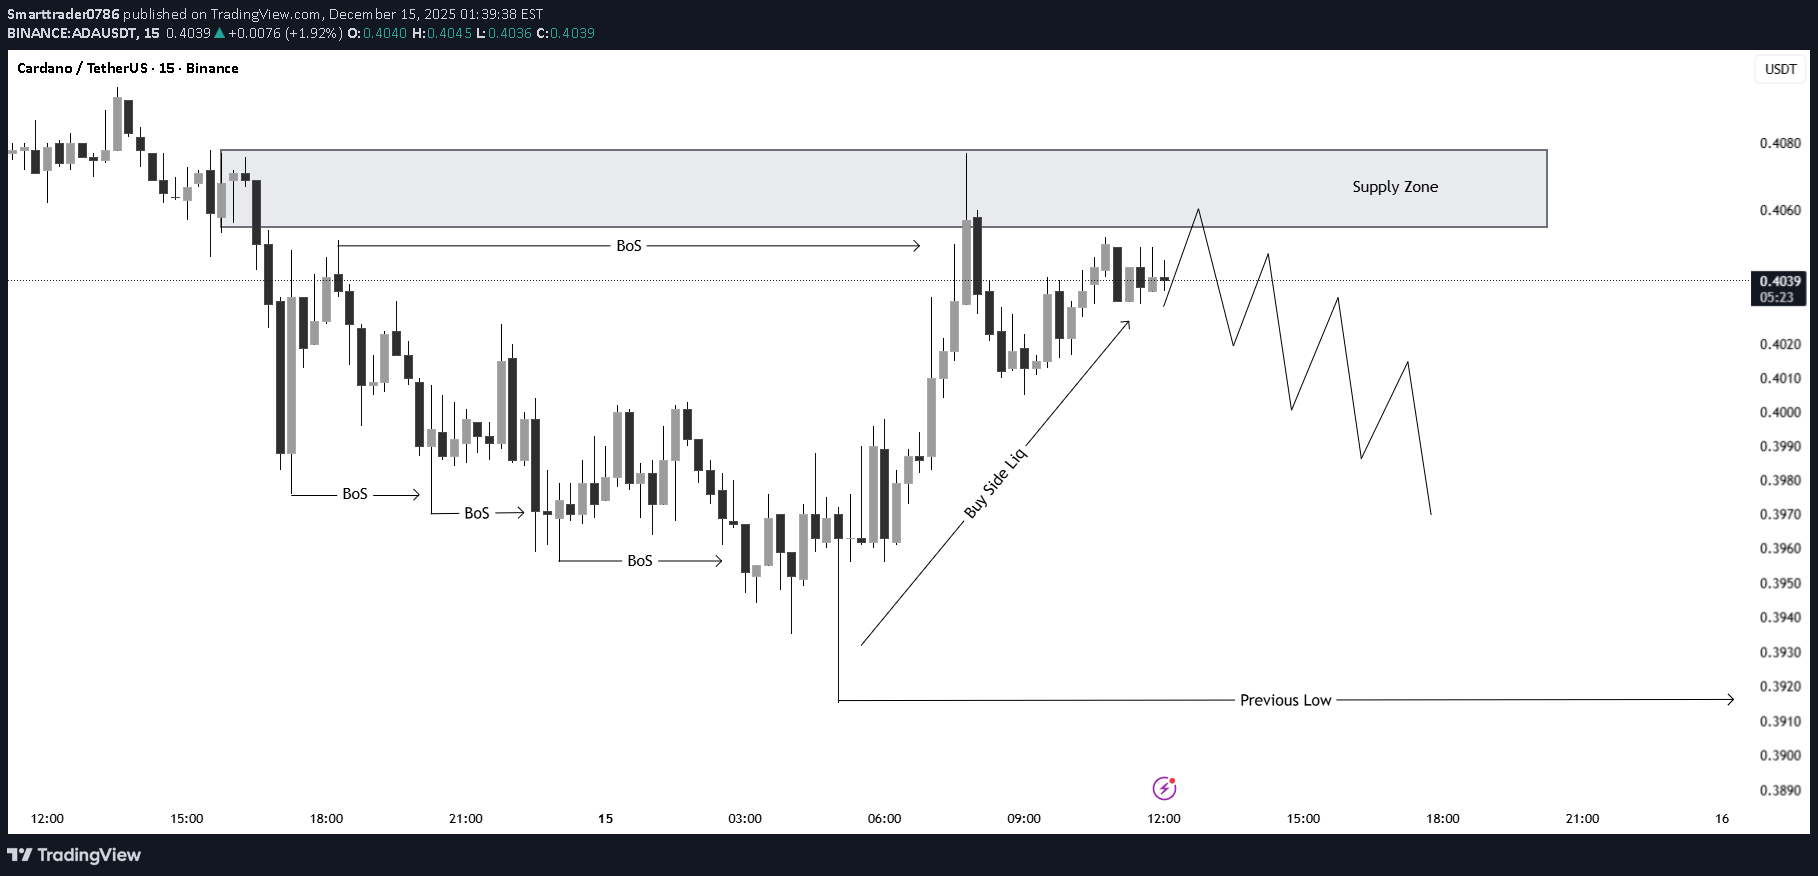
SMC Trading Strategy ( #ADAUSDT ) Buy Trade Setup.
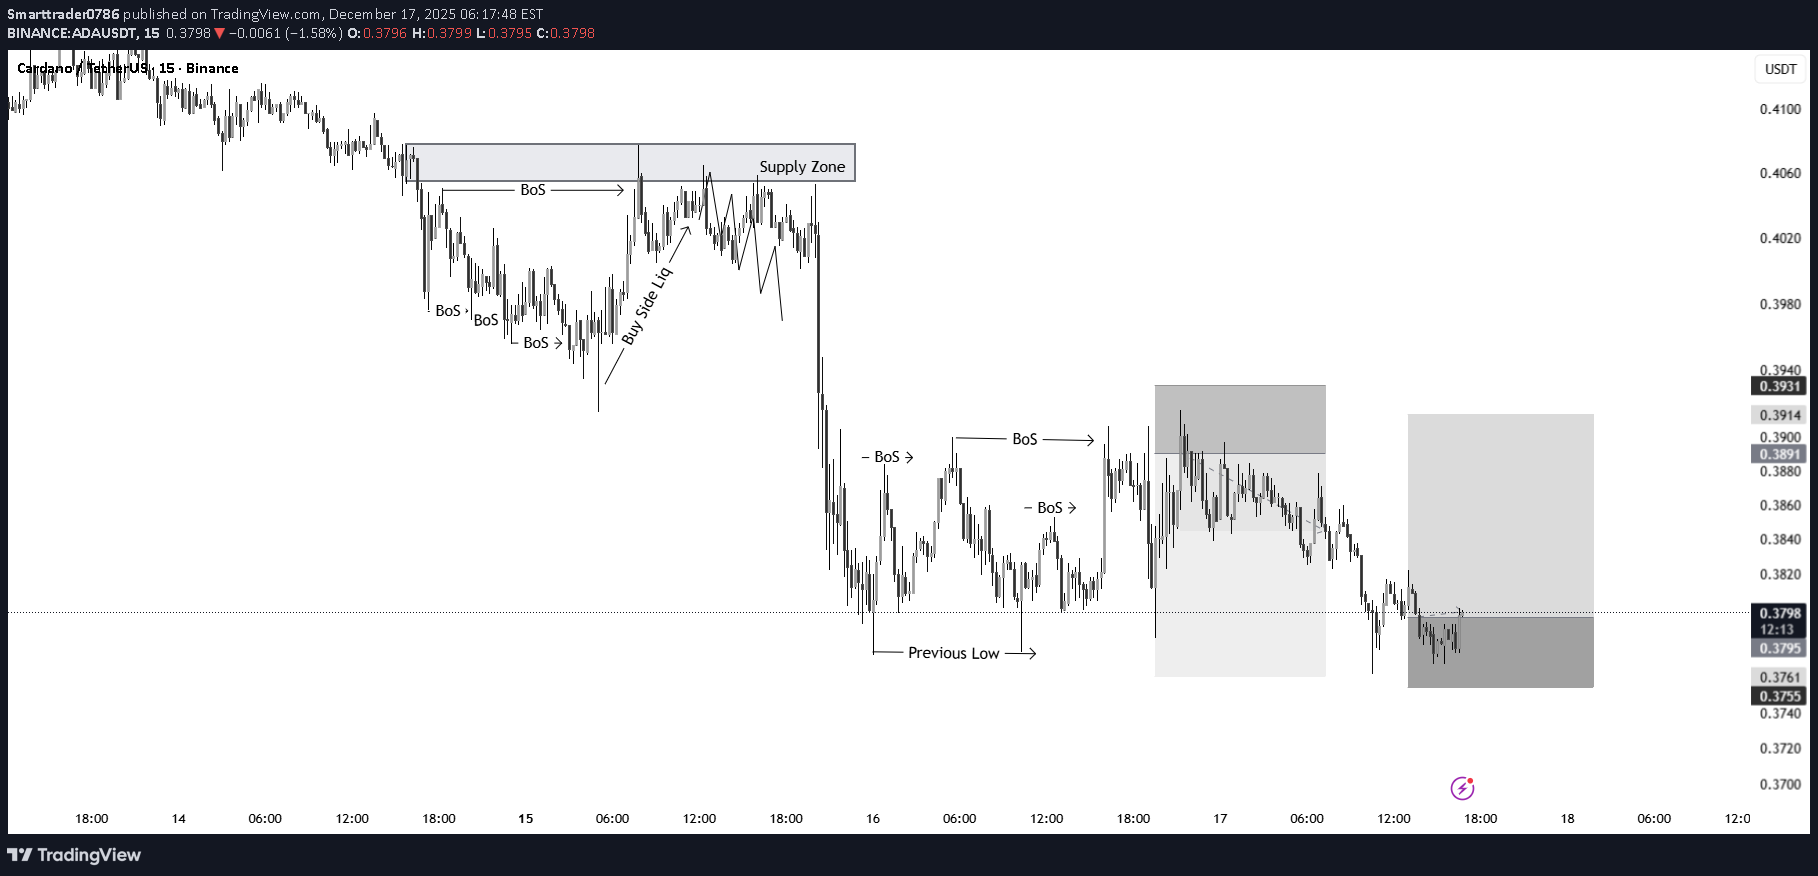
Hello, TradingView community and my subscribers, please if you like ideas do not forget to support them with your likes and comments, thank you so much and we will start a LONG outlook on #CHFJPY explained. Price action analysis

coinpediamarkets
$ADAUSDT — Buyers Step In,Upside Targets $0.42 & $0.46 in Sight!
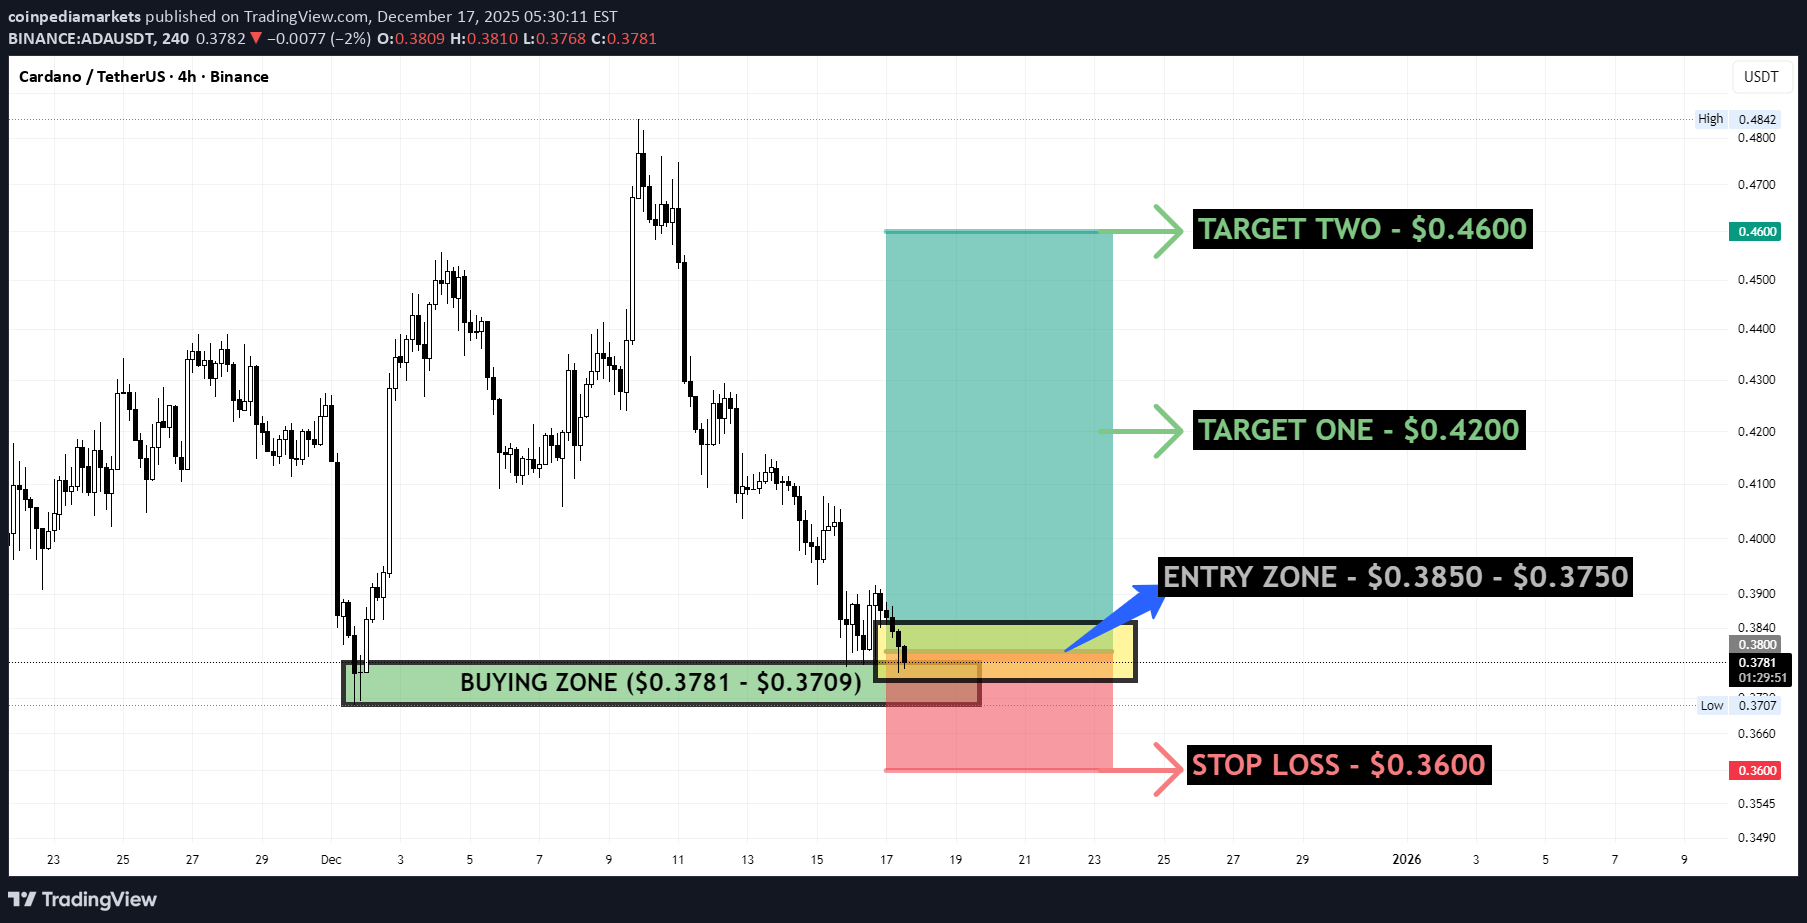
ADAUSDT has pulled back into a key demand and entry zone at $0.3850 – $0.3750 on the 4H timeframe, where price is reacting after a strong sell-off. This area aligns with previous structure support and is acting as a potential base for buyers. As long as price holds above this zone, upside continuation is favored with targets at $0.4200 (TP1) and $0.4600 (TP2). A clean break below $0.3600 would invalidate the setup and signal further downside risk. Risk is clearly defined, making this a well-structured long opportunity. #ADAUSDT #ADA #Cardano #CryptoTrading #Altcoins #PriceAction

Migoreng_wrap
ADA to lift off for Wave 3 soon?
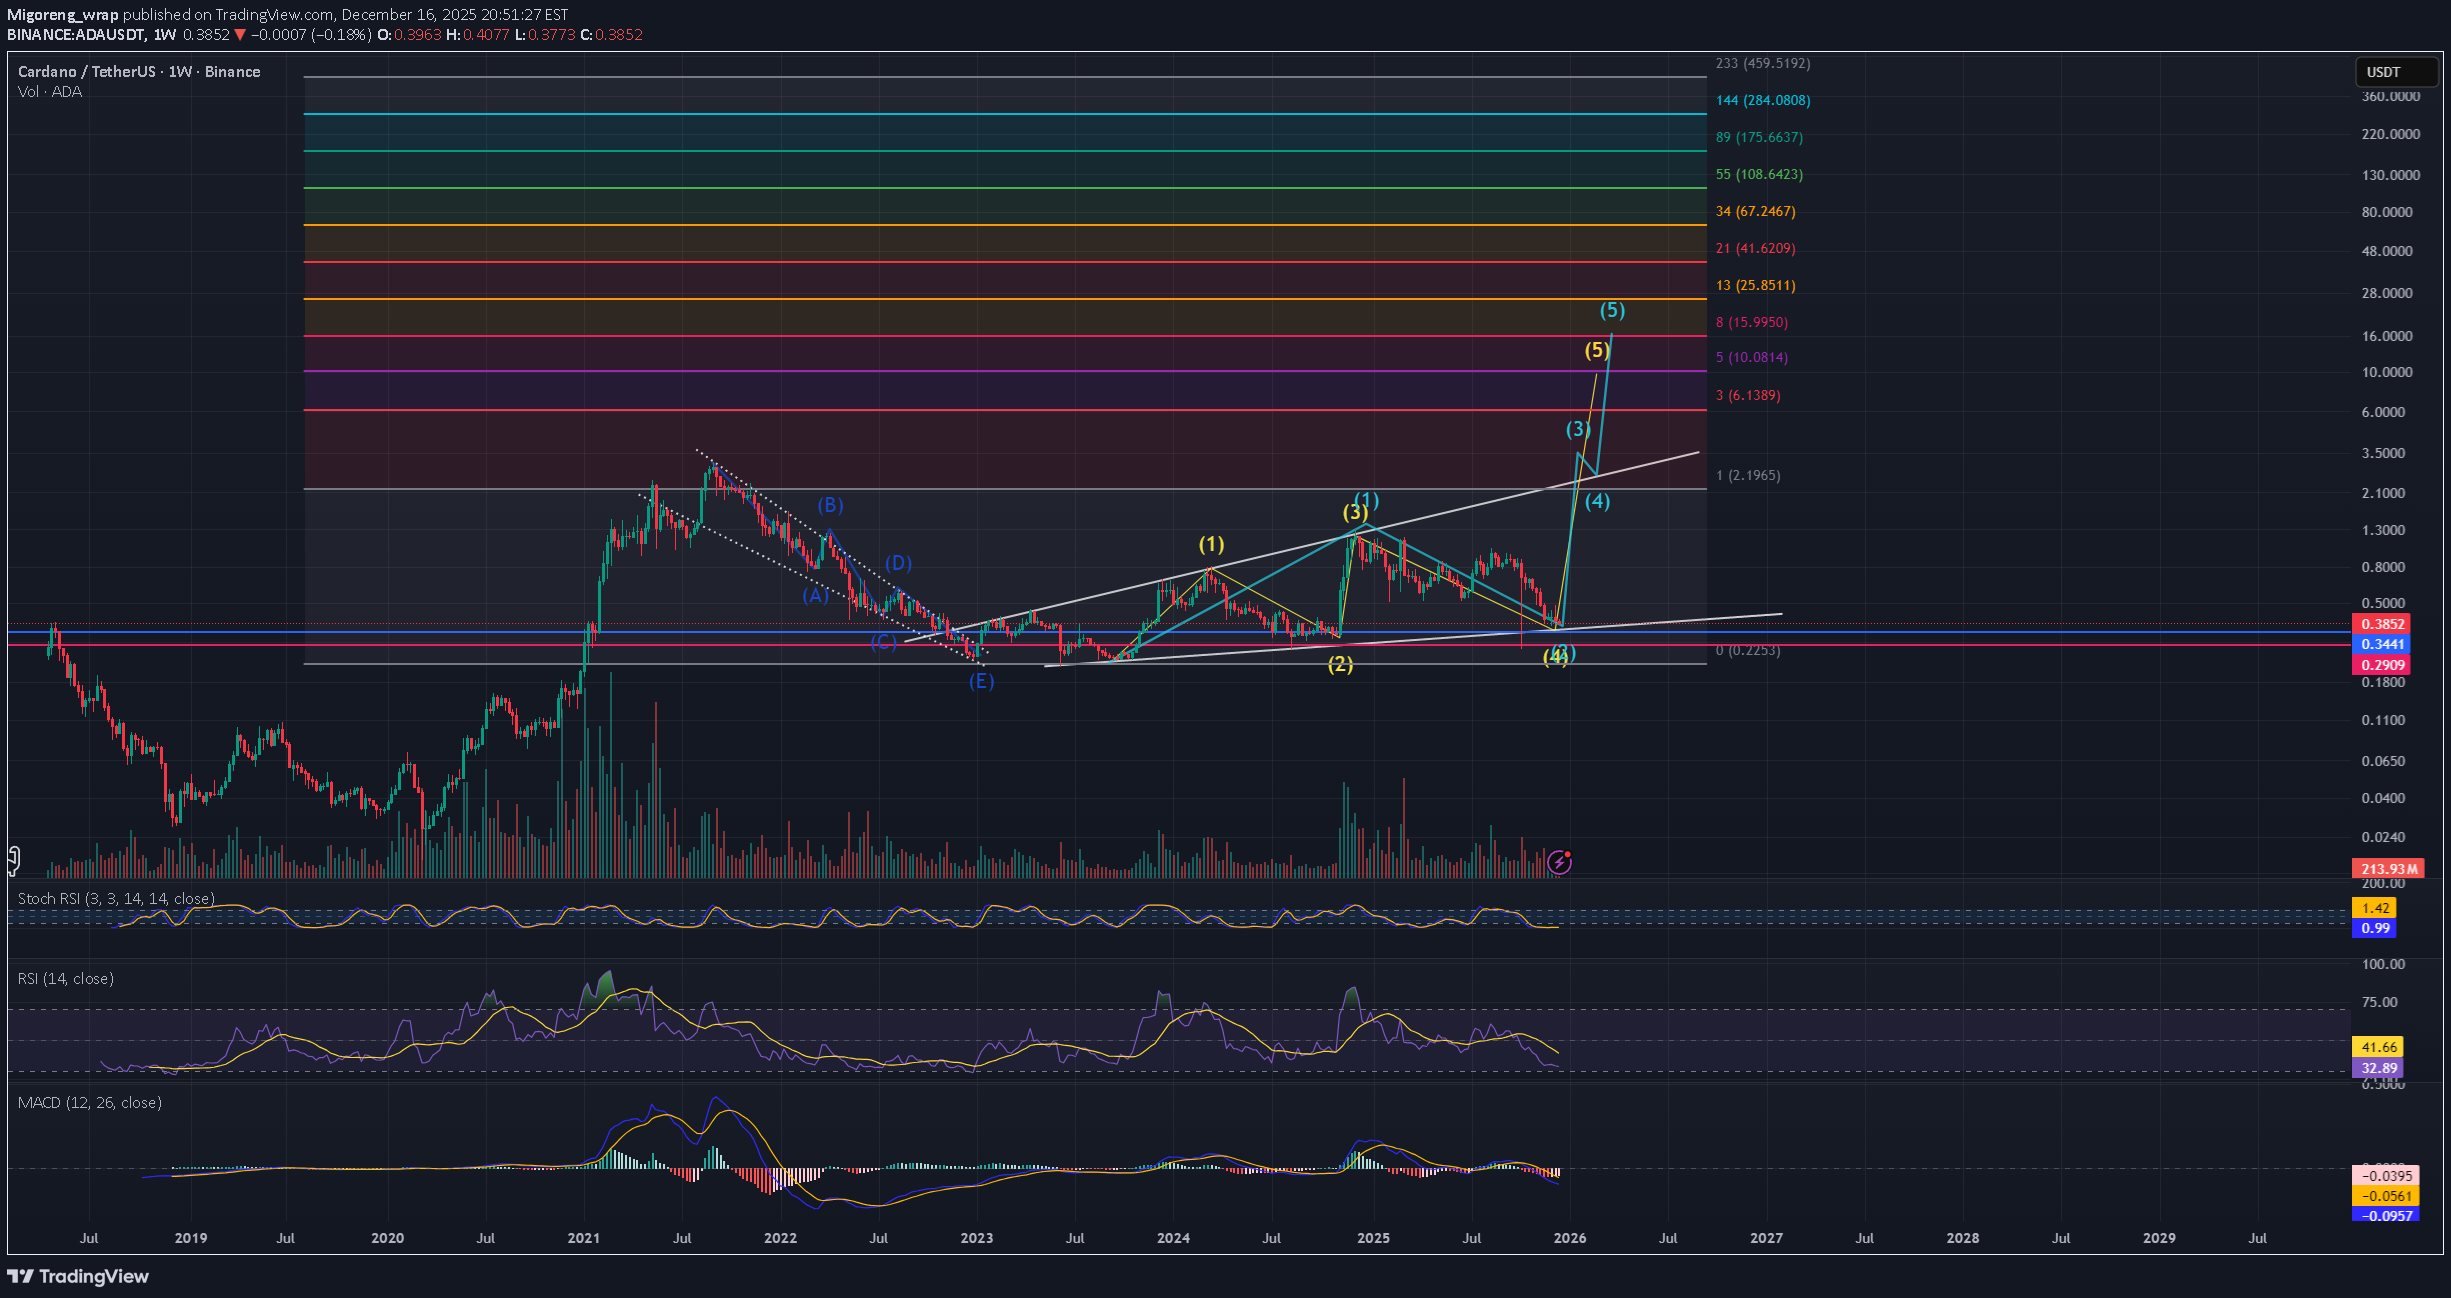
ADA CARDANO's treasury-backed push into stable coins is a core part of Cardano's 2025–2026 strategy to boost adoption. The trade setup looks like a broad wave (1), with the 2nd EW corrective phase. It looks like a Wave (3) Push is coming to hopefully smash through the last ATH of $3.09 US. ADA / BTC is also showing signs of a potential reversal soon.

DTechnical
Brown Side
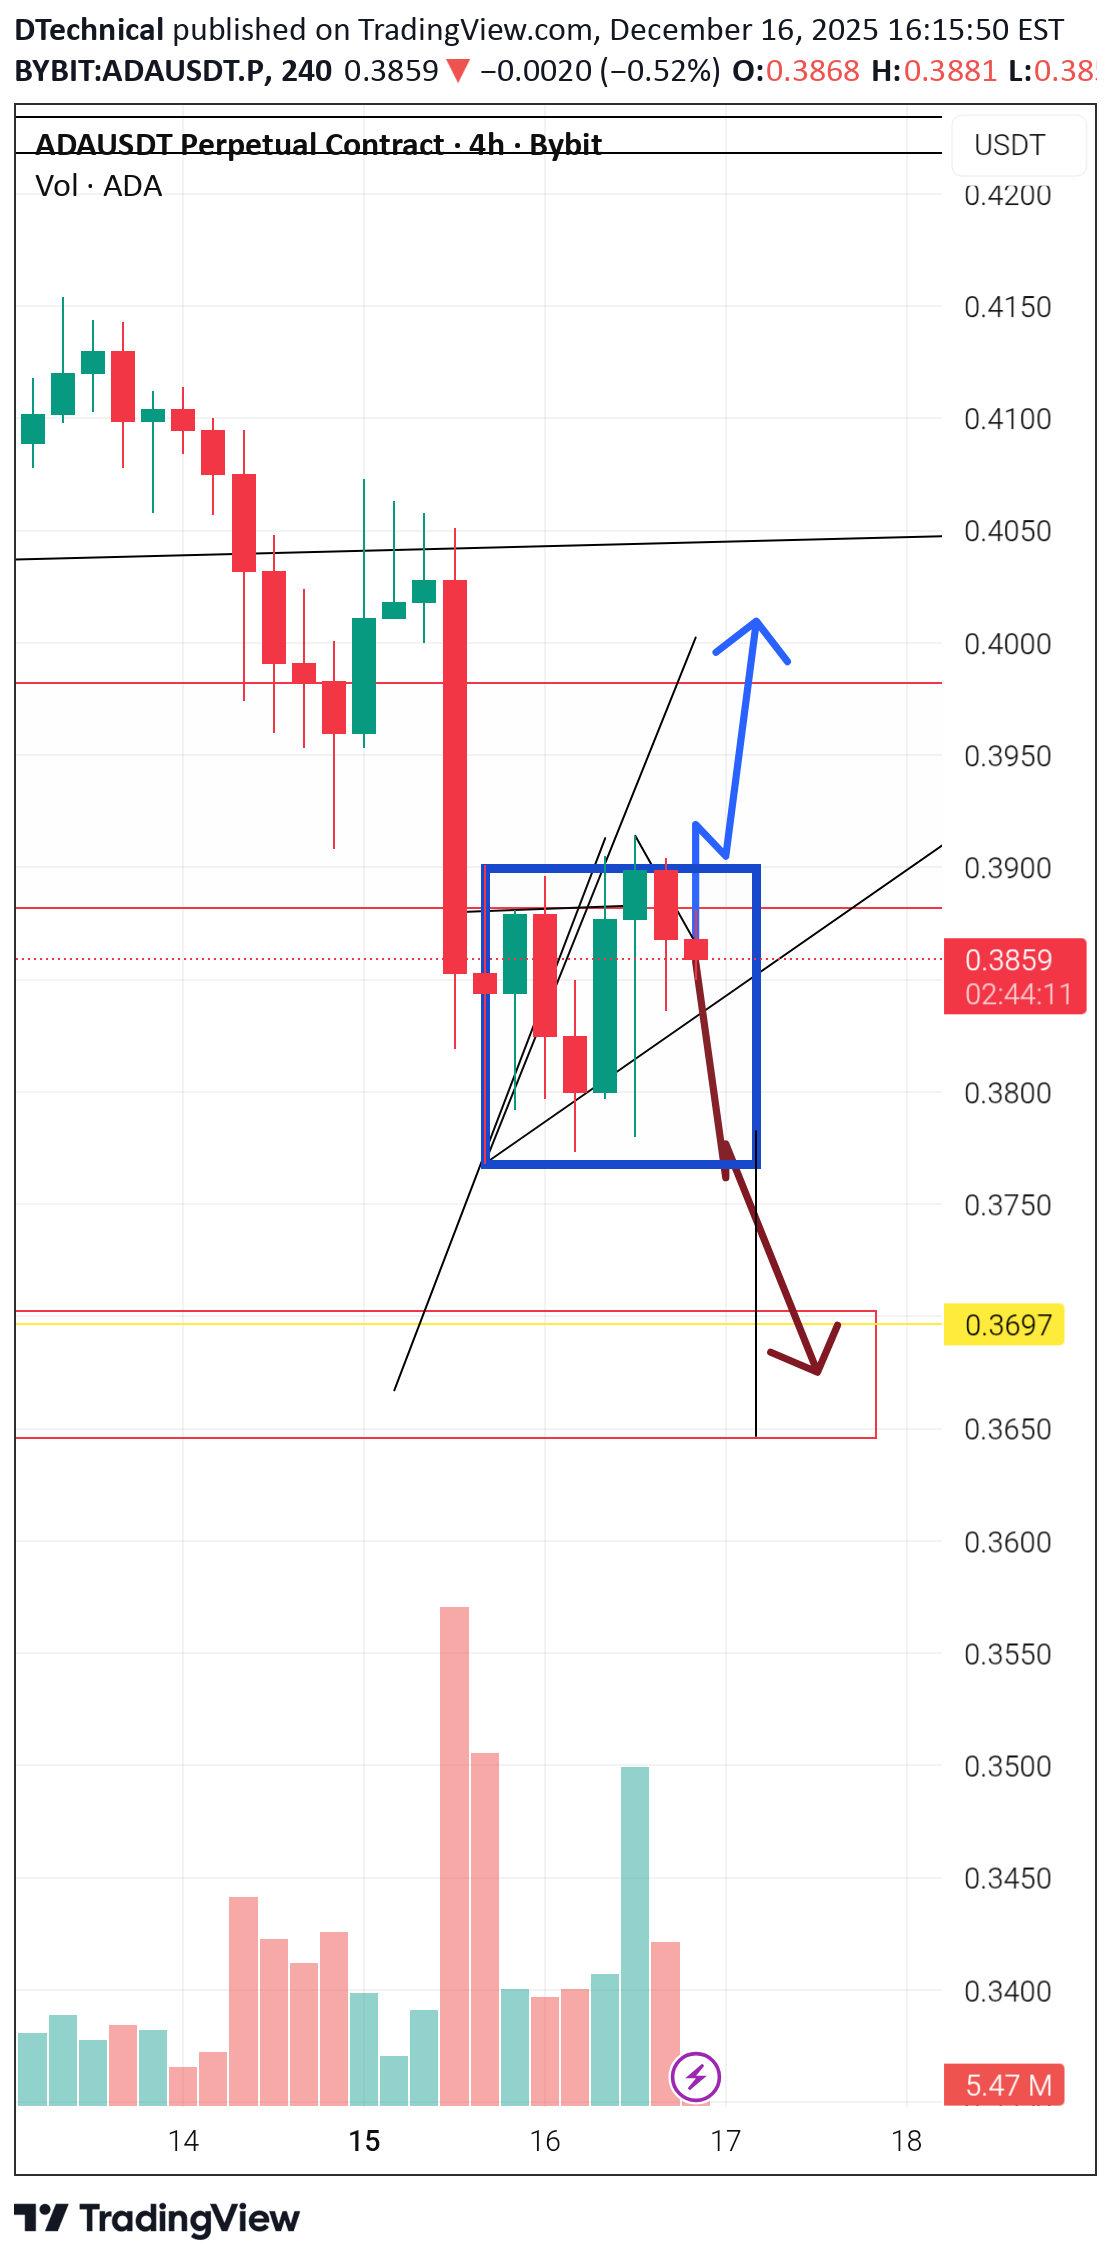
This is giving the possible bias of ADA And we have chosen to go with the brown for now

Trade Nation
ADAUSD Bearish sideways consolidation capped at 4,590
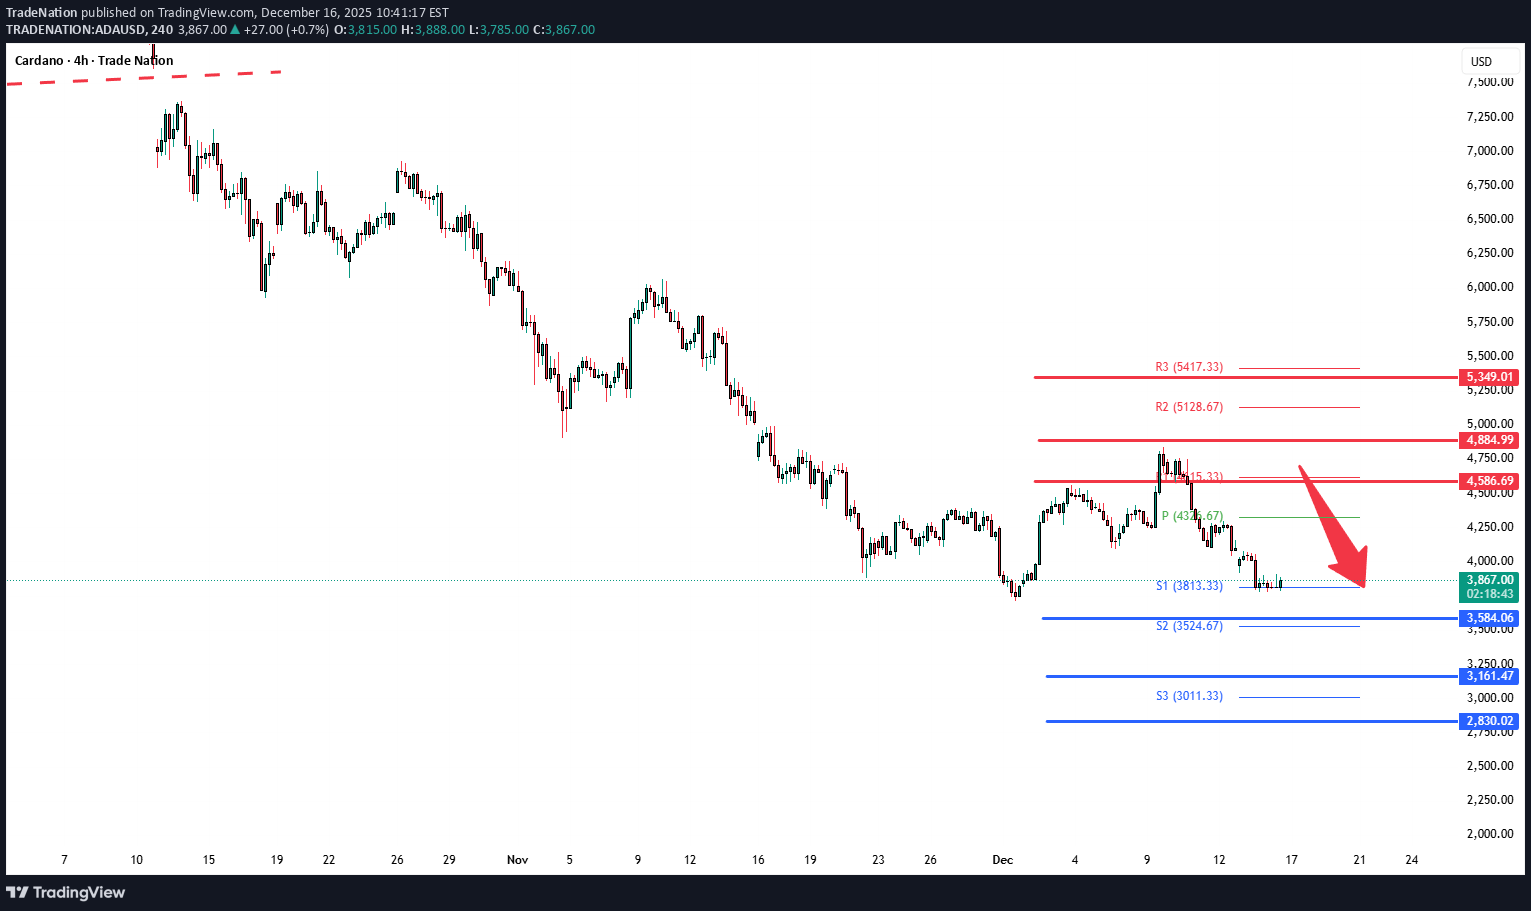
The ADAUSD pair continues to display a bearish outlook, in line with the prevailing downward trend. Recent price action suggests a corrective pullback, potentially setting up for another move lower if resistance holds. Key Level: 4,590 This zone, previously a consolidation area, now acts as a significant resistance level. A failed test and rejection at 4,590 would likely resume the bearish momentum. Downside targets include: 3,580 – Initial support 3,160 – Intermediate support 2,830 – Longer-term support level Bullish Scenario (breakout above 4,590): A confirmed breakout and daily close above 4,590 would invalidate the bearish setup. In that case, potential upside resistance levels are: 4,880 – First resistance 5,350 – Further upside target Conclusion ADAUSD remains under bearish pressure, with the 4,590 level acting as a key inflection point. As long as price remains below this level, the bias favours further downside. Traders should watch for price confirmation around that level to assess the next move. This communication is for informational purposes only and should not be viewed as any form of recommendation as to a particular course of action or as investment advice. It is not intended as an offer or solicitation for the purchase or sale of any financial instrument or as an official confirmation of any transaction. Opinions, estimates and assumptions expressed herein are made as of the date of this communication and are subject to change without notice. This communication has been prepared based upon information, including market prices, data and other information, believed to be reliable; however, Trade Nation does not warrant its completeness or accuracy. All market prices and market data contained in or attached to this communication are indicative and subject to change without notice.
Smarttrader0786
SMC Trading Strategy ( #ADAUSDT ) Sell Trade Setup.
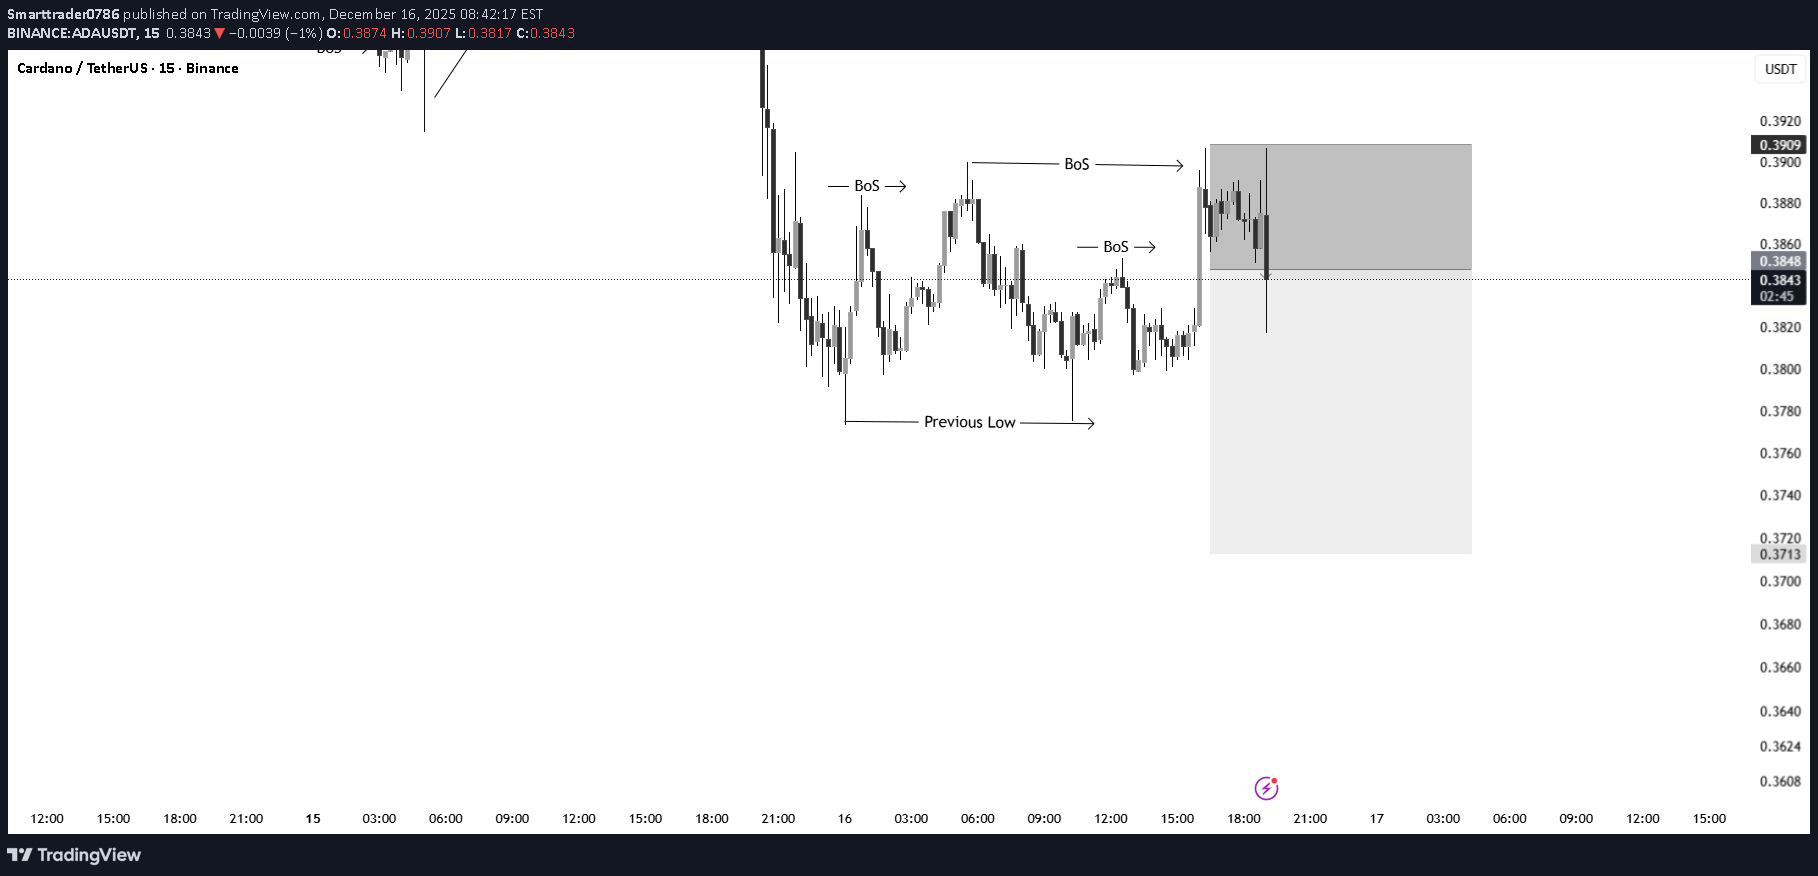
In this Analysis, we can see some Buy or sell Levels that I shared, watch it carefully, and Follow Price action. Thank
#ADAUSDT 4H Chart
Price also tested the extreme demand zone where we are currently seeing a small bullish reaction. Price is expected to continue its bullish movements from that area aiming to liquidate the previous swing high.
ADA – Downtrend Dominates, Risk of Deeper Pullback
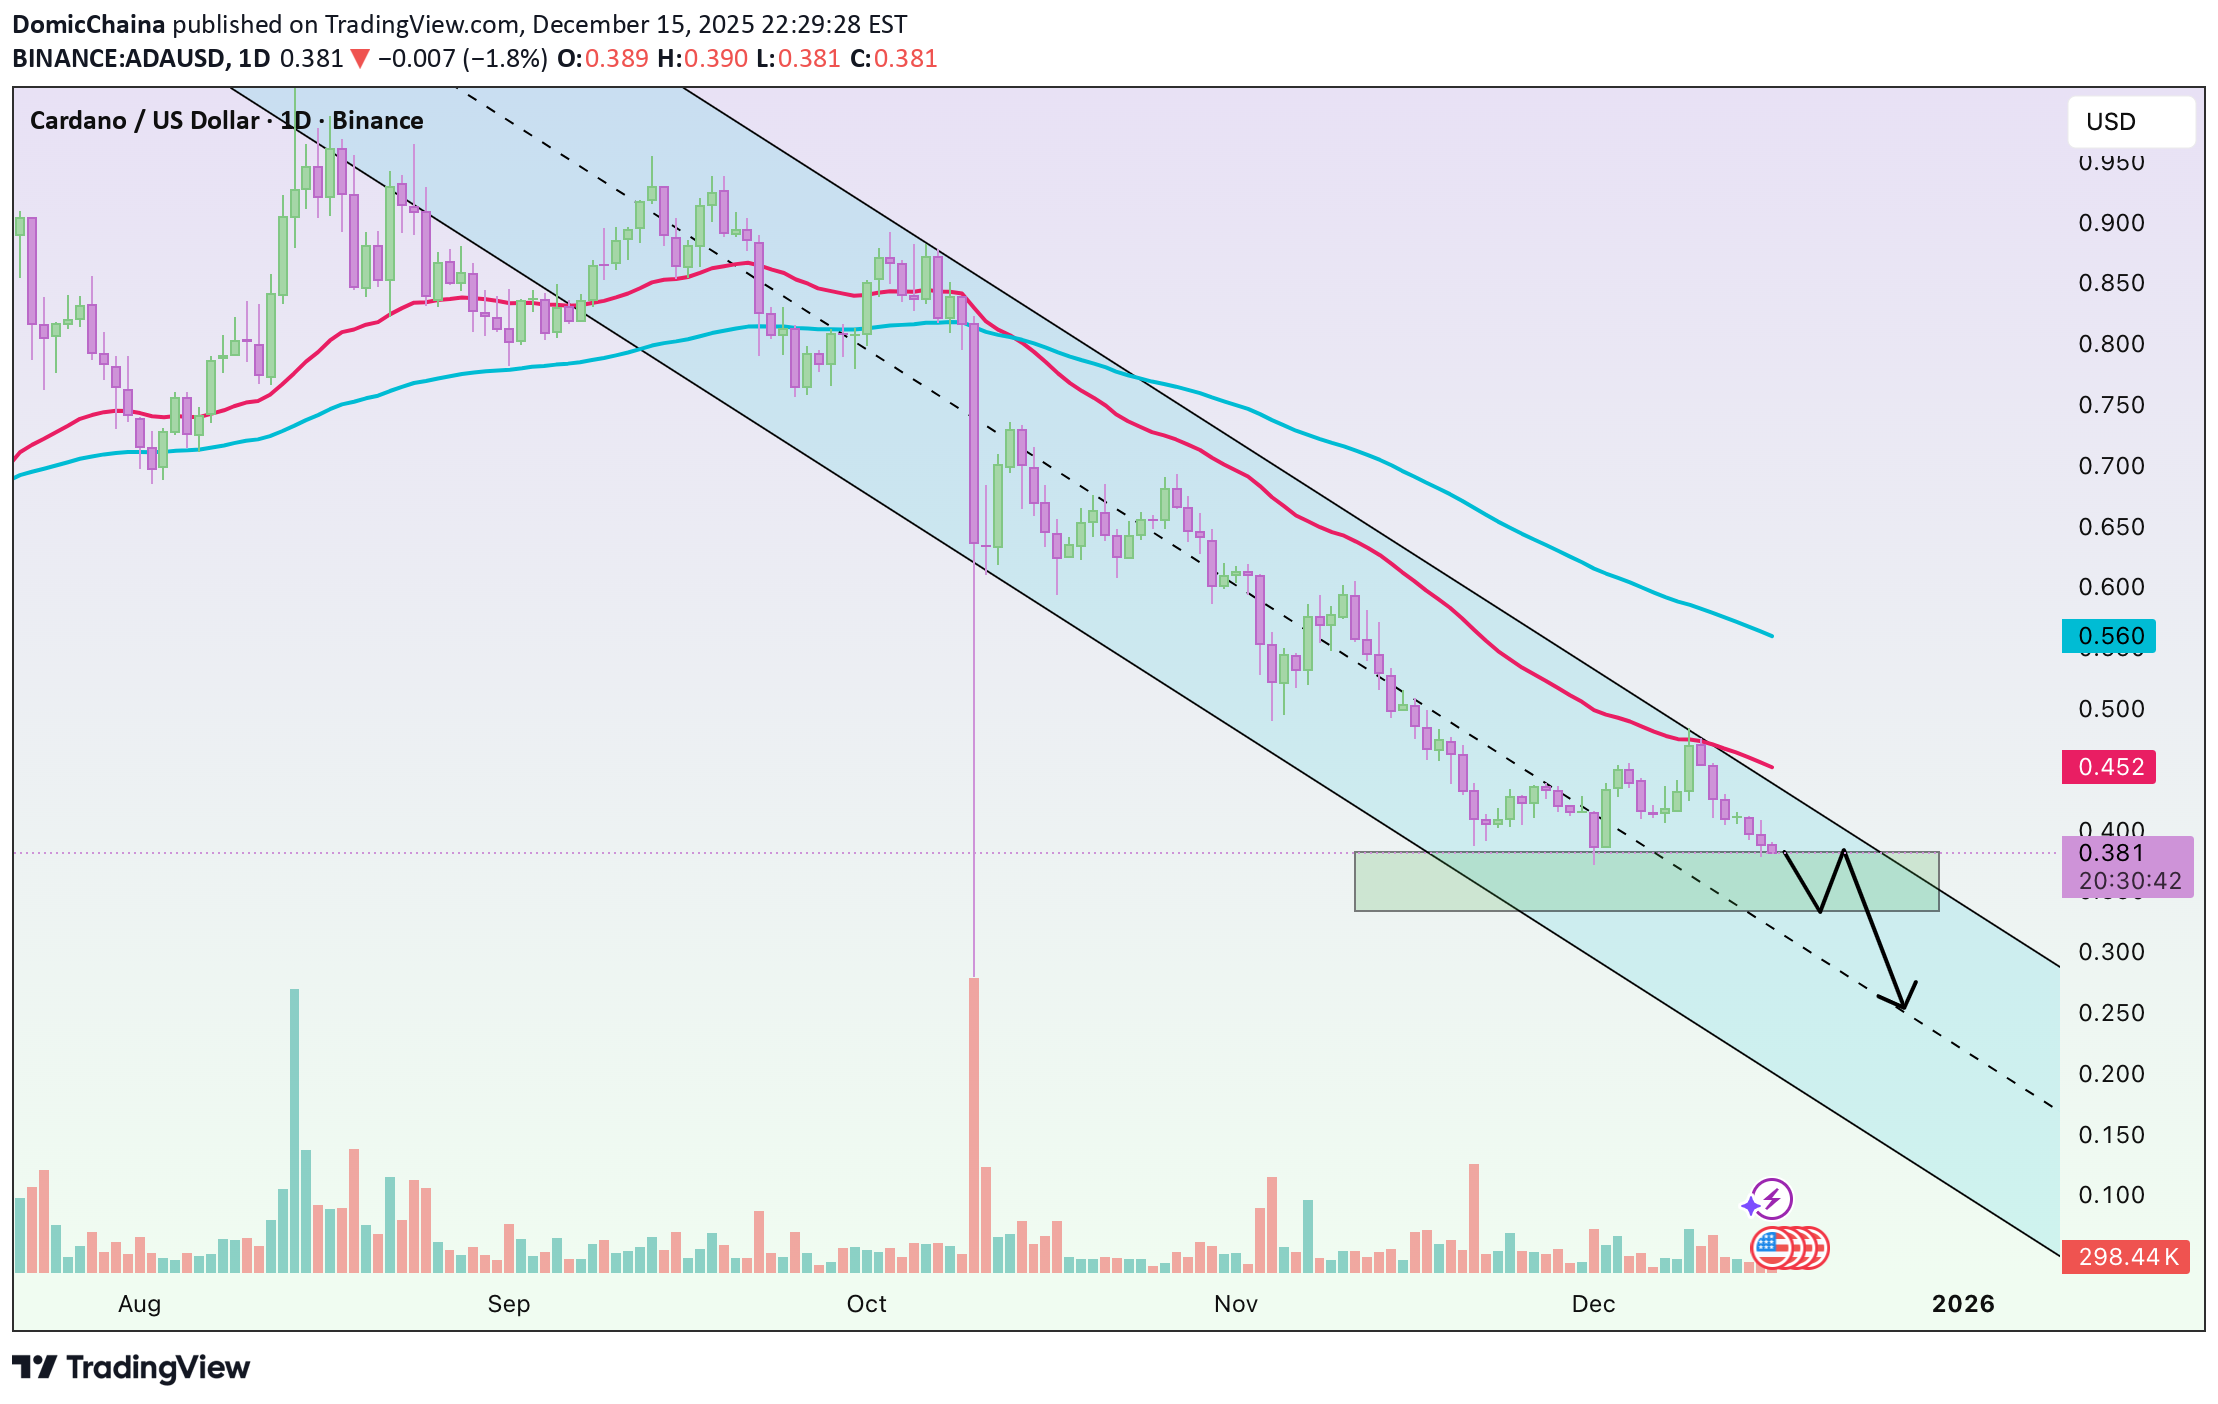
Hello everyone, On the chart, the downtrend remains clearly intact, with a persistent sequence of lower highs and lower lows extending from October to the present. Price is trading entirely below EMA34 and EMA89, both of which are sharply sloping downward. This confirms that sellers continue to control the market, with no meaningful signs of exhaustion so far. Throughout November and December, all rebound attempts have been weak, short-lived, and repeatedly rejected around the EMA34 near the 0.45 USD area. This behavior suggests that buying pressure is purely technical in nature and insufficient to form a reversal structure. At the moment, ADA is hovering around the nearby support zone of 0.37–0.39 USD. However, the current D1 candle structure — small bodies, short lower wicks, and declining volume — indicates fading momentum, a pattern that often precedes a breakdown of support. From an EMA perspective, the widening gap between price and EMA34 (0.452) as well as EMA89 (0.560) further confirms that the downtrend is expanding rather than contracting. To shift the market’s bias, ADA would need at least a daily close above 0.45 USD. At this stage, there are no early signals supporting such a scenario. Volume has continued to dry up over recent weeks and is concentrated mainly on bearish candles, implying a lack of fresh inflows, while sellers still require relatively little pressure to push prices lower. Based on the current technical picture, the highest-probability scenario remains a breakdown below the 0.37–0.38 support zone, followed by an extension of the decline toward deeper support around 0.30–0.33 USD. This area represents a significant liquidity zone that previously acted as a major support, where price could eventually see a technical bounce or begin forming a new accumulation base. Until ADA approaches that region, there is still insufficient evidence to expect a genuine trend reversal. Wishing you all a successful trading day!
TuffyBro
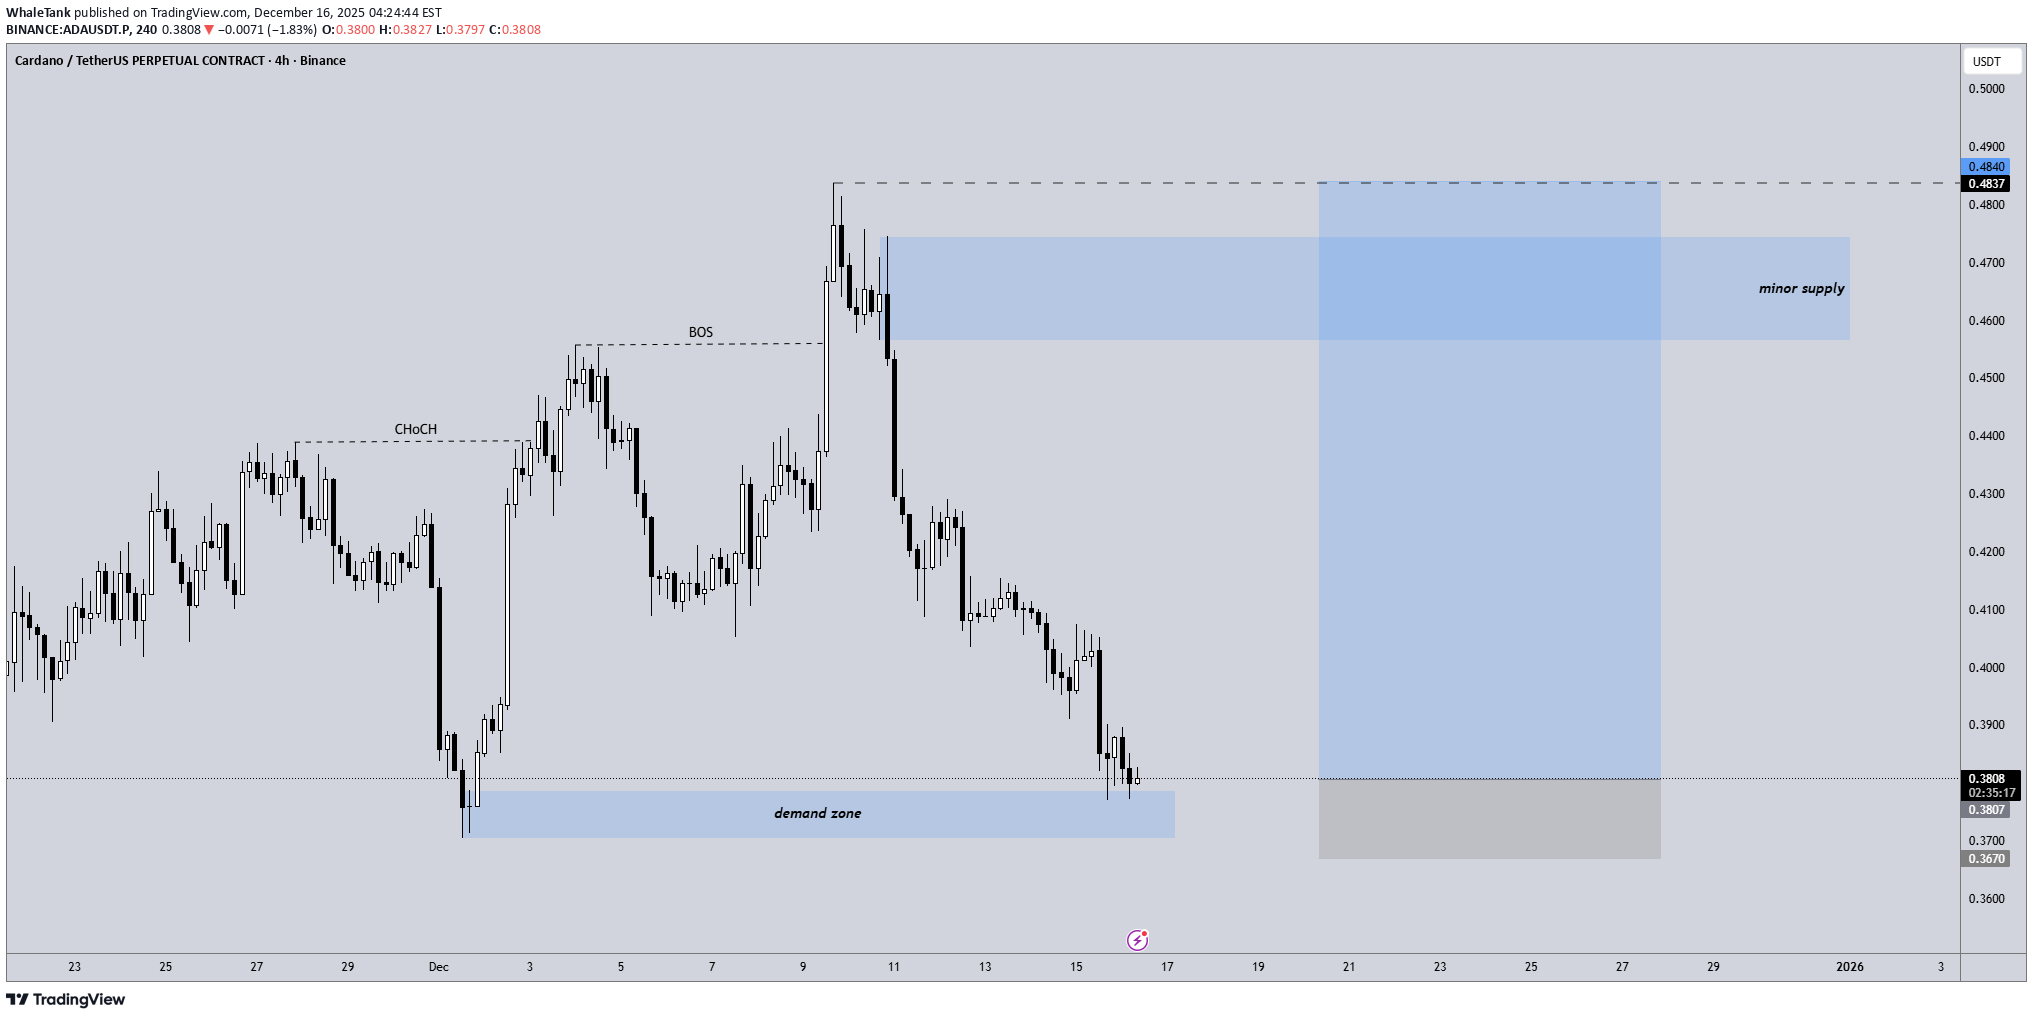
CARDANO (ADA) STRATEGY: TRADING THE ORDER BLOCK RANGE
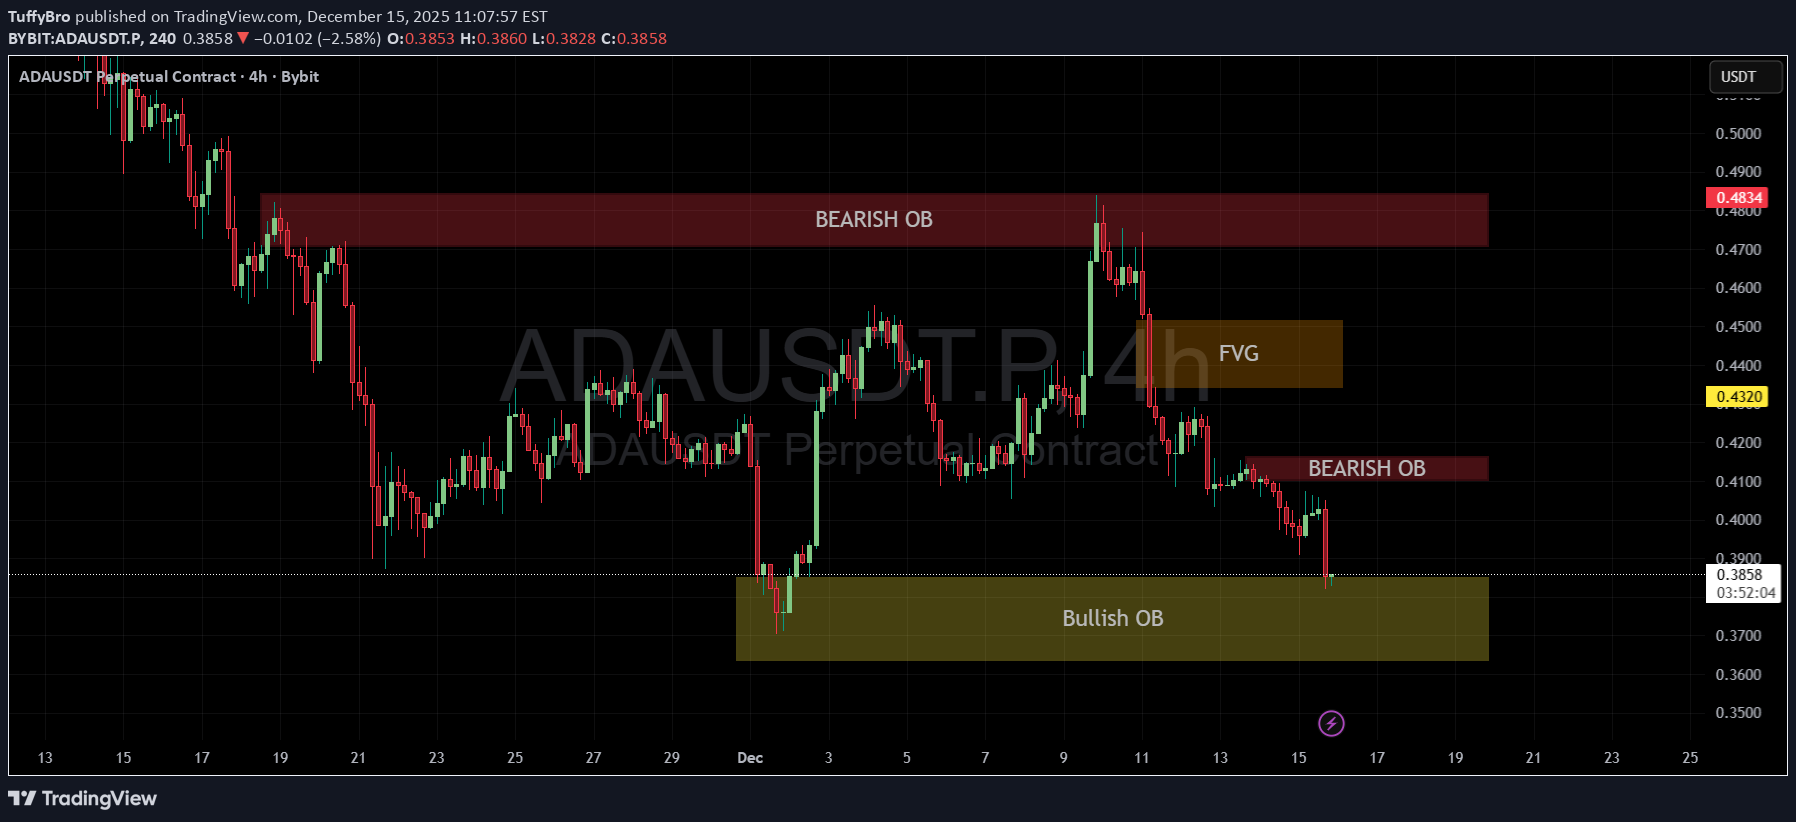
Cardano (ADA) is currently trapped in a clearly defined trading range, bouncing between institutional supply and demand zones. As shown on the chart, price action is respecting the "Order Block" (OB) levels perfectly, giving us a clear roadmap for the next few days. We are currently analyzing three critical areas of interest: THE BULLISH ORDER BLOCK (DEMAND ZONE) Zone. We are currently testing this zone. This represents the "Demand Floor" where buyers have historically stepped in aggressively. The Setup: Price has retraced fully into this block. We are looking for a reaction or a lower timeframe reversal pattern (like a break of structure on the 15m chart) to confirm that bulls are defending this level. The Trade: Long positions taken here offer a high Risk-to-Reward ratio because your invalidation point is very close (just below the box). THE FAIR VALUE GAP (FVG) - FIRST TARGET Zone Fair Value Gaps often act as magnets for price. If the Bullish OB holds, the first logical target is this imbalance. Expectation: Price is likely to be drawn up to fill this gap. This is a perfect area to take partial profits or move Stop Losses to breakeven. THE BEARISH ORDER BLOCK (SUPPLY ZONE) Zone: (The Red Box) This is the major resistance ceiling. The Strategy: This is the ultimate Take Profit zone for longs. Conversely, if price reaches this red box and shows rejection wicks, it becomes a high-probability SHORT entry to play the range back down. TRADING PLAN Scenario A: The Bounce (Bullish) Condition: Price holds above $0.3845 and creates a bullish candle close on the 4H. Action: Enter Long. Target 1: (FVG Fill). Target 2: (Bearish OB Test). Stop Loss: A daily close below $0.3638 invalidates the demand zone. Scenario B: The Breakdown (Bearish) Condition: If the Bullish OB fails and we get a confirmed close below $0.3630 Action: The setup is invalidated. We would then look for a retest of the broken level to go Short, targeting lower liquidity levels. SUMMARY The market is simple right now: We are at Support (Bullish OB). Until this level breaks, the bias at this specific price point is to look for Longs targeting the liquidity voids above (FVG). Are you buying the dip at this OB, or waiting for a breakdown? Let me know in the comments! Disclaimer: This analysis is for educational purposes only. Cryptocurrency trading involves high risk. Always manage your risk properly.taking tp
Smarttrader0786
SMC Trading Strategy ( #ADAUSDT ) Sell Trade Setup.
In this Analysis, we can see some Buy or sell Levels that I shared, watch it carefully, and Follow Price action. Thank
Disclaimer
Any content and materials included in Sahmeto's website and official communication channels are a compilation of personal opinions and analyses and are not binding. They do not constitute any recommendation for buying, selling, entering or exiting the stock market and cryptocurrency market. Also, all news and analyses included in the website and channels are merely republished information from official and unofficial domestic and foreign sources, and it is obvious that users of the said content are responsible for following up and ensuring the authenticity and accuracy of the materials. Therefore, while disclaiming responsibility, it is declared that the responsibility for any decision-making, action, and potential profit and loss in the capital market and cryptocurrency market lies with the trader.