
DomicChaina
@t_DomicChaina

What symbols does the trader recommend buying?
Purchase History
پیام های تریدر
Filter
چرا بیت کوین میماند و 90% آلتکوینها در برابر نابودی شکست میخورند؟
بعد أکثر من خمس سنوات من مراقبة سوق العملات الرقمیة، یظهر نمط واضح لا یمکن تجاهله: البیتکوین ینجو فی کل دورة، بینما تختفی معظم العملات البدیلة بعد أولى العواصف. هذا لیس انطباعًا شخصیًا، بل حقیقة یجب أن یدرکها أی مستثمر جاد. الاختلاف بین البیتکوین والعملات البدیلة فی الأصل والقیمة وقوة السوق هو ما یجعل BTC قادرًا على الاستمرار بینما تتلاشى معظم العملات البدیلة سریعًا. تم إنشاء البیتکوین بهدف أن یکون «الذهب الرقمی». عرضه ثابت عند 21 ملیون وحدة، یعمل بشکل لامرکزی، لا یخضع لأی جهة، ومعترف به عالمیًا کأصل آمن. فی المقابل، یتم إطلاق نحو 90٪ من العملات البدیلة بهدف جمع الأموال، أو لأغراض تسویقیة، أو لمجرد اتباع الاتجاهات. البیتکوین موجود لأنه یمتلک قیمة حقیقیة؛ أما العملات البدیلة فتقوم على توقعات مؤقتة. وعندما تختفی هذه التوقعات، تموت تلک العملات بینما یستمر البیتکوین بجذب الثقة ویزداد قوة. الاختلاف الآخر یکمن فی دورات السوق. البیتکوین یتبع دورة التنصیف کل أربع سنوات، ویتحرک عبر مراحل التجمیع، الارتفاع، التصحیح، ثم إعادة التجمیع. ومع کل دورة، ینجح BTC فی تجاوز قممه السابقة بفضل استقراره وتدفق رؤوس الأموال طویلة المدى. فی المقابل، تعیش العملات البدیلة دورة قصیرة: إطلاق، ضجة إعلامیة، ارتفاع سریع، هبوط حاد، ثم النسیان. معظمها لا یتجاوز المرحلة الأخیرة، بینما یستمر البیتکوین فی تسجیل قمم جدیدة. عامل رأس المال هو أیضًا عنصر حاسم. یتم تجمیع البیتکوین بواسطة صنادیق ETF، البنوک الکبرى، المؤسسات المالیة، بعض الدول مثل السلفادور، وشرکات ضخمة مثل MicroStrategy. هذا رأس مال طویل الأجل قادر على تحمل تقلبات السوق. أما العملات البدیلة فتعتمد غالبًا على المضاربین قصیری المدى، أو تجار التجزئة تحت تأثیر FOMO، أو الحملات التسویقیة، مما یجعلها شدیدة التقلب عند خروج السیولة. هیکل التوکن هو فارق آخر. العدید من العملات البدیلة تدمر قیمتها بنفسها عبر فتحات مبکرة، حصص کبیرة للفریق، تضخم مرتفع، وغیاب الطلب الحقیقی. بینما یتمیز البیتکوین بعرض ثابت، وعدم قدرة أی جهة على سک المزید، ویقل المعروض مع کل عملیة تنصیف. هذا النقص المتزاید یوفر درعًا لقیمته ویجعله أصلًا قادرًا على البقاء. والفرق الأکبر یکمن فی الدور. البیتکوین هو المعیار والعمود الفقری للسوق؛ أما العملات البدیلة فهی «منتجات تجریبیة». عندما یرتفع البیتکوین، تنشط العملات البدیلة؛ وعندما یتماسک البیتکوین، قد ترتفع العملات البدیلة؛ وعندما ینهار البیتکوین، تنهار العملات البدیلة أسرع وأقوى. هذا یعکس حقیقة أن البیتکوین أصل حقیقی، بینما العملات البدیلة منتجات قابلة للاستبدال وقد تفشل فی أی لحظة. الاستثمار الذکی یبدأ بفهم هذه الفروقات. البیتکوین ینجو لأنه مبنی على الثقة والبنیة الاقتصادیة والقیمة الحقیقیة، بینما تعیش العملات البدیلة على التوقعات والتسویق ورأس المال قصیر الأجل. إذا أردت الاستمرار فی سوق الکریبتو على المدى الطویل، یجب أن تعامل البیتکوین کرکیزة أساسیة، وأن ترى العملات البدیلة کفرص عالیة المخاطر قصیرة الأجل. عندما تفهم هذه القاعدة، ستتجنب مشاریع "الوهم" والعملات التی لا تعود أبدًا إلى قممها.
چرا بیت کوین میماند و ۹۰٪ آلتکوینها محکوم به فنا هستند؟

Over more than five years of observing the crypto market, one clear pattern stands out: Bitcoin survives every cycle, while most altcoins only last a few storms before vanishing. This is not a subjective impression but a reality that any serious investor must understand. Bitcoin and altcoins differ in origin, value, and market strength, and these differences are what allow BTC to endure while most altcoins fade away early. Bitcoin was created with the mission of becoming “digital gold.” It has a fixed supply of 21 million, operates in a decentralized manner, is not controlled by any single organization, and is widely accepted as a global asset. In contrast, around 90% of altcoins are launched primarily to raise capital, for marketing purposes, or to chase technological trends. Bitcoin exists because of real value; altcoins exist on temporary expectations. When these expectations fade, altcoins die, while trust in BTC grows, allowing Bitcoin to continue evolving and remain a cornerstone of the market. Another distinction lies in cycles. Bitcoin follows a four-year halving cycle, moving through stages of accumulation, boom, correction, and re-accumulation. BTC consistently surpasses previous highs thanks to its stable cycle and long-term capital, which ensures enduring vitality. Altcoins, however, often experience a short life cycle: launch, hype, pump, dump, and eventual oblivion. Most altcoins stop at the final stage and never return to previous peaks, while Bitcoin always finds a way to reach new highs, demonstrating superior resilience. Capital backing is also a decisive factor. Bitcoin is accumulated by ETFs, major banks, financial institutions, certain countries like El Salvador, and large corporations such as MicroStrategy. This represents long-term, sustainable capital capable of withstanding market fluctuations. Altcoins, on the other hand, rely mainly on short-term traders, retail FOMO, or social media marketing, making their prices highly volatile when capital exits. Thanks to stable institutional flows, Bitcoin is continuously accumulated and is rarely at risk of “dying” in any cycle. Token structure creates another clear difference. Altcoins often undermine their own value through tokenomics: early unlocks, large team allocations, high inflation, and weak real demand. Bitcoin is entirely different: fixed supply, no one can mint more, and halving reduces supply over time. This increasing scarcity acts as a shield for its value, explaining why Bitcoin endures over time. The biggest distinction also lies in the role of each type of currency. Bitcoin serves as the standard and backbone of the market; altcoins are merely “experimental products.” When BTC rises, altcoins revive; when BTC moves sideways, altcoins pump along with the flow; when BTC drops sharply, altcoins crash the hardest. This is a crucial reason for investors to understand that Bitcoin is a real asset, whereas altcoins are interchangeable products that can fail at any time. Smart investing starts with understanding this difference. Bitcoin survives because of trust, economic structure, and real value, while altcoins exist on expectations, marketing, and short-term capital. To thrive long-term in the crypto market, you should treat Bitcoin as a foundational, enduring pillar and view altcoins as short-term, high-risk opportunities. Once you grasp this rule, you will avoid being swept into “moonshot” projects or holding altcoins that never return to previous highs, and instead invest with strategic vision rather than emotion.
سولانا (SOL): توقف صعود بزرگ و منطقه سرنوشتساز پیش رو!
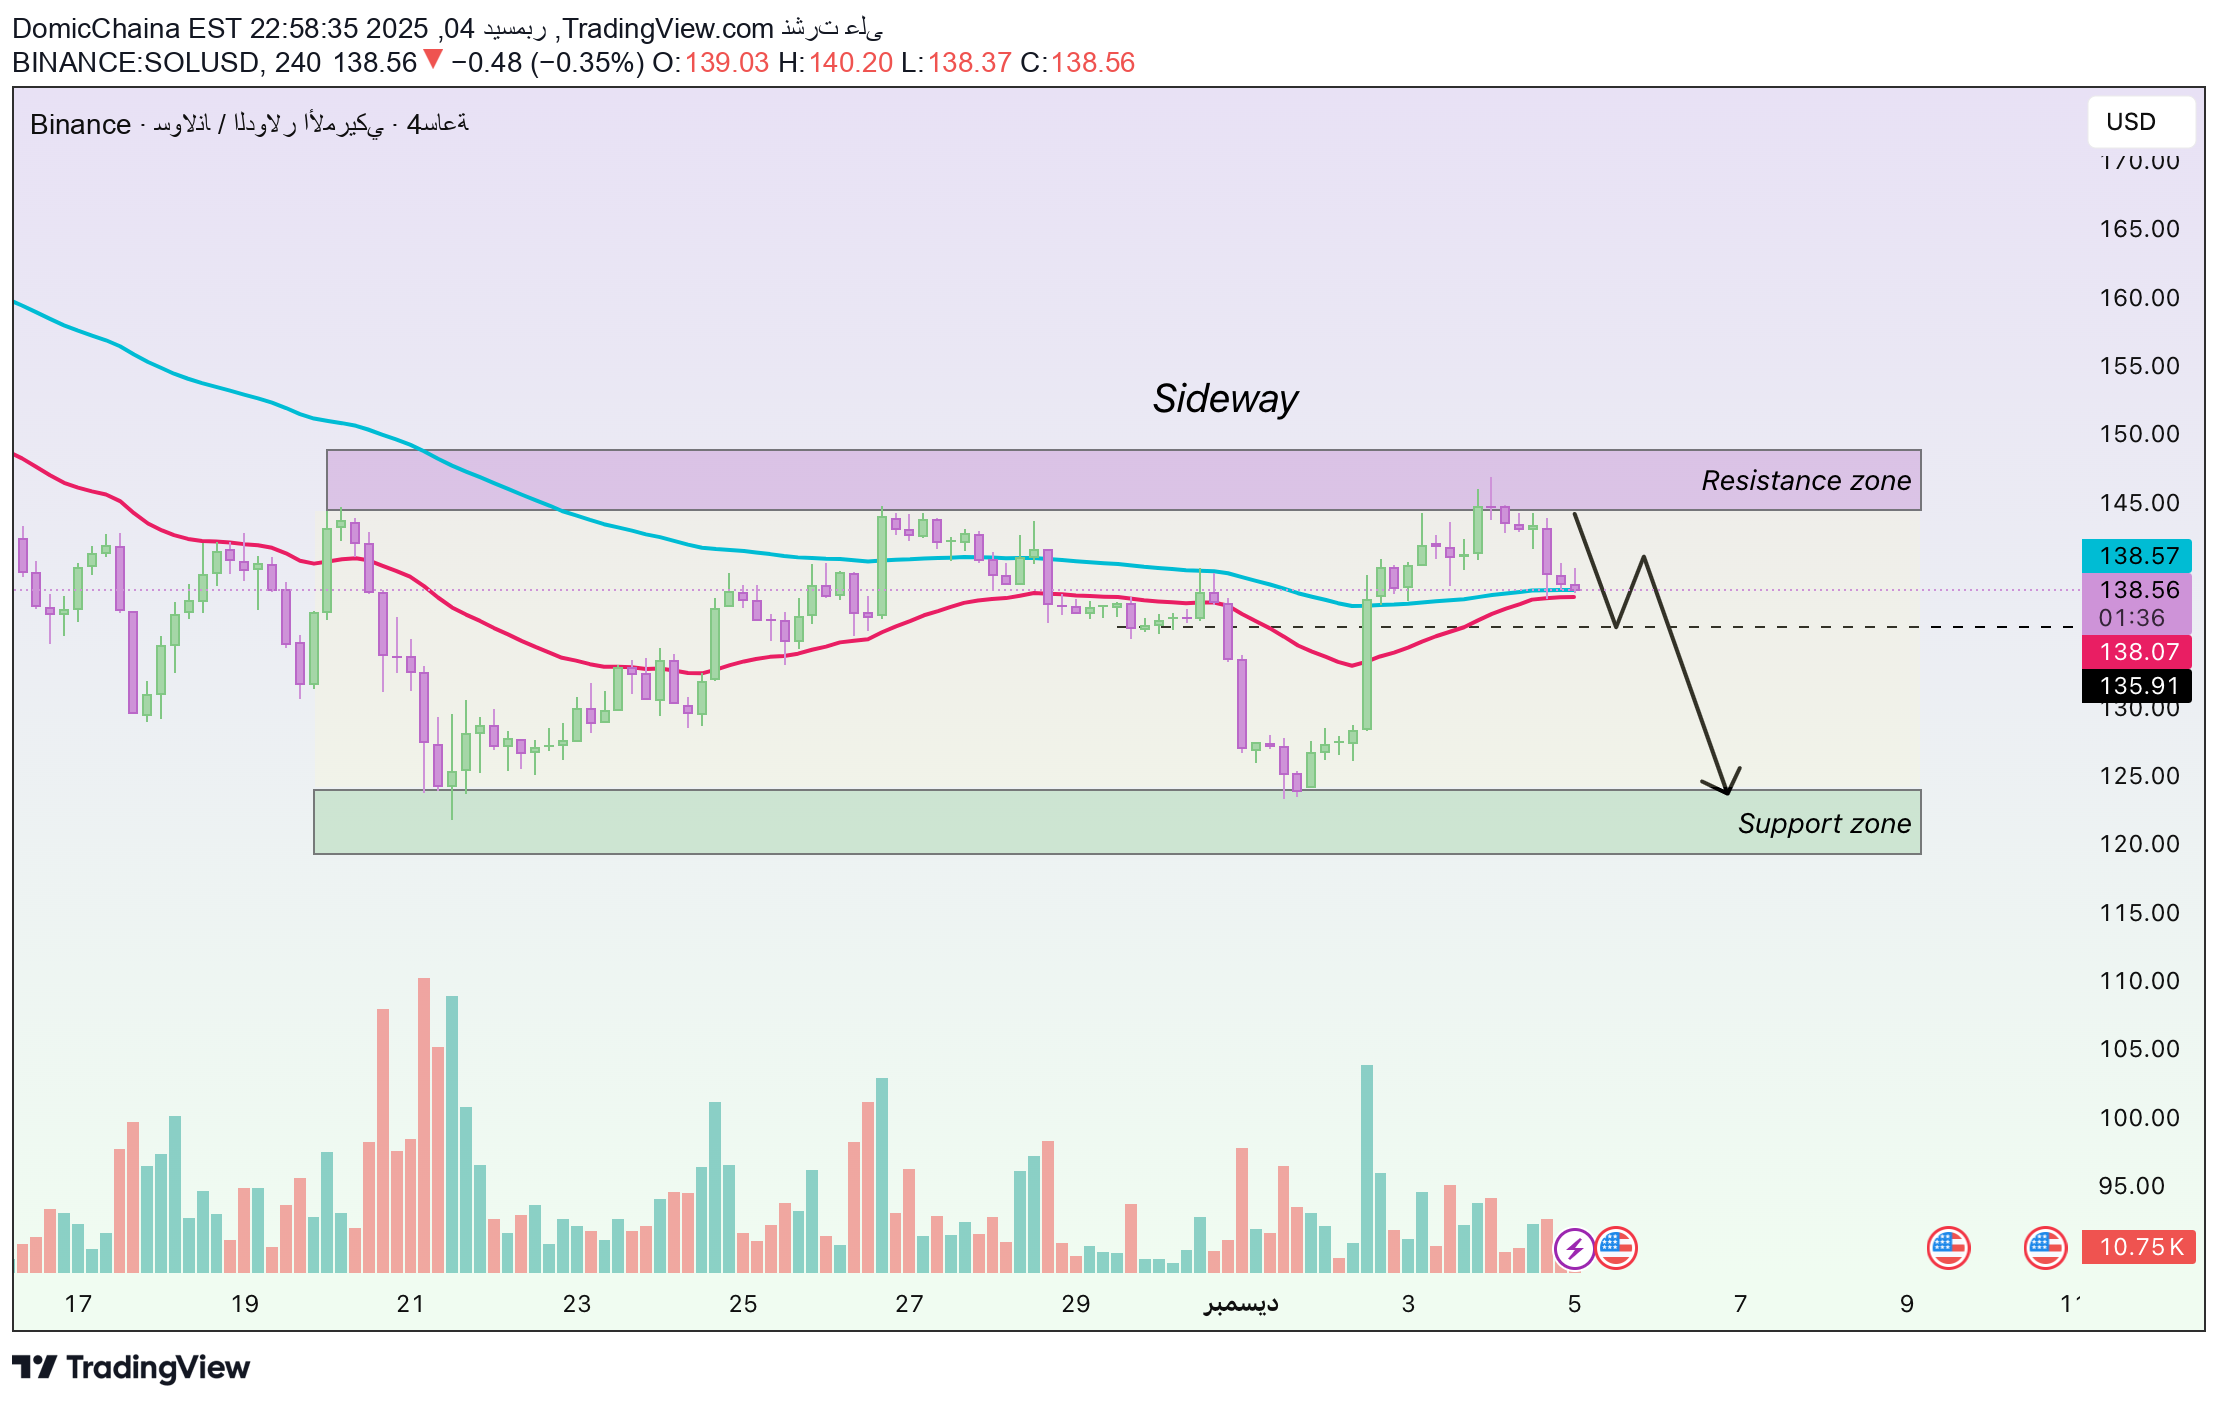
شهدت SOL ارتفاعًا ملحوظًا خلال عطلة نهایة الأسبوع، ومع ذلک فقد ضعف الزخم الحالی بشکل واضح عندما وصل السعر إلى EMA 89 (أزرق)، وهی منطقة شهدت سابقًا ضغوط بیع قویة خلال الشهر الماضی. بعد الارتفاع حول مستوى 145 دولارًا، عاد SOL لاختبار EMA 34 (أحمر) وEMA 89، مکونًا منطقة تقارب مهمة لتحدید الاتجاه القادم. تُظهر الشموع الأخیرة ظلالًا علویة طویلة وحجم تداول منخفض، مما یشیر إلى ضعف المشترین مقارنة بالاختراق السابق وزیادة ضغوط جنی الأرباح. لا تزال بنیة السوق لا تؤکد الاتجاه الصعودی: فقد اخترق SOL القمم المحلیة بشکل طفیف فقط دون تکوین higher-high واضح، وهو ما یفسر الرفض عند EMA 89. من منظور الاقتصاد الکلی وتدفقات السیولة، شهد نظام سولانا البیئی تعافیًا إیجابیًا خلال آخر 48 ساعة، حیث ارتفعت بعض مشاریع DeFi وعملة المیمکوین. ومع ذلک، توقفت تدفقات رأس المال نحو العملات البدیلة بینما ینتظر المستثمرون إشارات من الفیدرالی الأمریکی وبیانات الاقتصاد الأمریکی. یتجه بیتکوین حالیًا بشکل جانبی، مما یعنی أن الدفع الأساسی للسوق نحو العملات البدیلة، بما فی ذلک SOL، غیر کافٍ لتولید اختراق جدید. وحتى الأخبار الإیجابیة لا تزال غیر کافیة لتشکیل اتجاه جدید فی الوقت الحالی.
سولانا (SOL) در دوراهی حساس: خریداران کم آوردند؟ آینده قیمت چه میشود؟
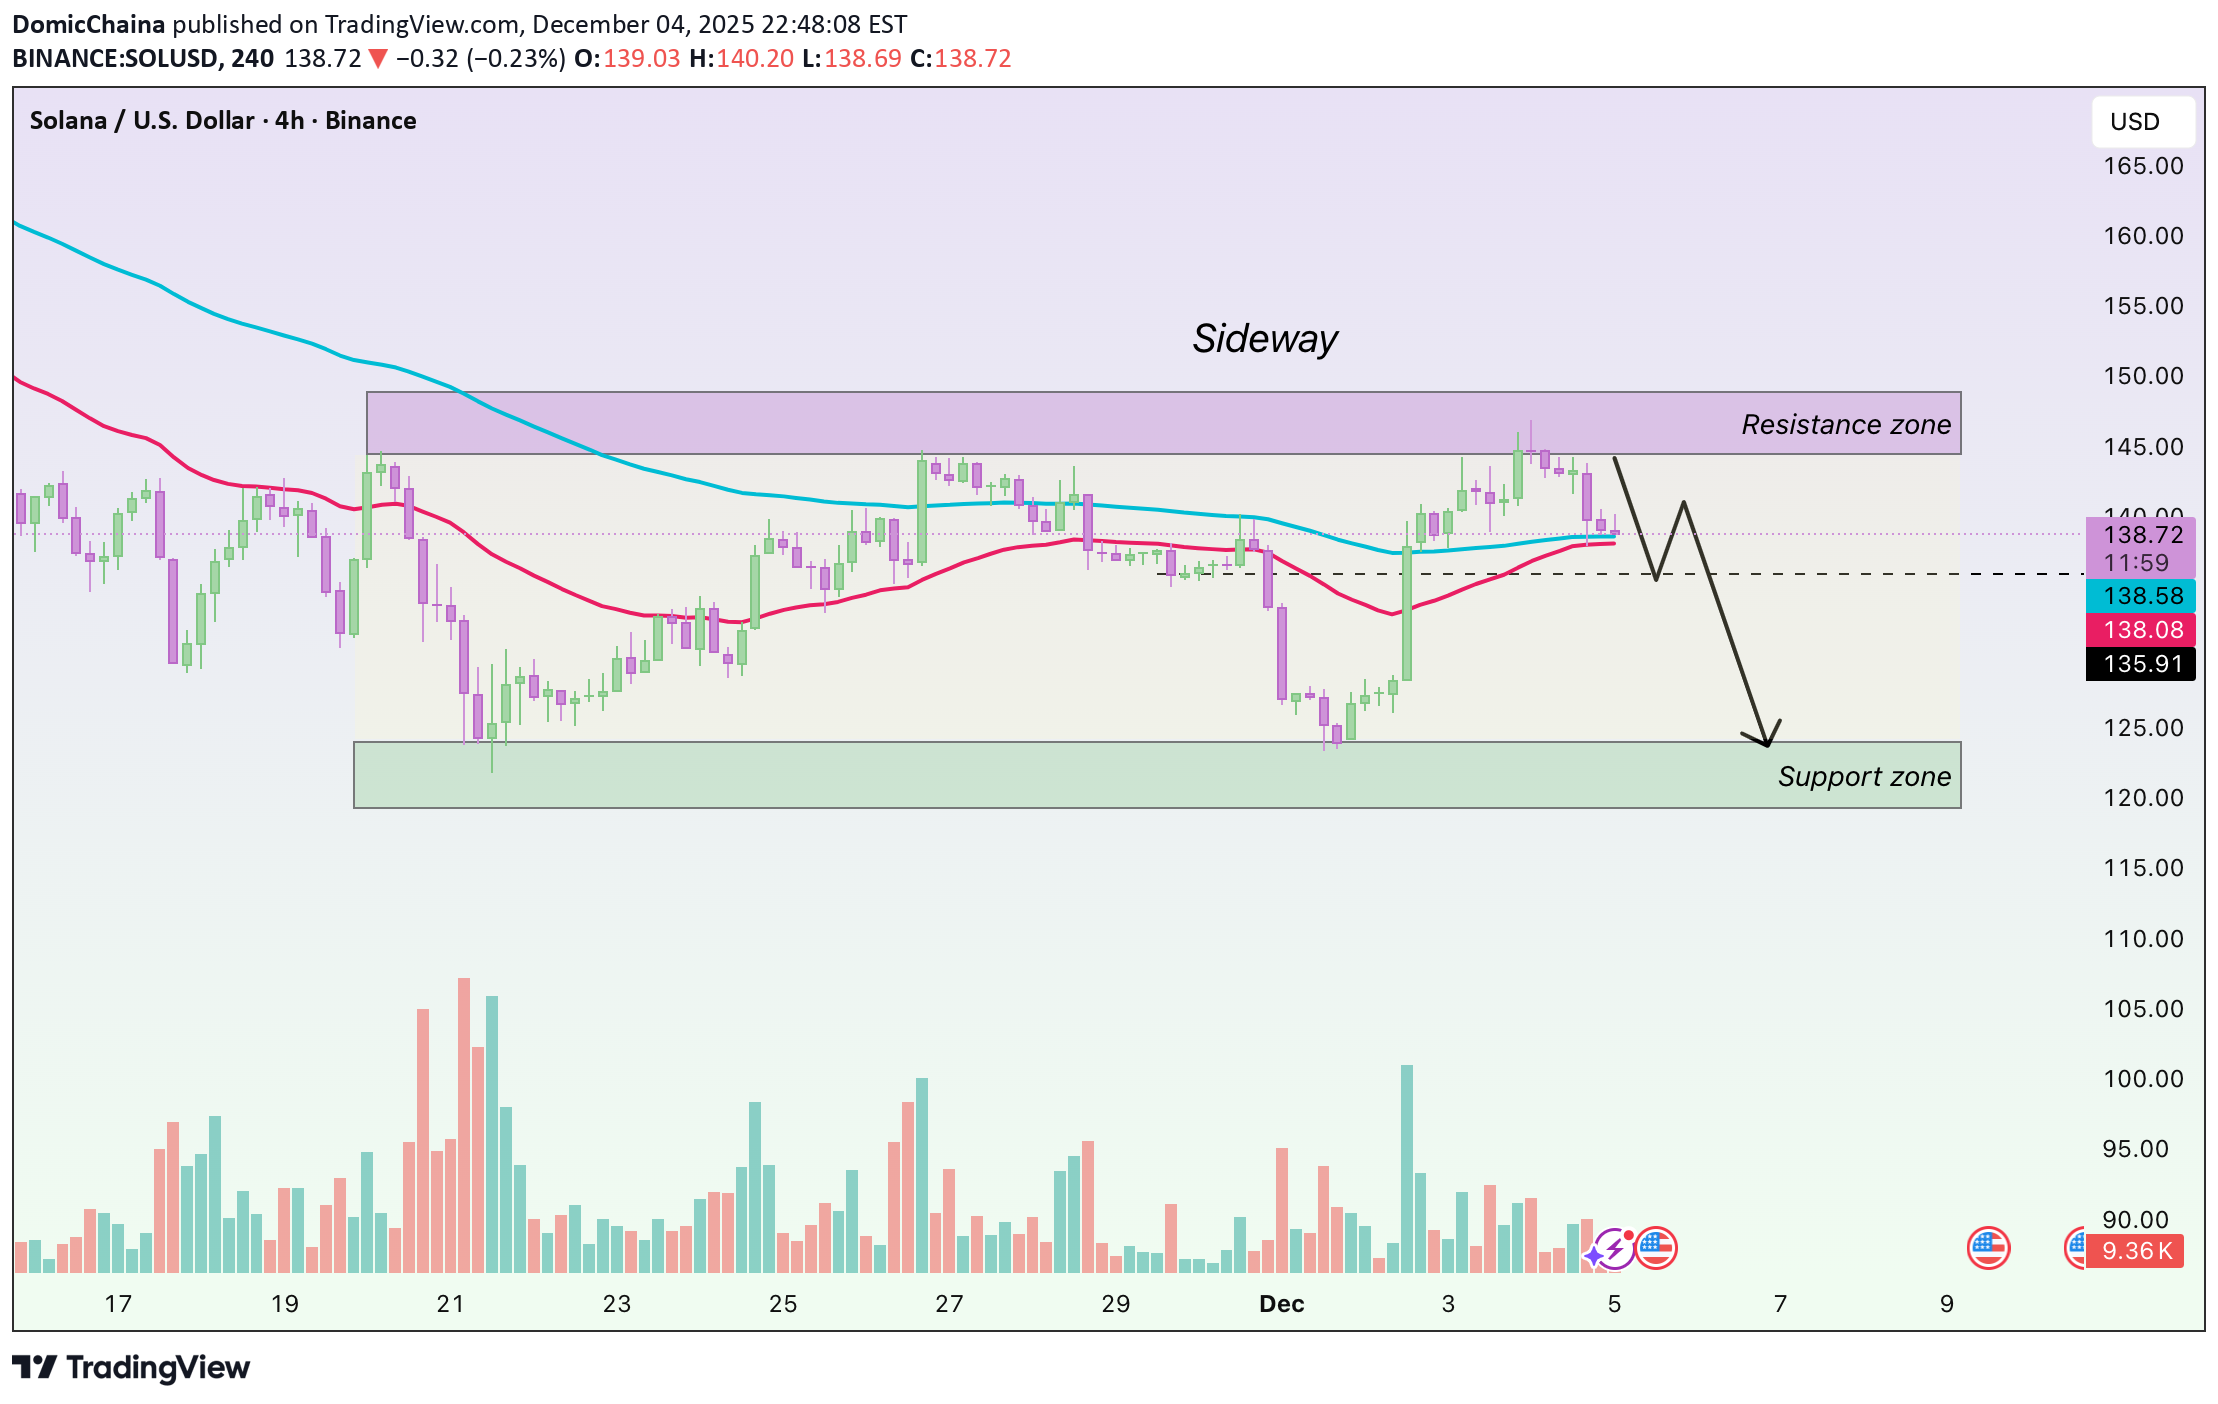
Hello everyone, SOL experienced an impressive upward move over the past weekend, but the current momentum has noticeably weakened as the price hits the EMA 89 (blue), an area that has previously created strong selling pressure last month. After bouncing around the 145 USD mark, SOL retraced to test both EMA 34 (red) and EMA 89, forming a critical convergence zone to determine the next direction. Recent candles show long upper wicks accompanied by decreasing volume, indicating that buyers are losing strength compared to the previous breakout while profit-taking pressure is rising. The market structure has yet to confirm an uptrend, as SOL has only slightly broken local highs without forming a clear higher-high, explaining why the price was rejected at EMA 89. From a macro and capital flow perspective, over the past 48 hours, the Solana ecosystem has shown a positive recovery, with several DeFi projects and memecoins rallying. However, capital inflows into altcoins have paused as investors await updates from the Fed and US economic data. Bitcoin is currently moving sideways, meaning the primary market momentum supporting altcoins, including SOL, is insufficient to drive a breakout. Therefore, even positive news is not yet strong enough to establish a new trend. Wishing everyone successful trading!
بیت کوین در دام نزولی: آیا این جهش موقتی است یا شروع مقاومت؟
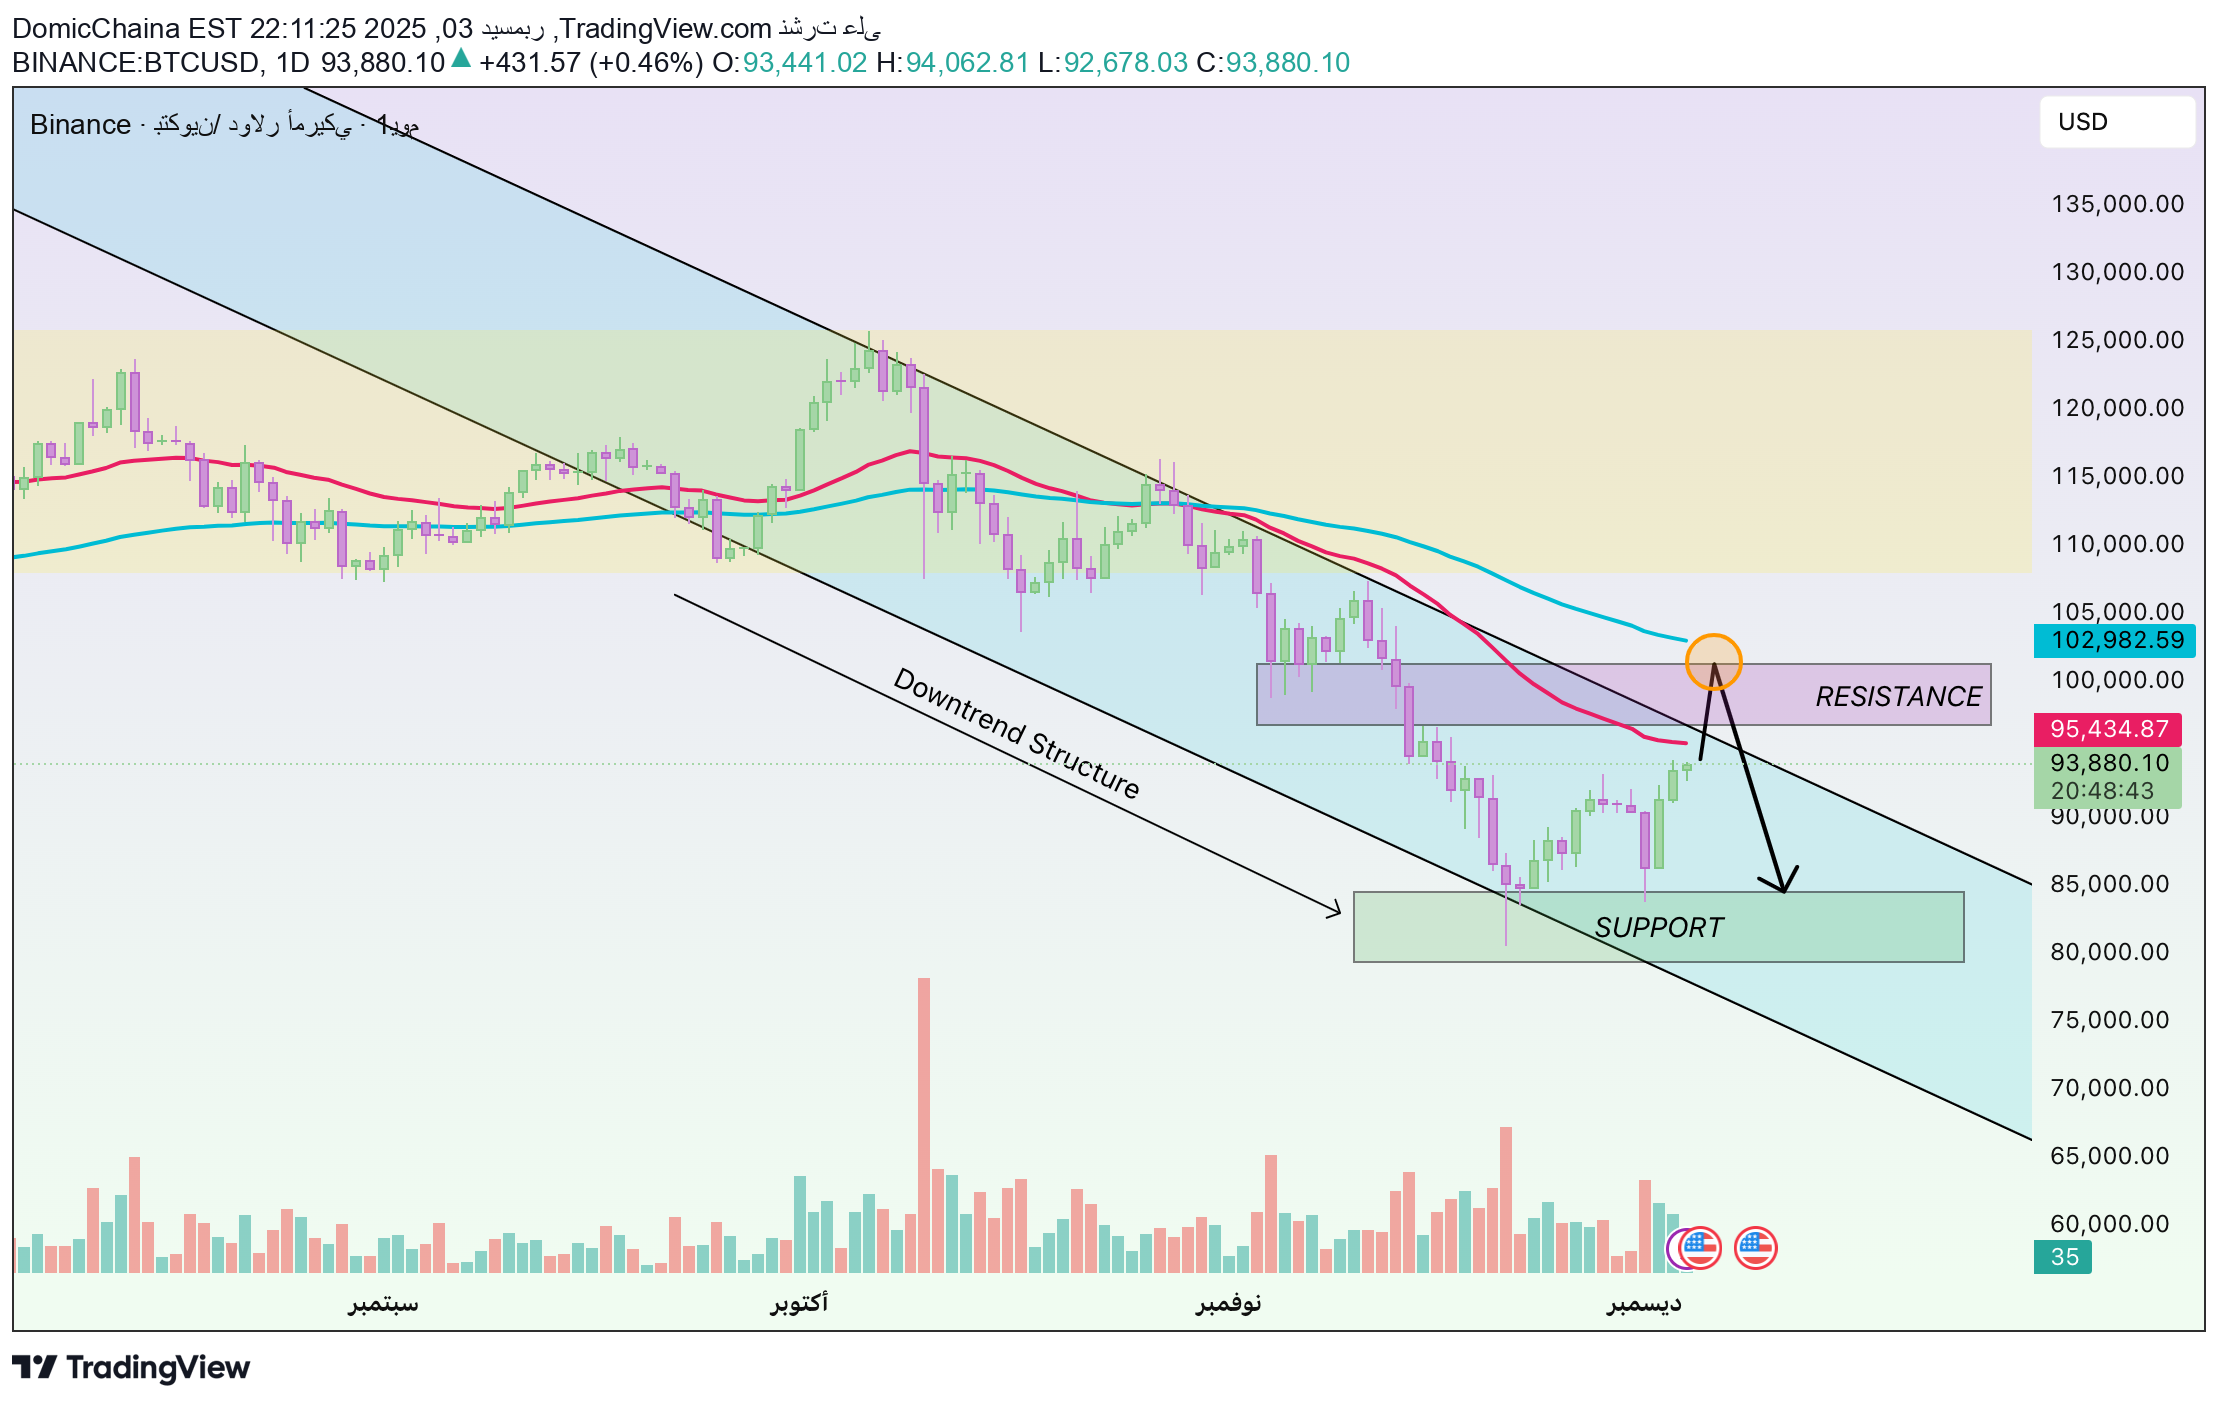
مرحباً بالجمیع، معکم دومیک. على الإطار الزمنی الیومی، یتحرک البیتکوین ضمن إیقاع نموذجی لاتجاه هابط: قمم أدنى، قیعان أدنى، وکلا المتوسطین المتحرکین EMA 34 و EMA 89 یمیلان بوضوح نحو الأسفل. الارتداد الحالی یبدو کحرکة تعافٍ بعد موجة بیع قویة، ولیس إشارة حقیقیة لانعکاس الاتجاه. السعر عاد فقط لاختبار EMA 34 فی منطقة 93,000–95,000، بینما EMA 89 لا یزال أعلى بکثیر، مما یشیر إلى أن أمام BTC عدة حواجز مهمة. بعد تکوین قاع فی منطقة 82,000–85,000، سجّل السوق سلسلة شموع صاعدة قویة بأحجام متزایدة مقارنة بمرحلة الهبوط السابقة. ولکن مع اقتراب السعر من EMA 34 بدأت الفتائل العلویة بالظهور بشکل أکبر — وهو نمط معروف لعملیات جنی الأرباح. هذه المنطقة کانت سابقاً دعماً قویاً قبل کسره، وهی الآن تعمل کمقاومة، لذلک عودة البائعین هی أمر طبیعی. فقط اختراق واضح لمستوى 95,000–96,000 مع إغلاق یومی قوی فوقه لعدة جلسات قد یفتح المجال نحو تعافٍ أعمق باتجاه EMA 89. حالیاً، أرجّح سیناریو مواجهة BTC صعوبة بین 93,500–95,500 مع احتمال هبوط نحو منطقة 88,000–90,000 لاختبار قوة المشترین. إذا حافظت هذه المنطقة على تماسکها وحققت قاعاً أعلى مقارنة بـ 82,000–85,000، عندها یمکن الحدیث فعلاً عن تعافٍ صاعد. لماذا لا أمیل بعد إلى استمرار الصعود؟ هناک أربع إشارات تقنیة واضحة: الاتجاه العام ما یزال هابطاً، السعر یختبر المقاومة بدلاً من اختراقها، أحجام الصعود ضعیفة جداً، ومنطقة 93k–95k ملیئة بالمتداولین العالقین الذین ینتظرون الخروج من صفقاتهم. کل هذه العوامل تشکل حاجزاً ثقیلاً قد یضعف BTC فور ملامسته. أتمنى للجمیع تداولاً آمناً وواضحاً خلال هذه الفترة المتقلبة!
هشدار جدی بیت کوین: آیا بازگشت فنی به مقاومت، پایان روند نزولی نیست؟
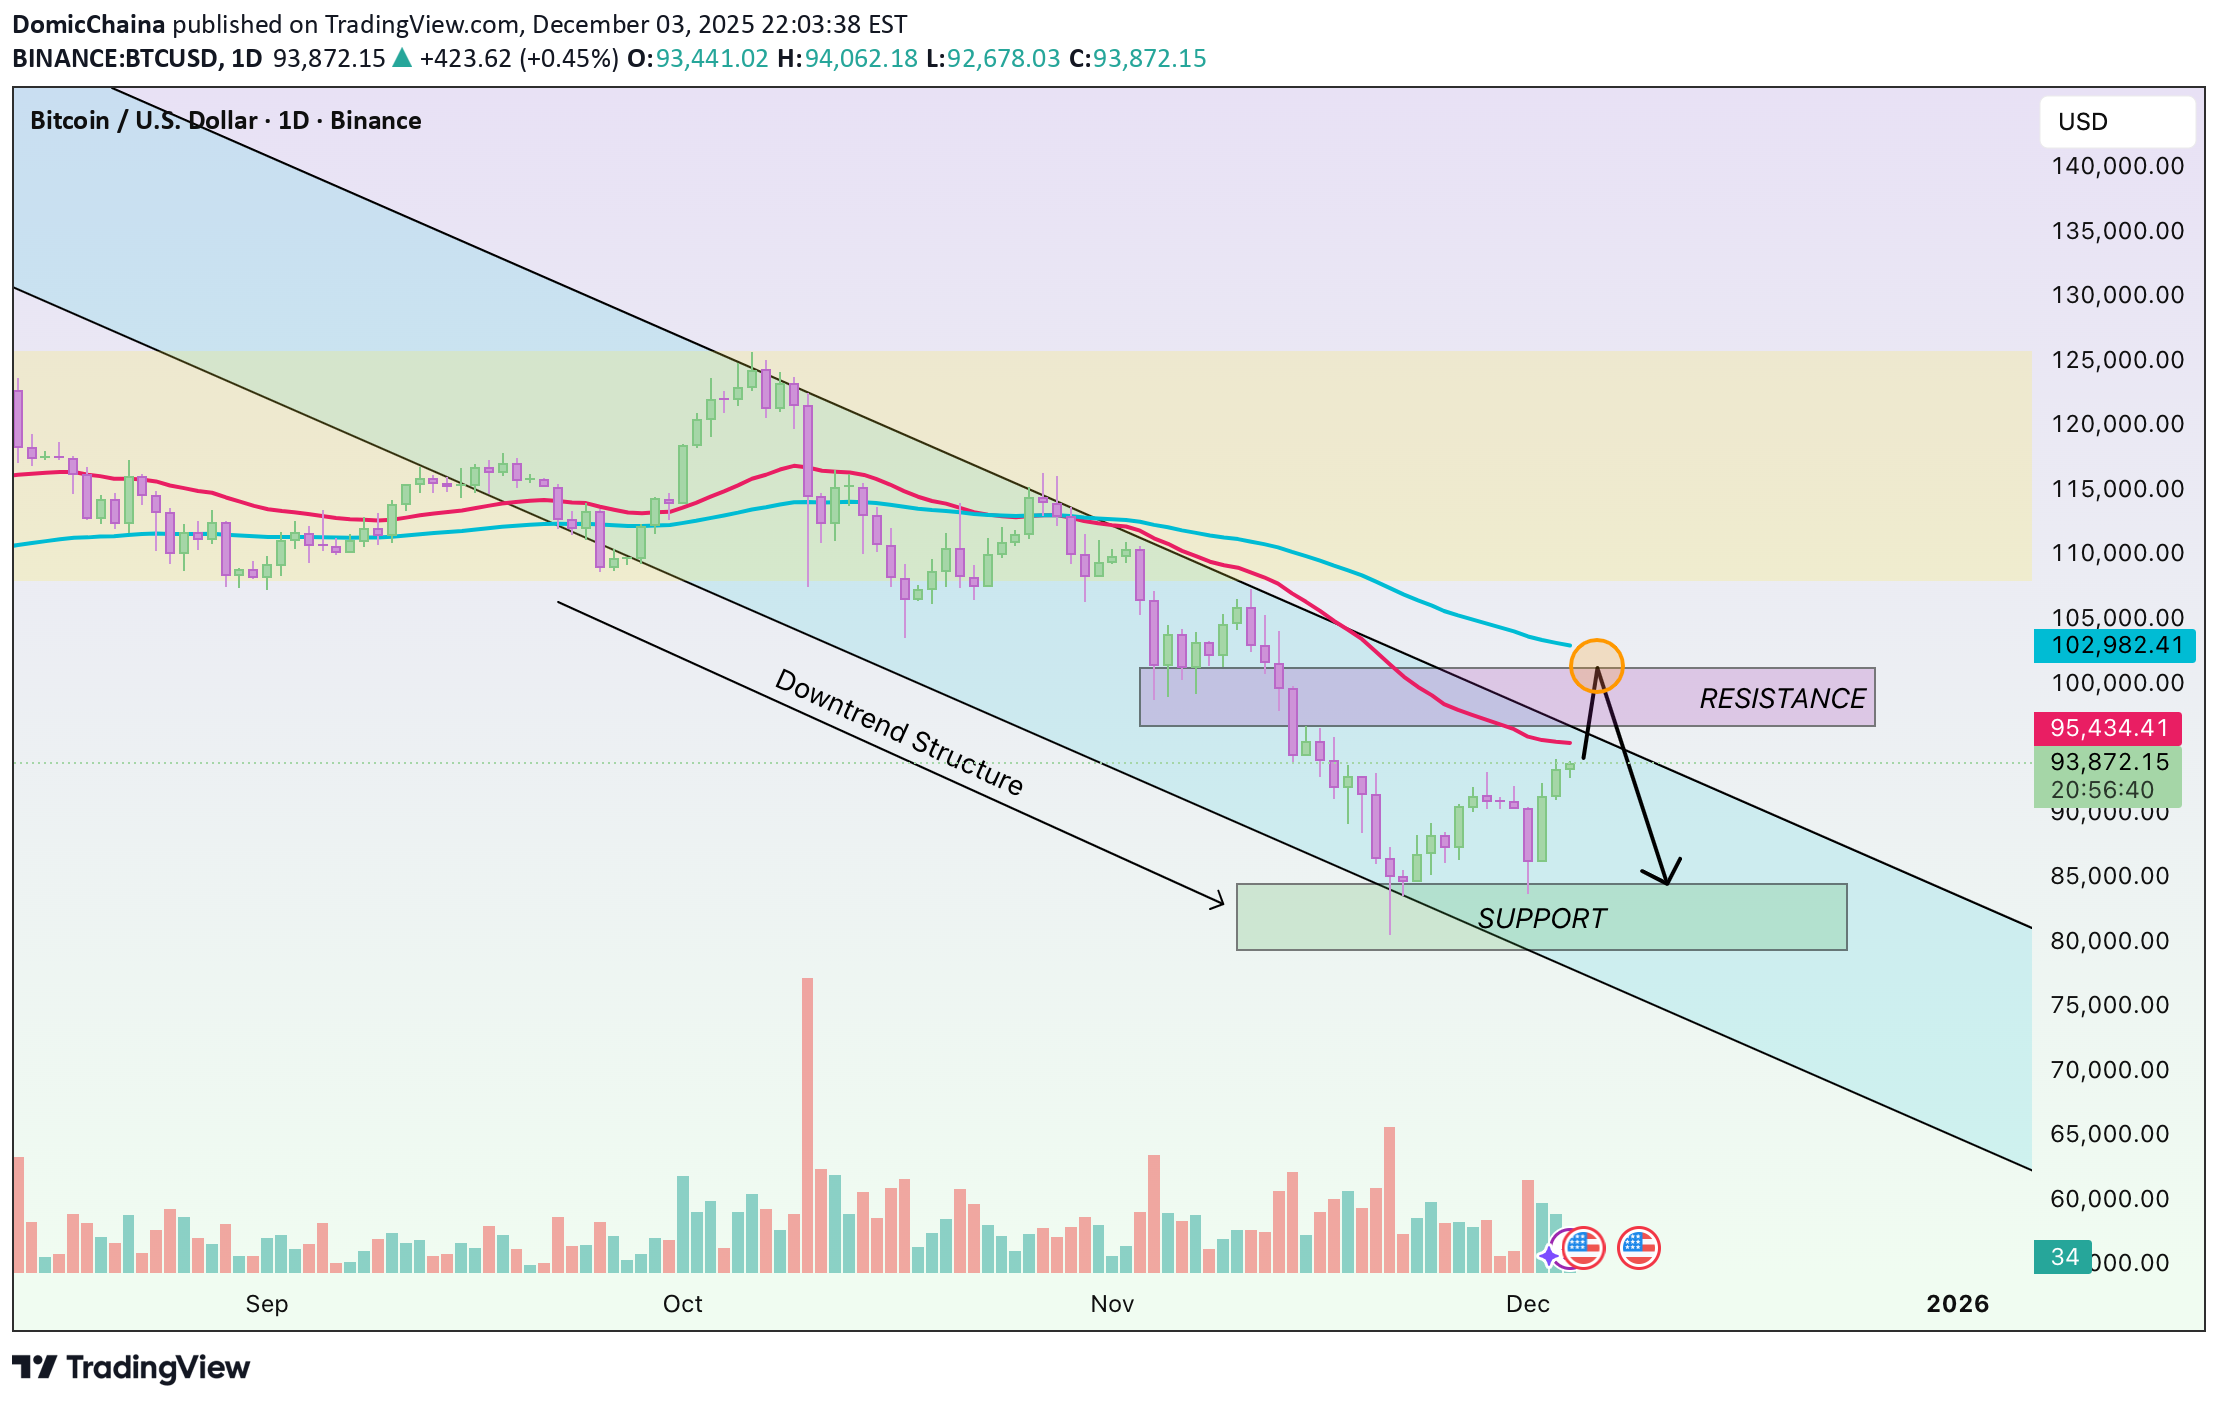
Hello everyone, this is Domic. On the daily timeframe, BTC is moving in a very typical rhythm of a downtrend: lower highs, lower lows, and both the EMA 34 and EMA 89 clearly sloping downward. The current bounce looks more like a recovery after a heavy sell-off than a genuine reversal signal. Price has just retraced toward the EMA 34 around 93,000–95,000, while the EMA 89 remains far above, suggesting BTC still has several barriers ahead. After forming a bottom in the 82,000–85,000 region, the market printed a clean series of bullish candles, with expanding bodies and improving volume compared to the previous dump. But as price approaches the EMA 34, upper wicks have started to appear more frequently — a familiar sign of profit-taking pressure. This area also acted as strong support before it was broken, and now serves as resistance, making the return of sellers unsurprising. Only if BTC breaks above 95,000–96,000 with a strong D1 candle and holds above this zone for several sessions can we expect a deeper recovery toward the EMA 89. At the moment, I lean toward the scenario where BTC struggles around 93,500–95,500 and potentially pulls back to the 88,000–90,000 region to test buying strength. If this area holds and forms a higher low compared to 82,000–85,000, then the recovery would be worth discussing. Why am I not leaning toward continued upside yet? Four technical reasons stand out: the broader trend is still down, price is touching resistance rather than breaking it, the rebound volume is too weak, and the 93k–95k area is filled with trapped traders waiting to exit. Combined, these factors create a heavy barrier that could easily weaken BTC as soon as it touches this zone. Wishing everyone safe and clear-headed trading in this volatile period!
تحليل إيثريوم (ETH/USDT): ارتداد تقني أم طلوع جديد؟ مفتاح السر عند 3150 دولار
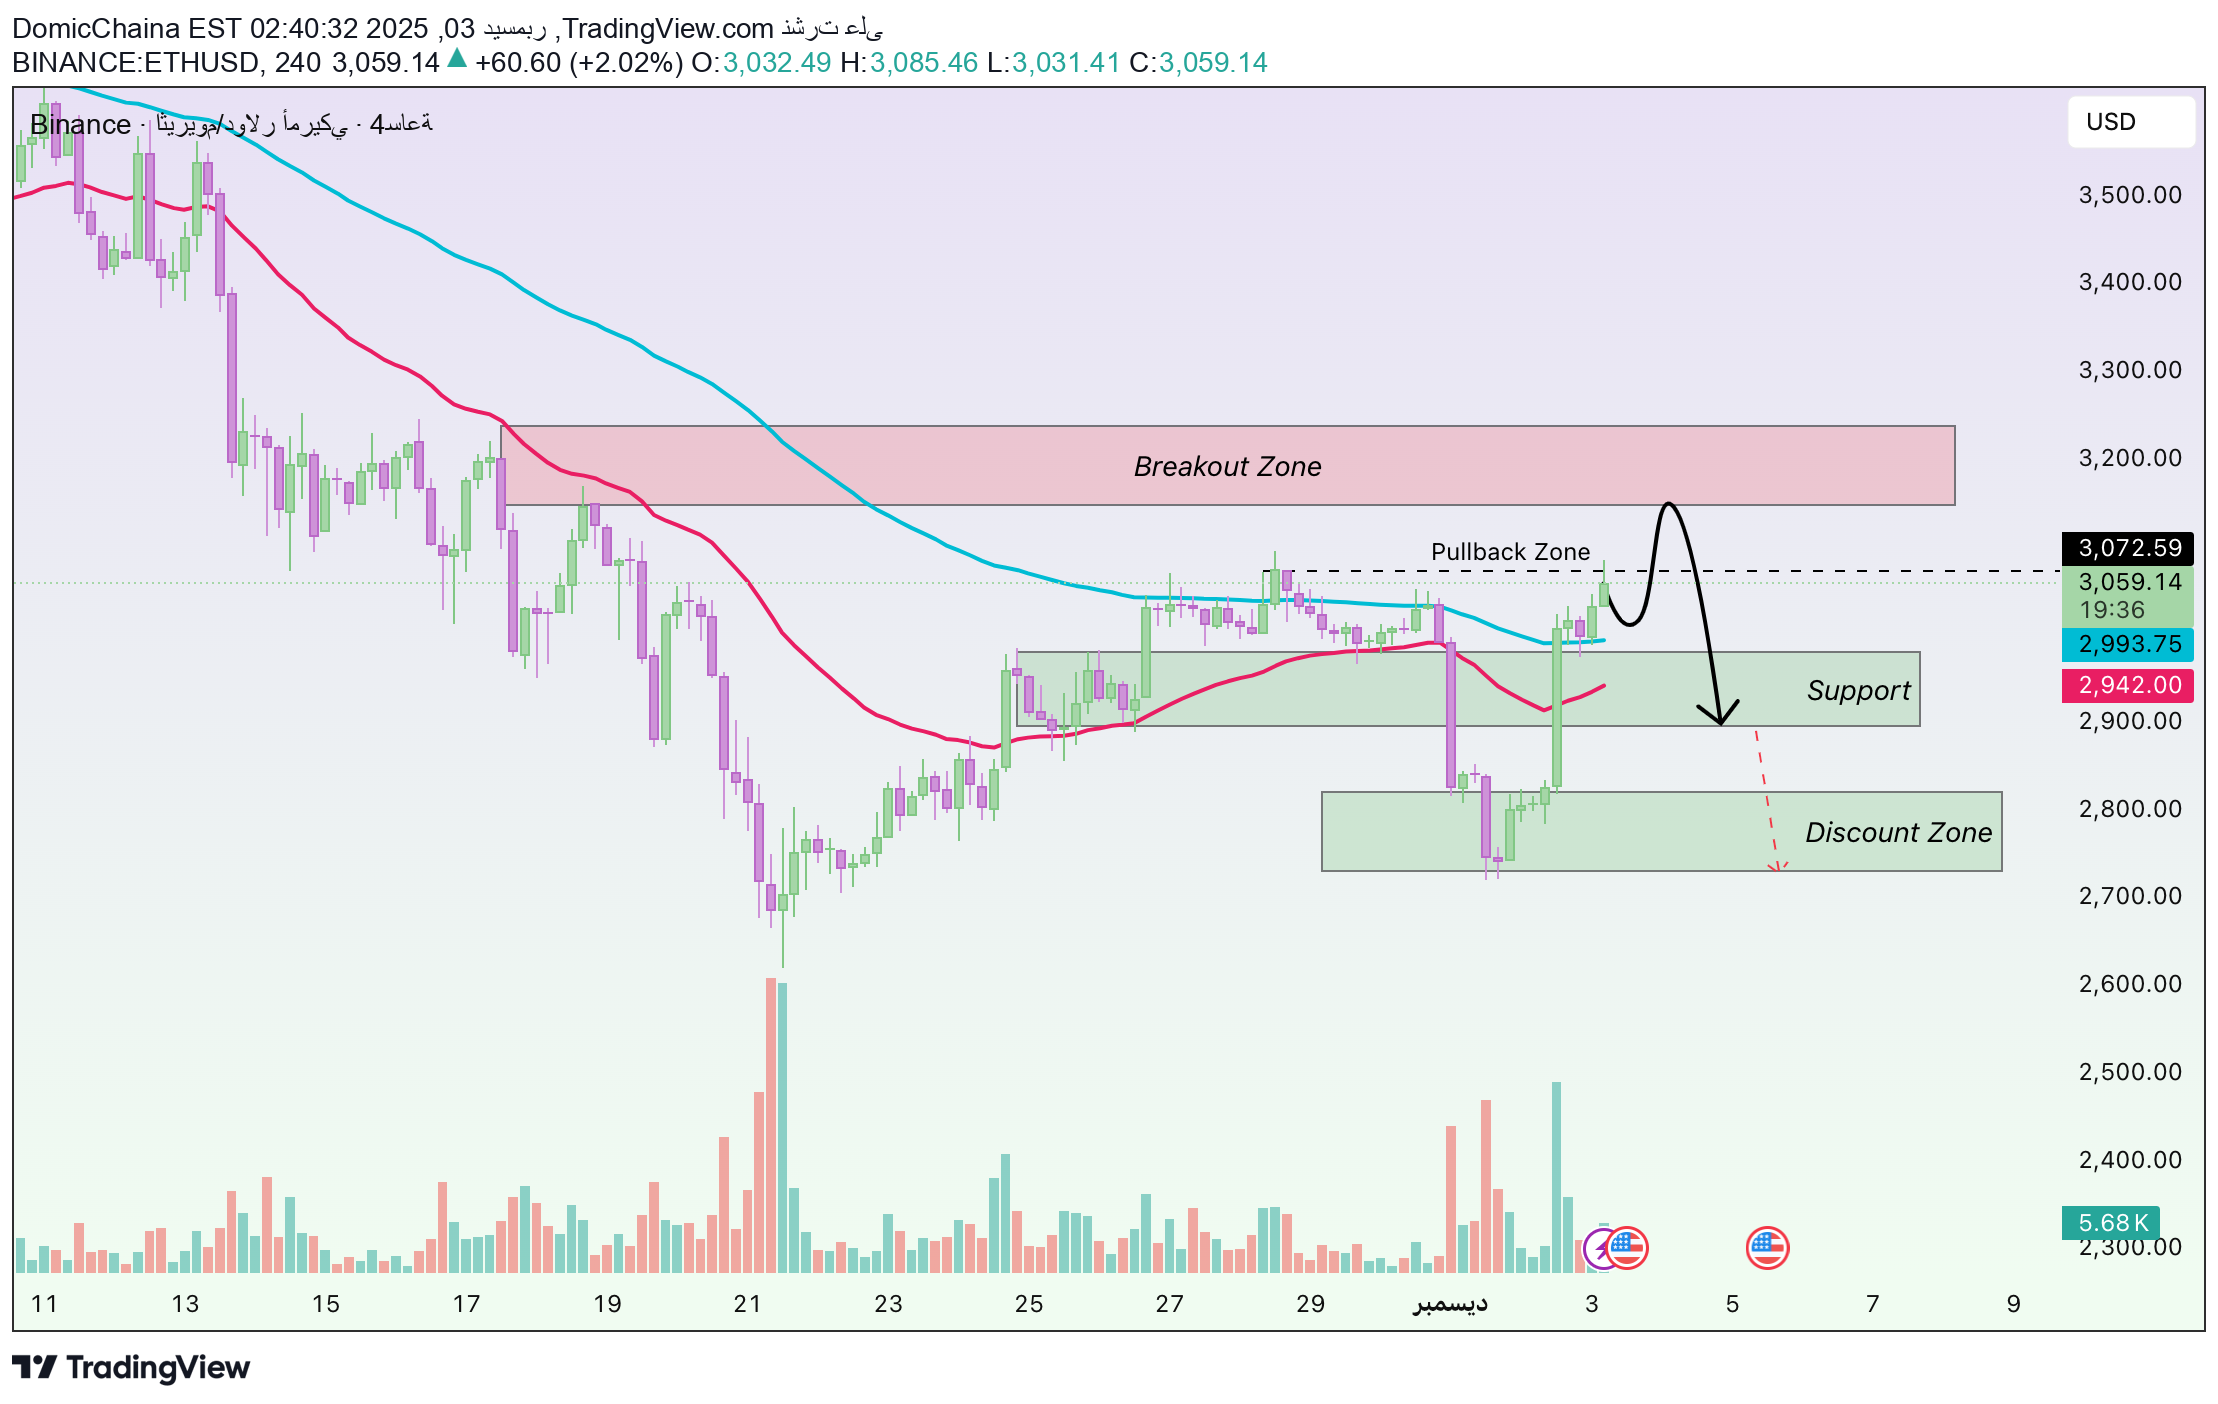
ETHUSDT – ارتداد تقنی أم بدایة موجة صعودیة جدیدة؟ مرحباً بالجمیع، لقد ارتدّ ETH مؤخراً — لکن هل یمثل هذا بدایة موجة صعود جدیدة، أم أنه مجرد ارتداد تقنی قبل أن یحدد السوق اتجاهه الحقیقی؟ دعونا نحلّل معاً! شهد ETH هبوطاً حاداً من 3,150 إلى 2,780، مسح السیولة فی الأسفل ودفع السوق إلى “إعادة ضبط” تقنیة. الشمعة الهابطة الطویلة المصحوبة بحجم تداول مرتفع تشیر إلى عملیة بیع حقیقیة، ولکن مباشرة بعد ذلک، انعکس السعر صعوداً ویتداول الآن حول 3,050، ضاغطاً على المتوسط EMA 89 بینما یبدأ المتوسط EMA 34 بالالتفاف صعوداً. هذا الارتداد هو فی جوهره ارتداد تقنی داخل اتجاه هابط أوسع — حیث یحاول السعر إعادة التوازن حول المتوسطات بعد الهبوط العمیق. ارتفع الحجم قلیلاً، لکن لا یوجد أی FOMO حقیقی بعد؛ ما یحدث هو تغطیة مراکز البیع وظهور بعض المشترین الأوائل. هیکل السوق ما یزال هابطاً: قمم أدنى، قیعان أدنى، میل هابط لـ EMA 89، کما أن ETH لم یحقق إغلاقاً قویاً فوق 3,100–3,150 على إطار 4 ساعات. ومع ذلک، فإن هذا الارتداد یعتمد على عدة عوامل إیجابیة: توقعات لهجة أکثر مرونة من الفیدرالی، تعافی طفیف للبیتکوین مما سحب العملات البدیلة معه، إضافة إلى أن السرد الطویل المدى لإیثریوم ما یزال یجذب المستثمرین — مما یجعل منطقة 2,800 “منطقة خصم” للتجمیع التدریجی. رغم ذلک، فالارتداد لیس قویاً بما یکفی لتأکید بدایة اتجاه صاعد جدید. وجهة نظری الشخصیة: من المحتمل أن یواصل ETH الارتفاع نحو منطقة 3,080–3,120 — وهی منطقة التقاء EMA 89 مع قمم سابقة ومنطقة عرض سابقة. إذا ظهر ضغط بیع — مثل شموع ذات ذیول علویة أو زیادة فی الحجم — قد یواجه ETH رفضاً ویعود للهبوط. مناطق الدعم التی أراقبها هی 2,950–2,900، والمنطقة الأعمق عند 2,820–2,780 حیث قد یشکل ETH قاعاً أعلى قبل محاولة صعود جدیدة. شروط تأکید موجة صعودیة حقیقیة: إغلاق واضح ومستقر لإطار 4 ساعات فوق 3,150–3,180. تقاطع EMA 34 فوق EMA 89 مع میل صعودی لکلا المتوسطین. زیادة واضحة فی حجم الشراء أثناء محاولات الاختراق. فقط عند تحقق هذه الشروط یمکن للأهداف الصاعدة أن تمتد إلى 3,260 – 3,380، وربما 3,520، وذلک حسب قوة البیتکوین ومزاج السوق العام. أتمنى للجمیع تداولاً منضبطاً وفعّالاً — راقبوا جیداً کیفیة تفاعل ETH حول مناطق المتوسطات هذه!
اتریوم (ETH) پس از سقوط: برگشت فنی یا آغاز موج صعودی جدید؟
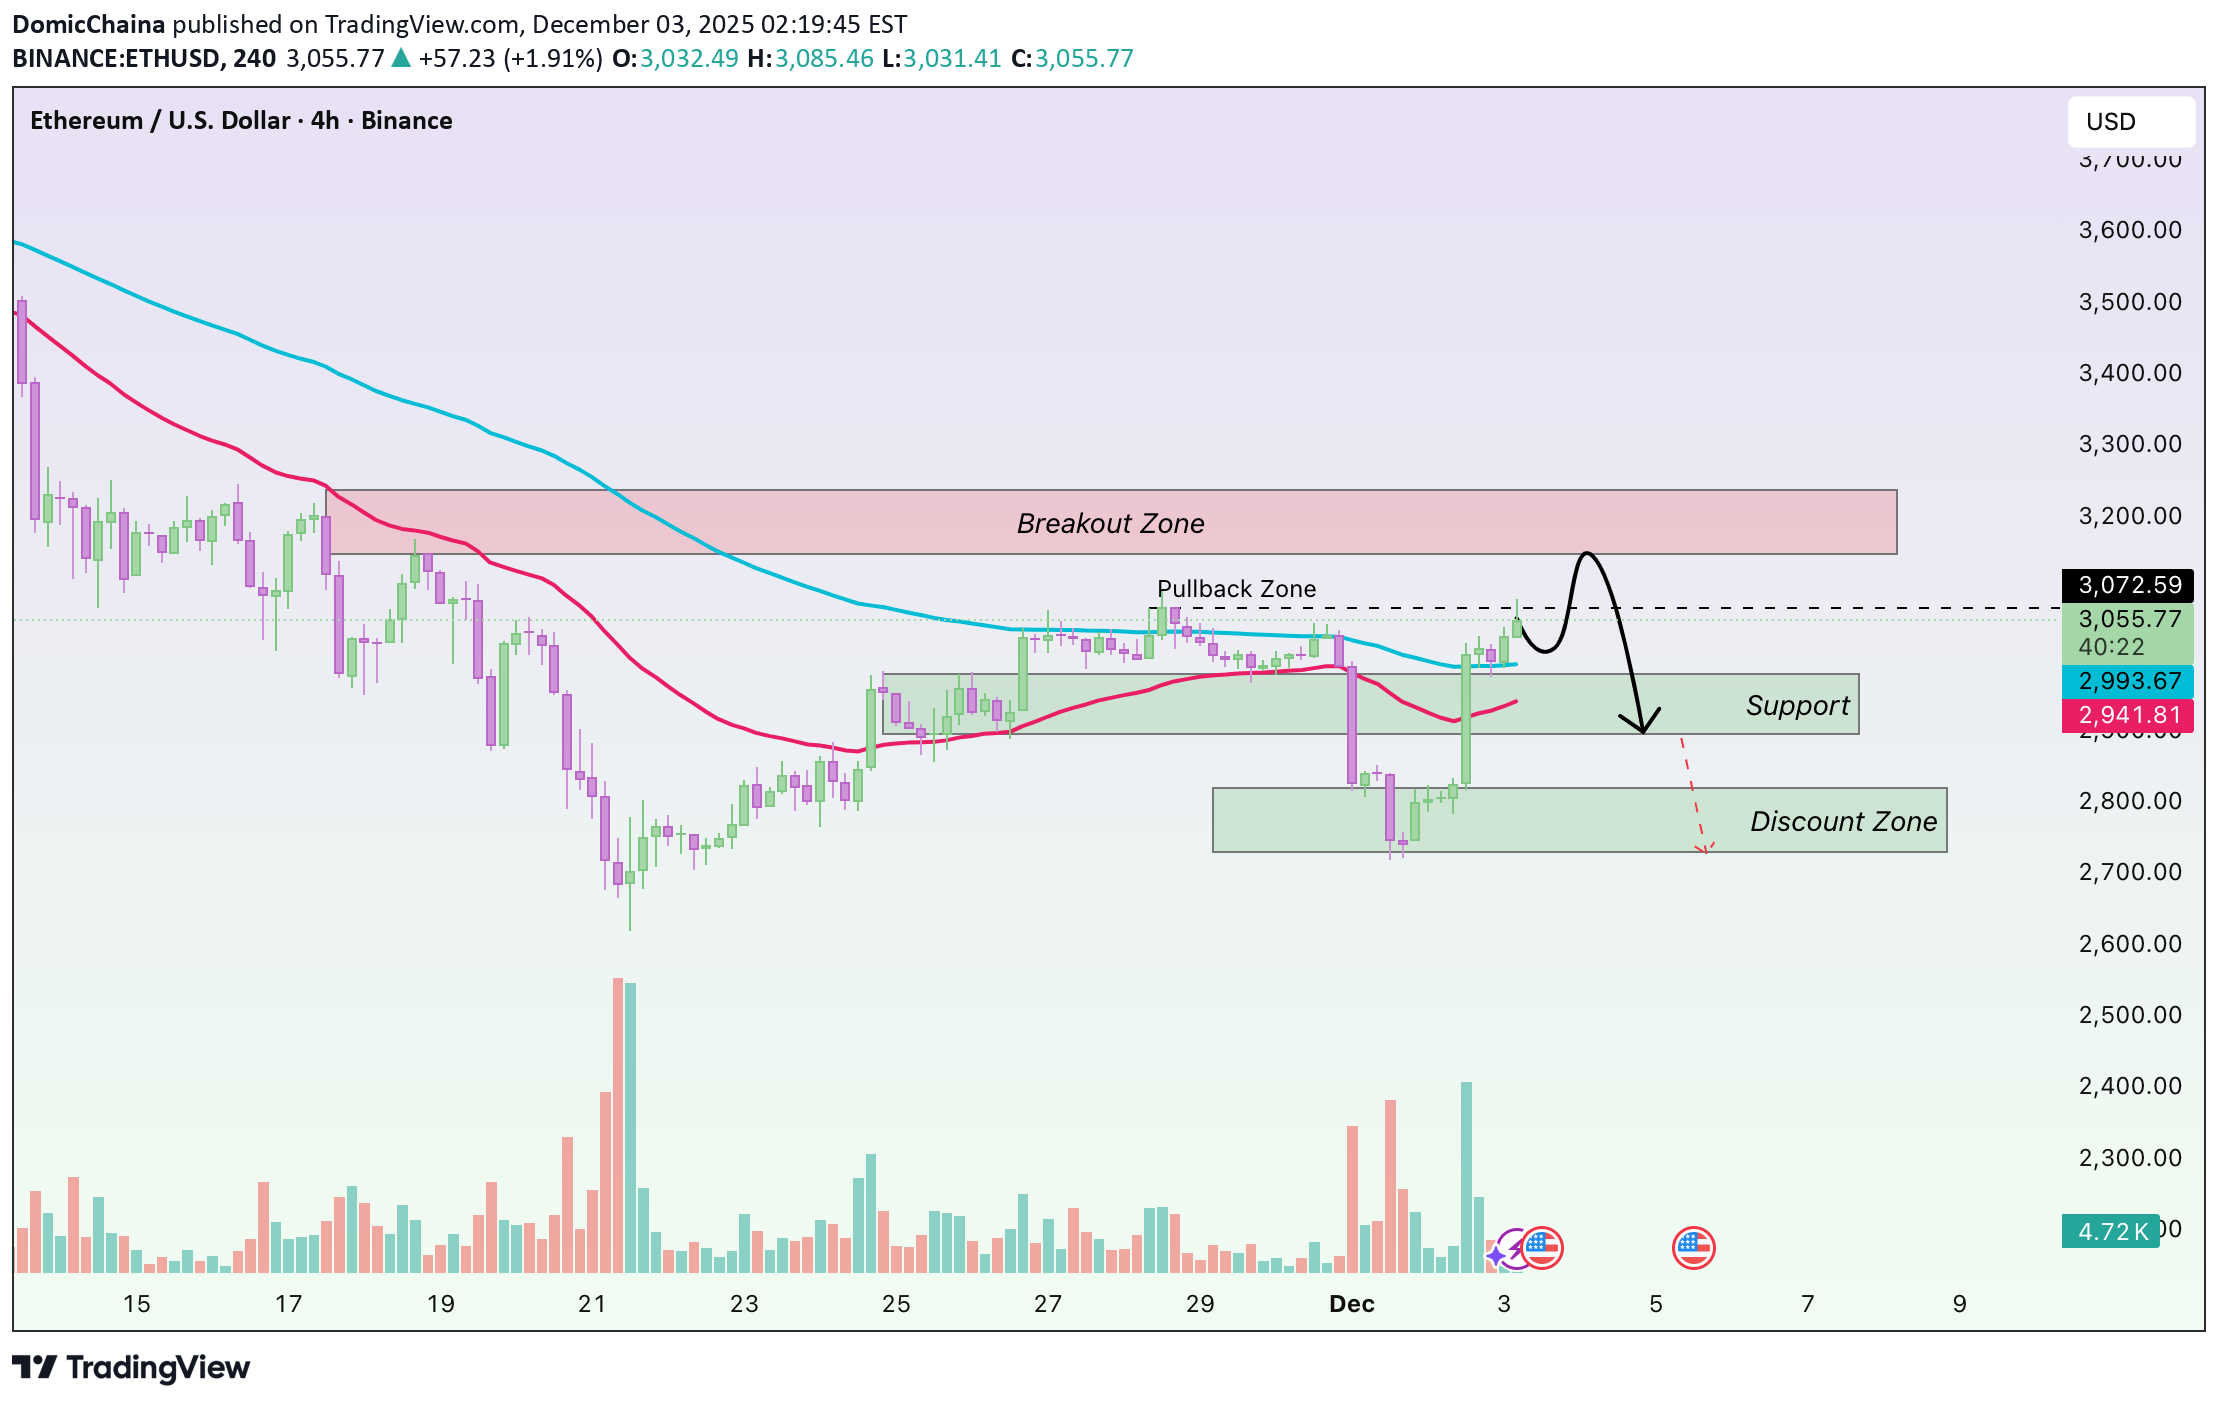
Hello everyone, ETH has just bounced back — but is this the beginning of a new bullish wave, or simply a technical pullback before the market chooses its true direction? Let’s break it down together! ETH recently experienced a sharp dump from 3,150 down to 2,780, sweeping liquidity below and forcing the market into a technical “reset.” The long bearish candle accompanied by high volume suggests a real sell-off, but right after that, ETH reversed upward and is now hovering around 3,050, pressing against the EMA 89 while the EMA 34 begins to curl upward. This rebound is essentially a technical pullback within a broader downtrend — price is trying to rebalance around the EMAs after a deep drop. Volume has picked up slightly, but there’s no real FOMO yet; it’s mostly short covering and early dip-buyers stepping in. Market structure still leans bearish: lower highs, lower lows, a downward-sloping EMA 89, and ETH still hasn’t secured a strong 4H close above 3,100–3,150. However, this bounce does have a foundation: expectations of a softer Fed stance, Bitcoin recovering slightly and dragging altcoins up, and Ethereum’s long-term narrative continuing to attract investors — turning the 2,800 zone into a “discount zone” for gradual accumulation. Still, the rebound isn’t strong enough to confirm the start of a new uptrend. My personal view: ETH is likely to continue rising toward the 3,080–3,120 region — a confluence of the EMA 89, previous highs and a prior supply area. If selling pressure reappears — upper-wick candles, rising volume — ETH could face rejection and retrace lower. The support levels I’m watching are 2,950–2,900, with a deeper zone at 2,820–2,780 where ETH may form a higher low before attempting another push upward. Conditions required to confirm a true bullish wave: A clean, stable 4H close above 3,150–3,180. EMA 34 crossing above EMA 89, with both EMAs starting to slope upward. Clear buying volume expansion during breakout attempts. Only when these criteria are met can upside targets extend to 3,260 – 3,380, and potentially 3,520, depending on Bitcoin’s strength and overall market sentiment. Wishing everyone disciplined and effective trading — pay close attention to how ETH reacts around these key EMA zones!
صعود لحظهای بیت کوین فریبنده است؛ آیا روند نزولی ادامه دارد؟
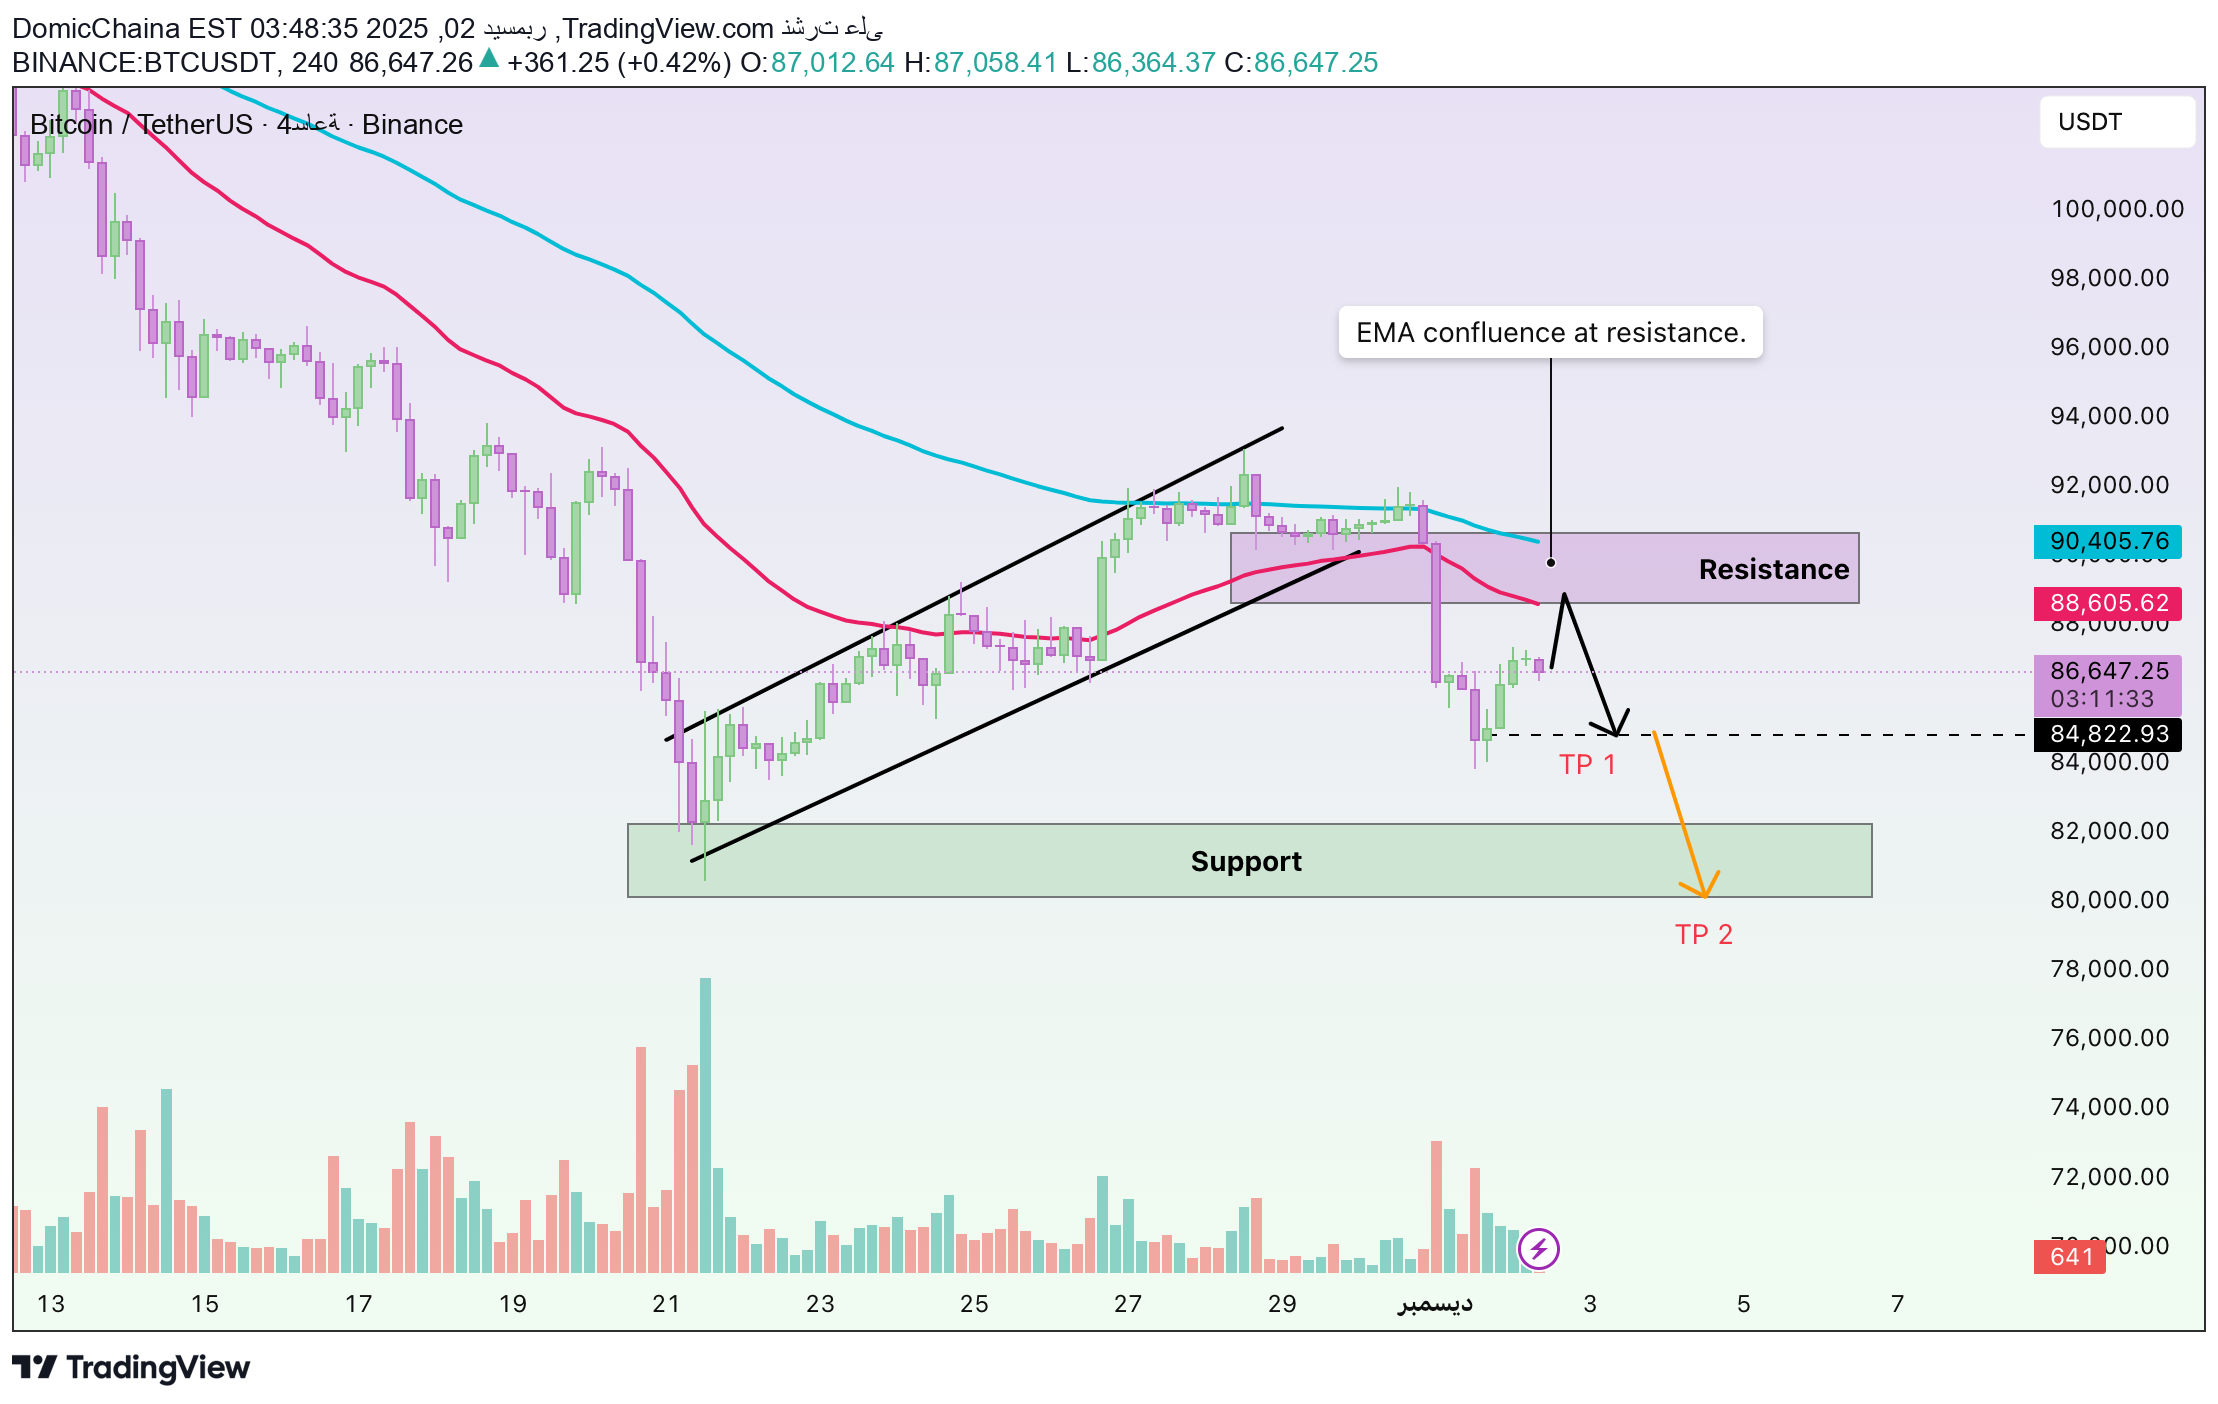
مرحباً بالجمیع، معکم دومیک ✌️ عند النظر إلى حرکة سعر البیتکوین الأخیرة، یمکنک أن تلاحظ أن الهبوط الأخیر لم یکن سقوطاً عشوائیاً. فقد کسر السوق تماماً منطقة التوازن التی استمرت عدة أیام، وعند رفض السعر مراراً عند المتوسط EMA 89 ثم فقدان EMA 34، أصبح واضحاً أن قوة البائعین هی المسیطرة. ومن المثیر للاهتمام أنه بعد هذا الانخفاض الحاد، ارتدّ البیتکوین فی حرکة تصحیح قصیرة المدى. هذا لا یشیر إلى انعکاس فی الاتجاه؛ بل هو مجرد رد فعل طبیعی للسوق بعد الهبوط السریع: جنی أرباح من البائعین، تغطیة مراکز البیع، ومحاولات شراء ضعیفة — کلها أدت إلى ارتداد تقنی یکفی لإعادة التوازن، لکنه غیر کافٍ لتغییر الاتجاه. من منظور اقتصادی عام، الإشارات متناسقة إلى حد کبیر: عوائد السندات الأمریکیة ارتفعت مجدداً، مؤشر الدولار DXY ارتد من منطقة 99، تدفقات صنادیق ETF ضعفت، والمزاج الدفاعی قبل صدور بیانات سوق العمل الأمریکی أدى إلى جفاف شبه کامل فی الطلب. سوق الکریبتو یتأثر ببساطة بحالة العزوف عن المخاطرة. ومن الناحیة الفنیة، یتداول BTC حالیاً تحت کل من المتوسط EMA 34 و EMA 89 — وهما متوسطان متناقصان یشیران إلى استمرار الاتجاه الهابط. الکسر على إطار 4 ساعات مع حجم تداول قوی یؤکد أن هذا هبوط حقیقی. حالیاً، یقوم BTC بحرکة تصحیح لإعادة اختبار مناطق المقاومة: 88,700–89,000 عند EMA 34 و 90,400–90,600 عند EMA 89. هذه المناطق ستحدد ما إذا کانت قوى البیع لا تزال مهیمنة. إذا عاد البائعون بقوة، فقد یستمر البیتکوین فی الهبوط نحو مناطق الدعم الأدنى: 85,500–86,000 کمنطقة أولى مهمة، تلیها 83,000–84,000 — وهی منطقة طلب شهدت سابقاً ارتداداً صعودیاً قویاً. ومع الزخم الحالی، یصبح سیناریو وصول BTC على الأقل إلى منطقة 85,500–86,000 أکثر احتمالاً. برأیکم، إلى أی اتجاه یمیل السوق حالیاً؟ لا تترددوا فی مشارکة آرائکم — وأتمنى للجمیع تداولاً ناجحاً!
اصلاح قیمت بیت کوین موقتی است: آیا روند نزولی واقعی شده است؟
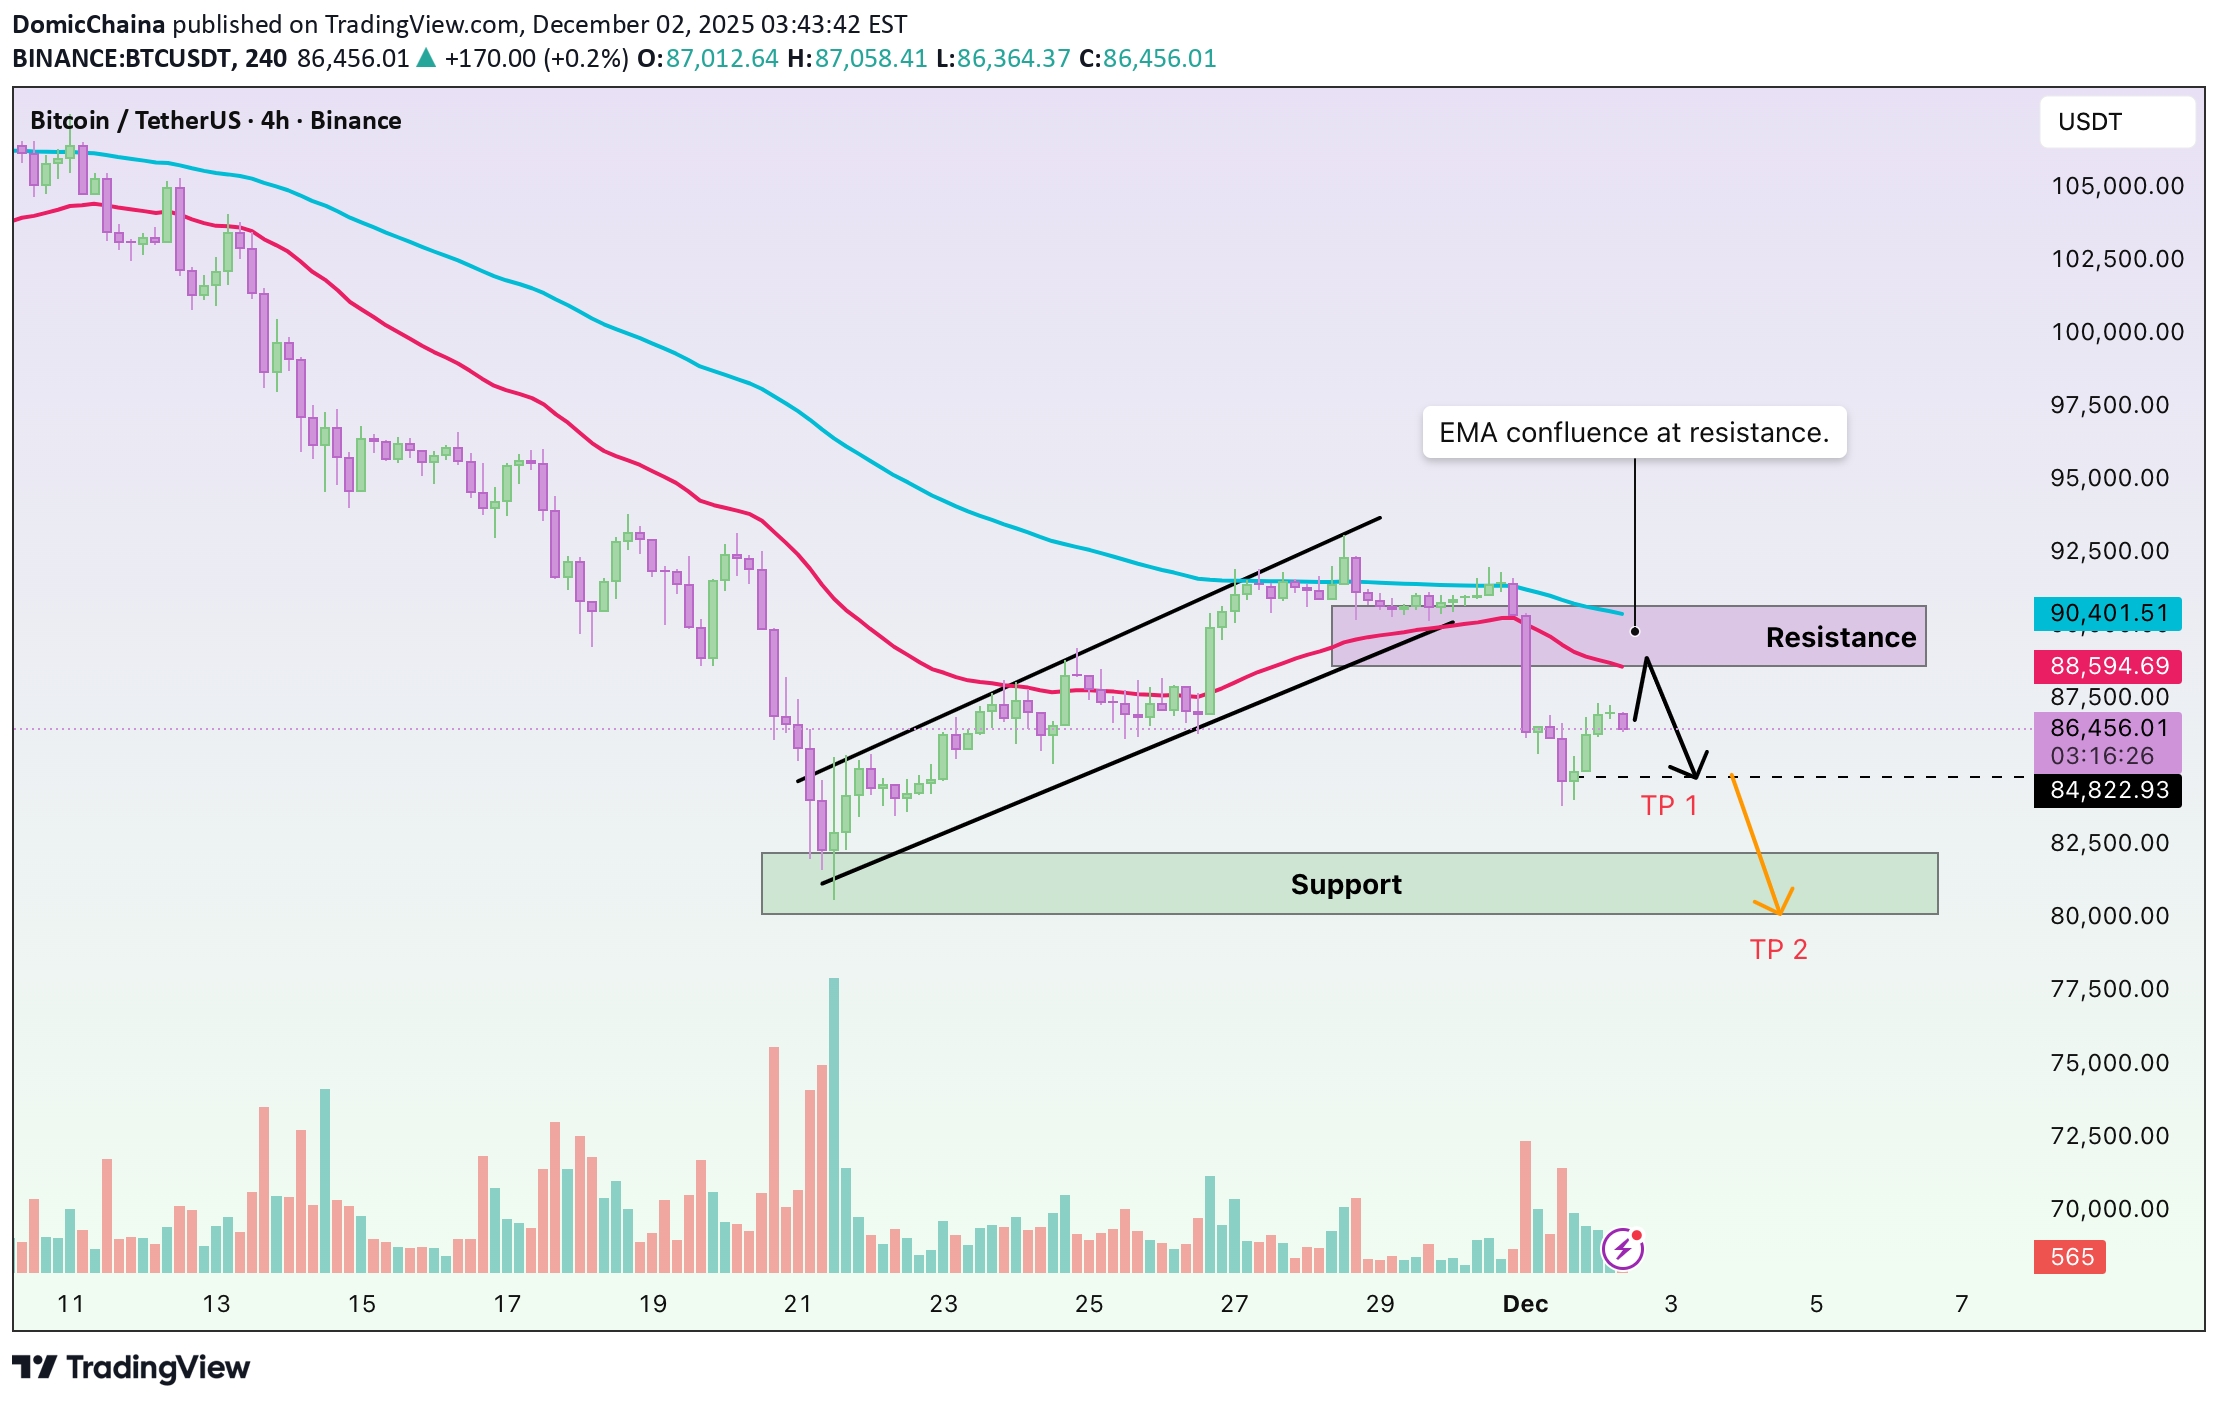
Hello everyone, it’s Domic here ✌️ Looking at Bitcoin’s recent price action, you can probably feel that the latest drop wasn’t a random fall. The market completely broke through a multi-day equilibrium zone, and the moment BTC was repeatedly rejected at the EMA 89 and then lost the EMA 34, the balance of power shifted clearly toward the sellers. Interestingly, right after that sharp breakdown, BTC bounced into a short-term pullback. This doesn’t signal a trend reversal; it’s simply the market’s natural reaction after falling too quickly: profit-taking from sellers, short-covering, and weak dip-buying flows creating a technical rebound — enough to rebalance the market, but not enough to change direction. From a macro perspective, the signals are fairly aligned: US bond yields have risen again, the DXY has bounced from the 99 area, ETF inflows have weakened, and defensive sentiment ahead of upcoming US labour data has caused demand to dry up almost entirely. Crypto is simply being dragged along with the broader risk-off environment. From a technical angle, BTC is trading below both the EMA 34 and EMA 89 — two downward-sloping moving averages indicating the trend remains bearish. The 4H breakdown accompanied by strong volume shows this is a real sell-off. BTC is currently pulling back to retest the resistance levels: 88,700–89,000 at the EMA 34 and 90,400–90,600 at the EMA 89. These zones will reveal whether selling pressure still dominates. If sellers return aggressively, BTC may continue heading toward lower support regions: 85,500–86,000 is the first key area, followed by 83,000–84,000 — a demand zone that previously generated a strong bullish reaction. With the current momentum, the scenario where BTC at least touches the 85,500–86,000 support is becoming increasingly likely. Which direction do you think the market is leaning toward? Feel free to share your perspective — and wishing everyone successful trading!
Disclaimer
Any content and materials included in Sahmeto's website and official communication channels are a compilation of personal opinions and analyses and are not binding. They do not constitute any recommendation for buying, selling, entering or exiting the stock market and cryptocurrency market. Also, all news and analyses included in the website and channels are merely republished information from official and unofficial domestic and foreign sources, and it is obvious that users of the said content are responsible for following up and ensuring the authenticity and accuracy of the materials. Therefore, while disclaiming responsibility, it is declared that the responsibility for any decision-making, action, and potential profit and loss in the capital market and cryptocurrency market lies with the trader.