
BULLSTAR1
@t_BULLSTAR1

What symbols does the trader recommend buying?
Purchase History
پیام های تریدر
Filter
BULLSTAR1
DOGE Accumulation Zone, Trendline Break Could Trigger a Short Te
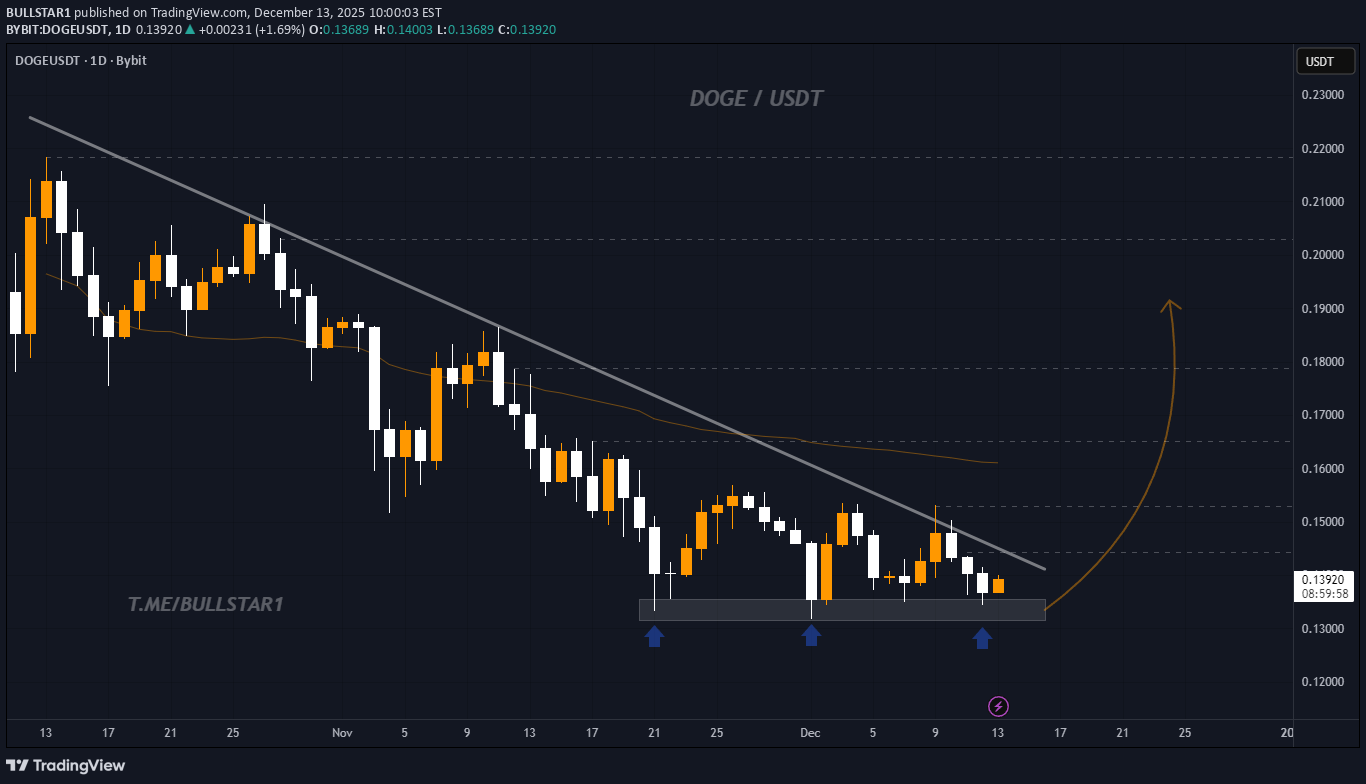
DOGE is holding a strong demand zone after a prolonged downtrend. Price is forming higher reactions from the same support area, while the descending trendline is getting close to a potential breakout point. This structure suggests accumulation and weakening selling pressure. If DOGE confirms a breakout above the trendline, a bullish move toward higher resistance levels could follow. Patience is key, confirmation matters.
BULLSTAR1
ADA Breaks the Downtrend, Momentum Is Shifting
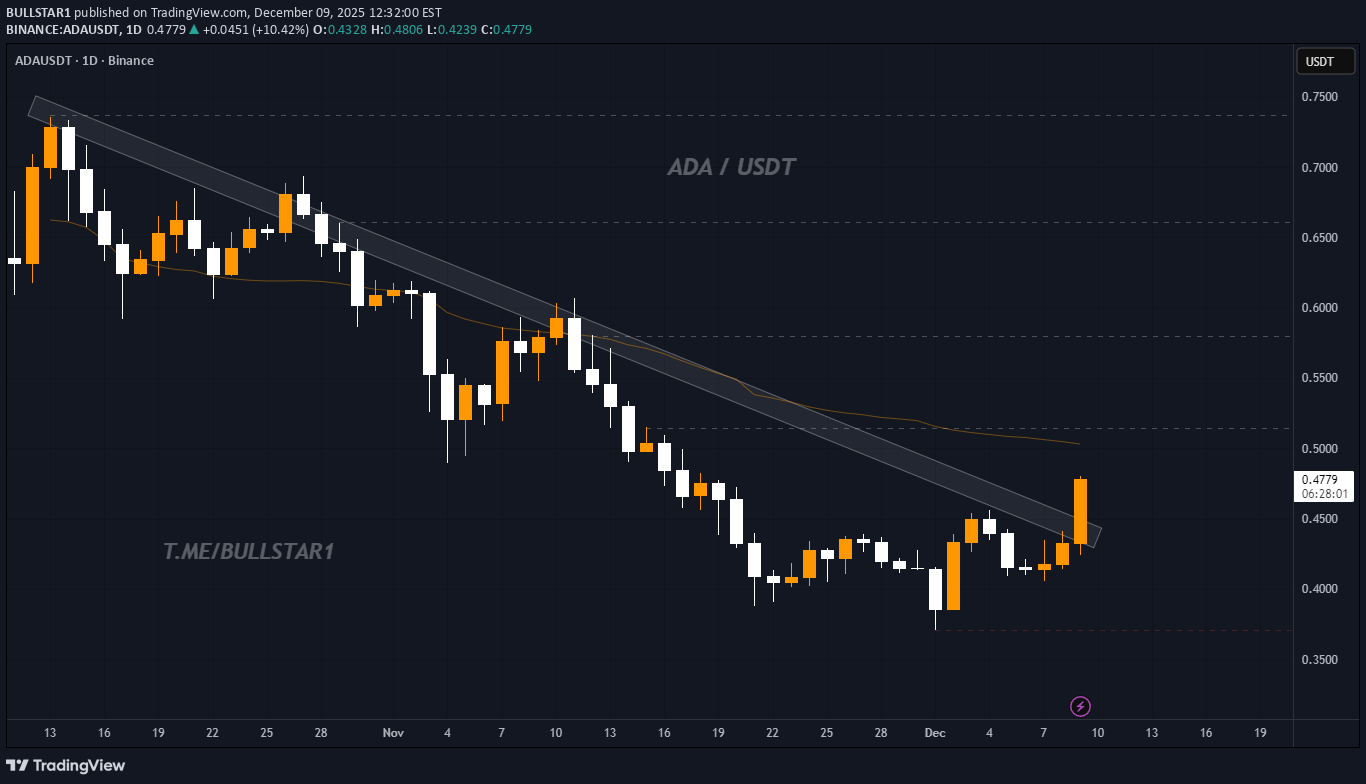
ADA is showing its first meaningful strength after weeks of downward pressure. Price has broken above the multi week descending trendline that has been acting as consistent resistance throughout the entire downtrend. This breakout indicates a potential shift in momentum, especially as the daily candle is pushing firmly beyond the trendline with increased volatility. If the daily close confirms above this structure, ADA could be entering a recovery phase, where the market may start targeting higher levels. The first major resistance zone sits between 0.50 and 0.55, an area that previously triggered strong reactions. A clean break above that region would further strengthen the bullish structure and open the path toward the next key levels on the chart. For now, market participants should keep an eye on the daily close and how price reacts around the trendline retest. Holding above this level will be an important signal for continuation and for a potential momentum shift after a prolonged period of weakness.
BULLSTAR1
آمادهسازی ENA: آیا زمان جهش بزرگ و شکست روند نزولی فرا رسیده است؟
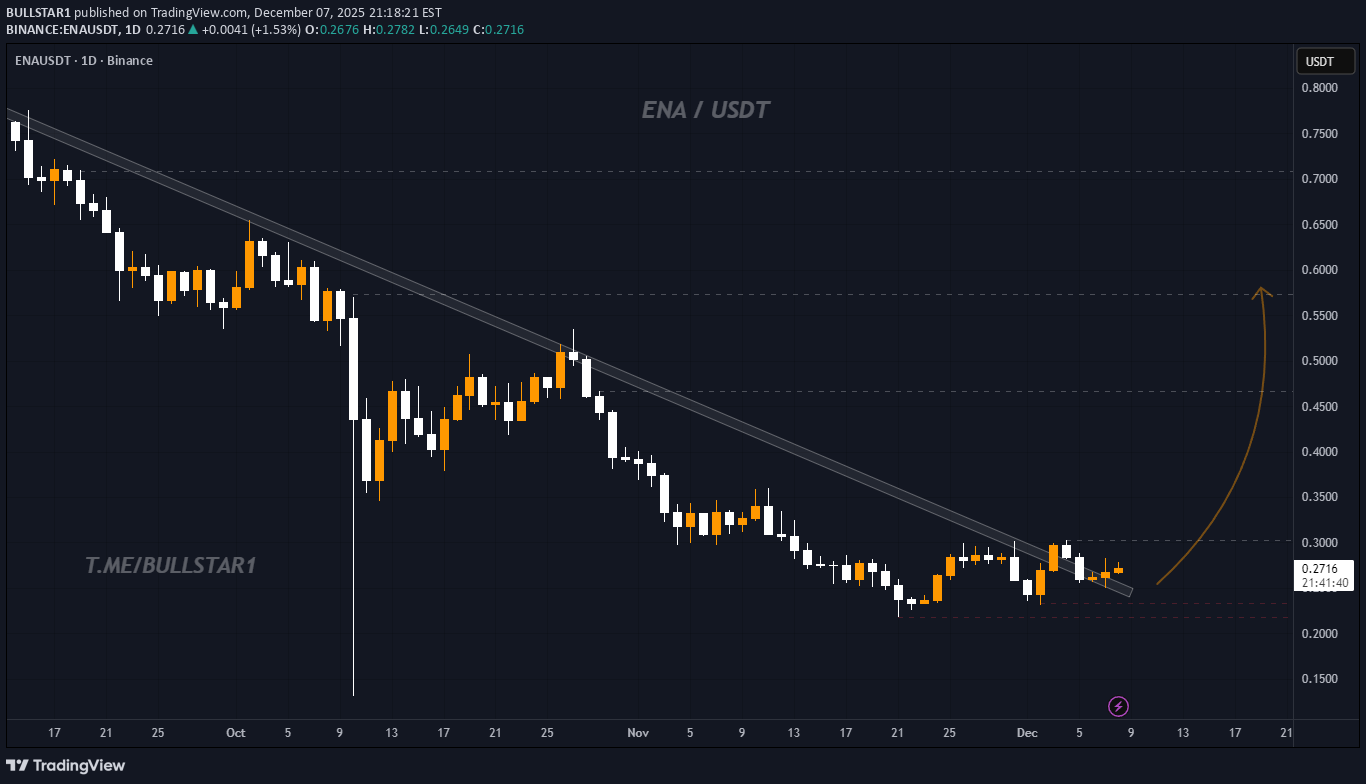
ENA is showing the first signs of breaking the downtrend. The price is holding well above the current zone and a clean breakout of the trendline could open the way for a strong move toward the 0.55 area, where liquidity and heavy resistance are positioned. We are monitoring closely for a more sustained upside in the coming days.
BULLSTAR1
شکست تاریخی LINK و راز ادامه صعود: فرصت ترید بعدی کجاست؟
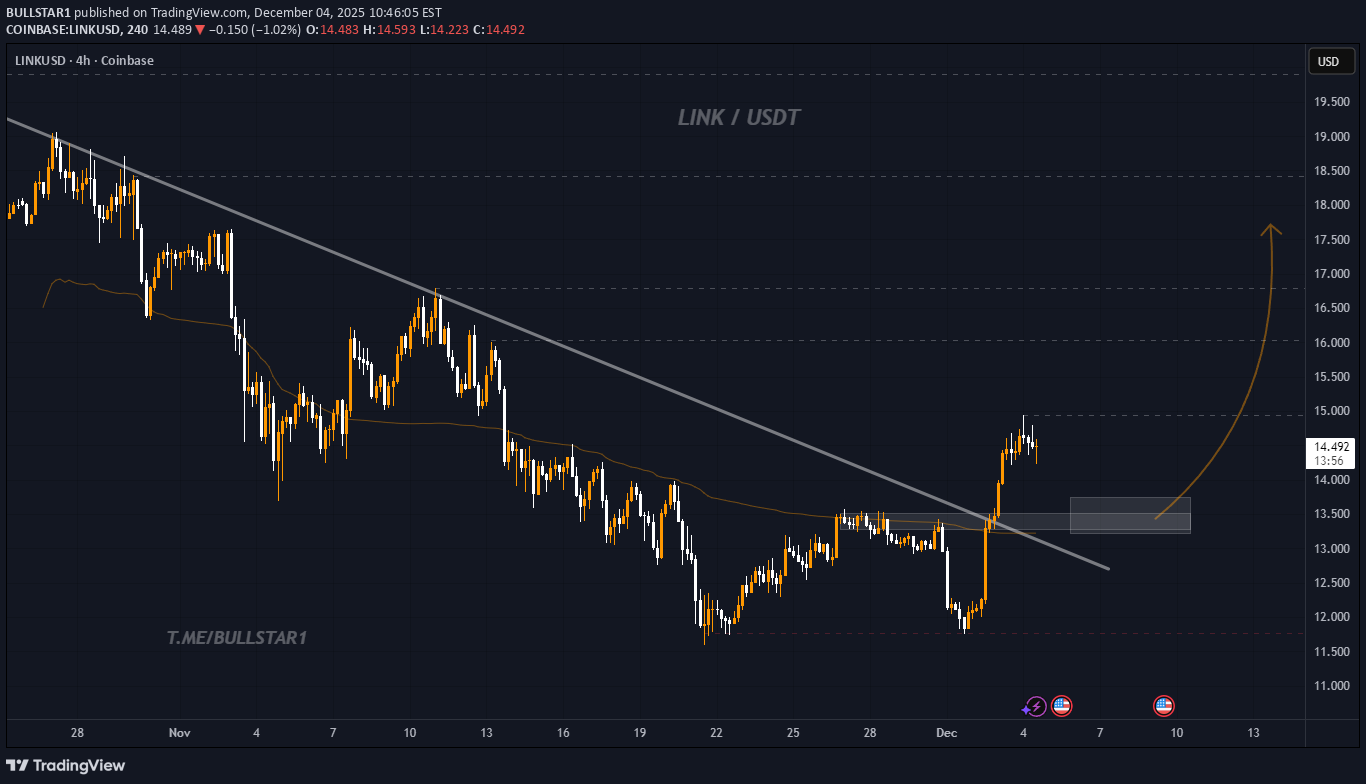
LINK has finally broken its long term downtrend and reclaimed momentum. Price made a strong breakout and is now pulling back toward the retest zone around the previous trendline. If this area holds as support, LINK may continue its upward move toward higher targets. Structure looks clean and bullish as long as the retest confirms support.
BULLSTAR1
حمایت قوی تون (TON) در 1.40 دلار: آیا زمان بازگشت بزرگ به 3.50 دلار فرا رسیده است؟
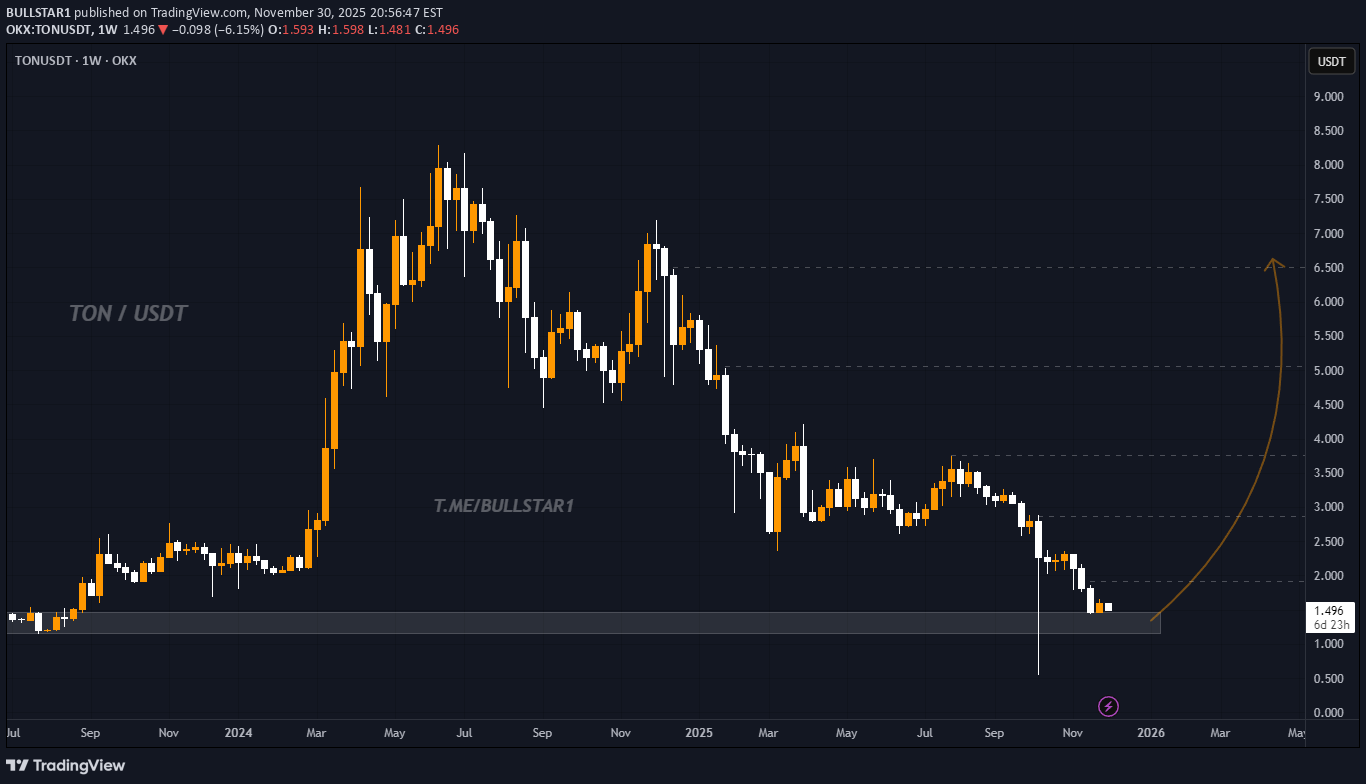
TON is currently sitting on a strong multi month support zone around 1.40, a level where price has reacted several times in the past. From this zone, TON has potential to start a steady recovery toward the next key levels, first near 2.50 then 3.00 and possibly 3.50. This is a spot setup based on the weekly structure, showing a possible mid term reversal if the support continues to hold. #TON #TONUSDT #CryptoTA #MarketStructure #SupportZone #PriceAction #CryptoTrading #ReversalZone
BULLSTAR1
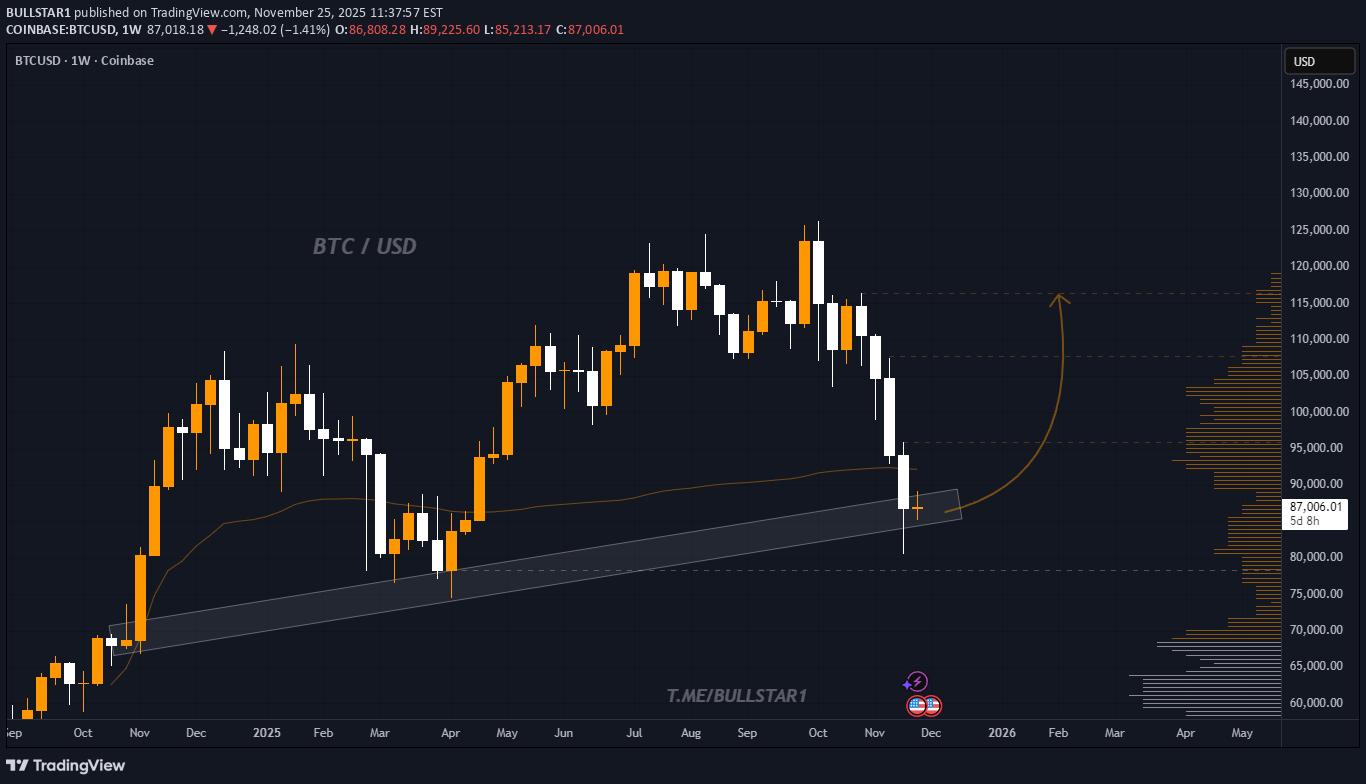
بیت کوین به مرز 100 هزار دلار میرسد؟ تحلیل هفتگی و کلیدهای صعود طلاعات
BULLSTAR1
هلیوم (HBAR) با قدرت برگشت: آیا قیمت تا ۰.۲۵ جهش میکند؟
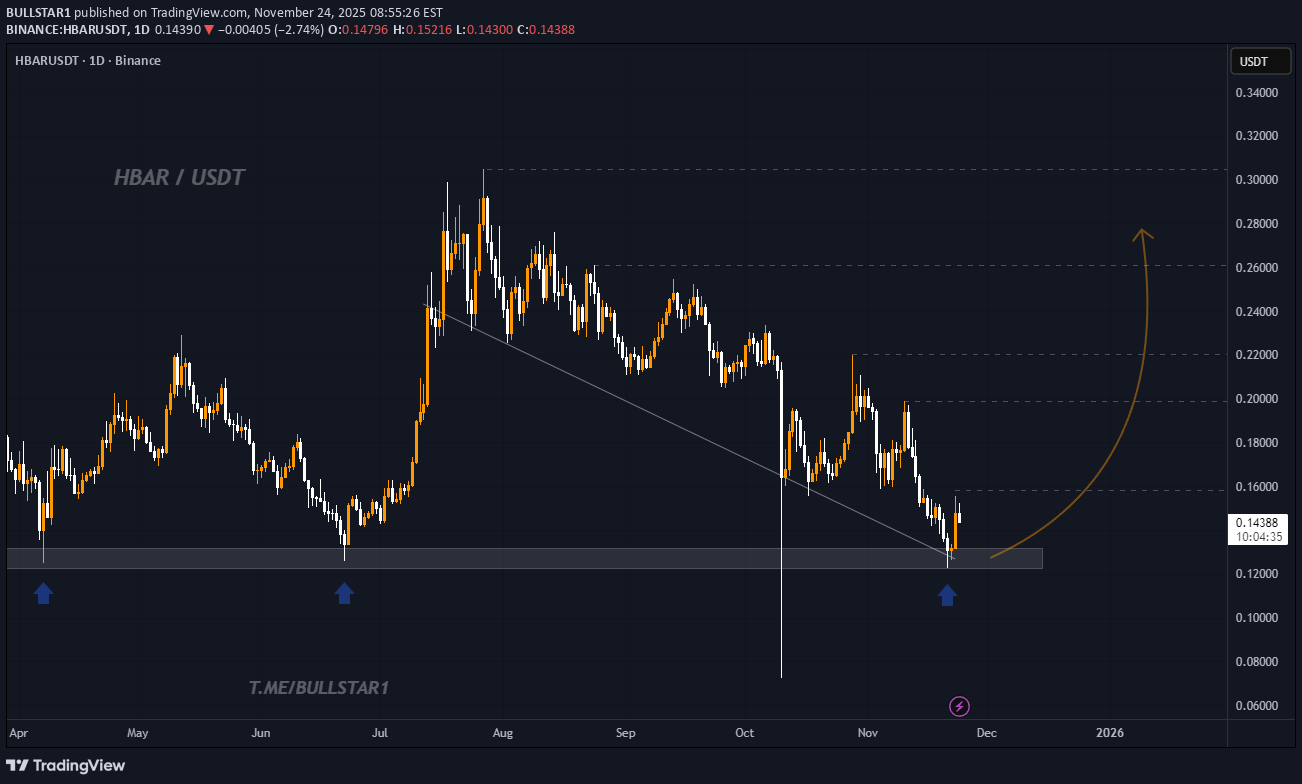
HBAR is showing a strong reaction from the support zone around 0.13, a level that has held multiple times in the past. If price continues to stay above this area, we could see a steady move toward higher resistance levels and a potential rise toward 0.25 in the coming weeks. Market structure looks positive and buyers are stepping in again.
BULLSTAR1
لینک (Chainlink) روی حمایت تاریخی: آیا آماده جهش قدرتمند بعدی است؟
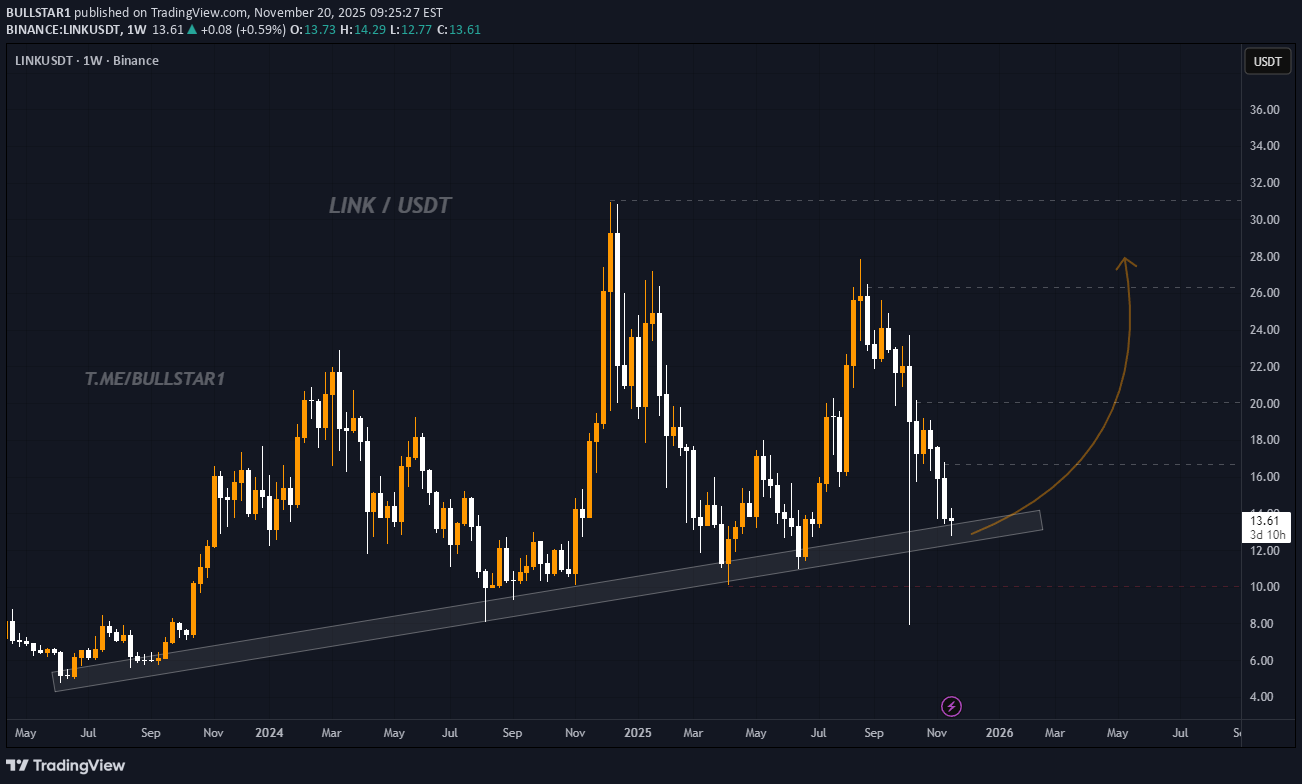
Chainlink is currently retesting a long term weekly ascending trendline that has acted as a major support area since mid 2023. Every time price has touched this trendline in the past, it has generated a strong bullish reaction. Price has once again returned to this key level around the 13 zone, showing early signs of stabilization. As long as the weekly structure holds above the trendline, LINK maintains a bullish macro outlook. I expect a gradual rebound from this support area, followed by continuation toward the next major resistance levels. The bullish scenario becomes stronger if weekly candles close above recent local highs. Key levels to watch on the upside are near 18, 22 and 26. A breakdown below the trendline would invalidate the setup and open the door to deeper downside, however the current structure favors the bulls. This idea is based on long term trendline support, higher timeframe structure, and the repeated historical reaction from this level.
BULLSTAR1
رشد انفجاری NEAR: آیا قیمت به ۳ دلار میرسد؟ (تحلیل شکسته شدن خط مقاومت)
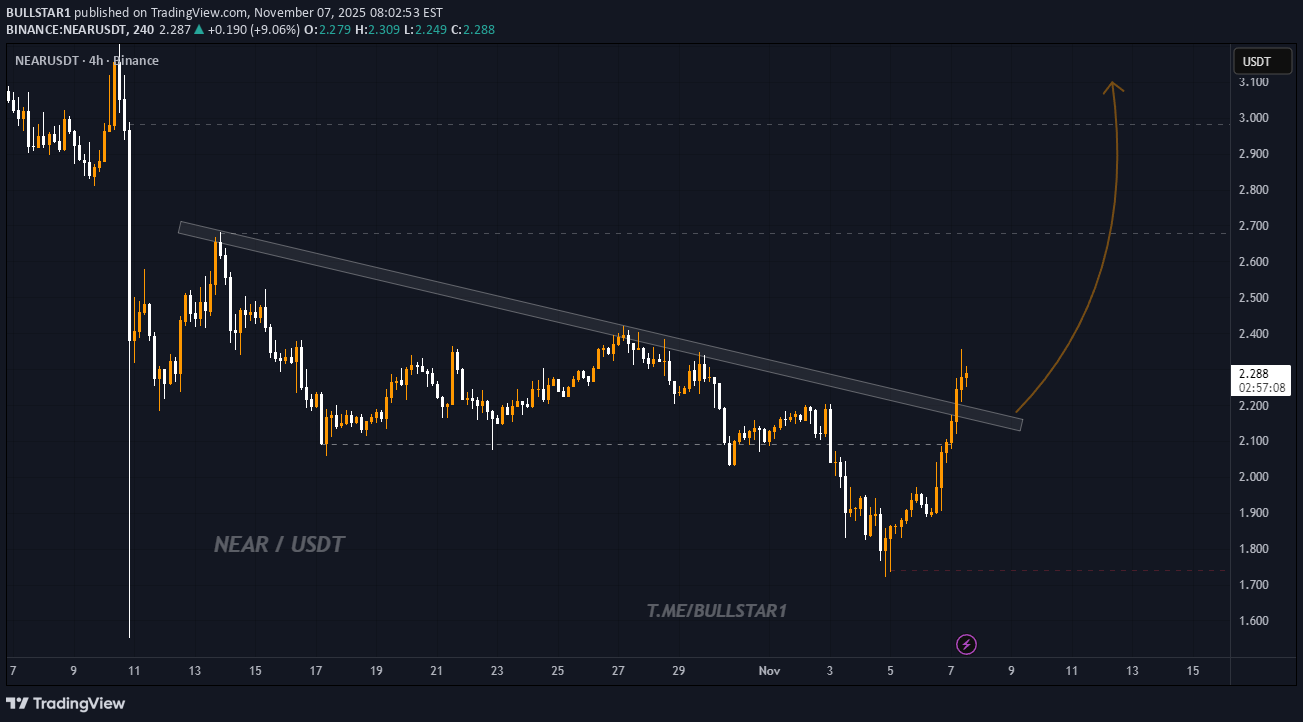
NEAR has successfully broken above a descending trendline that has acted as resistance since mid-October. This breakout indicates a potential shift in market structure from bearish to bullish. Price reclaimed the $2.20 zone with strong momentum, showing increasing buyer pressure after a prolonged downtrend. If NEAR holds above this breakout level, it could confirm a trend reversal. Key levels: Support: $2.10 – $2.20 (former resistance, now potential support) Targets: - TP1: $2.50 - TP2: $2.80 - TP3: $3.00 - Stop loss: Below $1.75 If momentum continues and volume supports the breakout, NEAR could revisit the $3.00 zone in the coming sessions. A 4H or daily close below $2.10 would invalidate this bullish setup.
BULLSTAR1
سطح حمایت حیاتی زِدکش (ZEC) کجاست؟ آیا آماده شکستن مقاومت و صعود تا ۳۶۰ دلار است؟
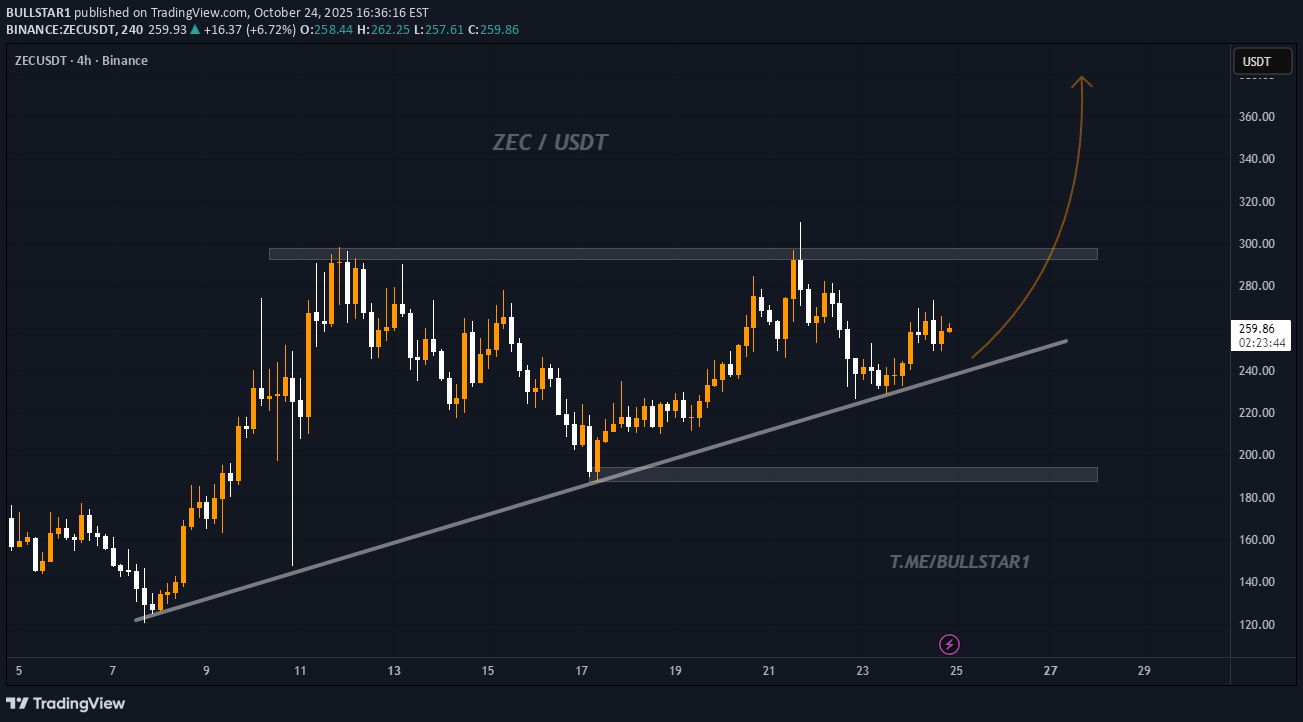
ZEC is currently retesting a key ascending trendline that has acted as strong support since early October. The price has been forming higher lows, indicating continued bullish structure on the 4H chart. After multiple rejections around the $290–$300 resistance zone, ZEC is consolidating near $255 and showing signs of accumulation. If the trendline support holds, a potential breakout above $300 could trigger a strong bullish continuation toward $340 and $360. Key Levels: - Support: $240–$250 - Resistance: $290–$300 - Targets: $340 / $360 Invalidation: A 4H close below $235 would invalidate this bullish setup. Overall, ZEC remains in an ascending structure, and a confirmed breakout above the horizontal resistance could mark the start of the next leg up.
Disclaimer
Any content and materials included in Sahmeto's website and official communication channels are a compilation of personal opinions and analyses and are not binding. They do not constitute any recommendation for buying, selling, entering or exiting the stock market and cryptocurrency market. Also, all news and analyses included in the website and channels are merely republished information from official and unofficial domestic and foreign sources, and it is obvious that users of the said content are responsible for following up and ensuring the authenticity and accuracy of the materials. Therefore, while disclaiming responsibility, it is declared that the responsibility for any decision-making, action, and potential profit and loss in the capital market and cryptocurrency market lies with the trader.