
TuffyBro
@t_TuffyBro

What symbols does the trader recommend buying?
Purchase History
پیام های تریدر
Filter
TuffyBro
CARDANO (ADA) STRATEGY: TRADING THE ORDER BLOCK RANGE
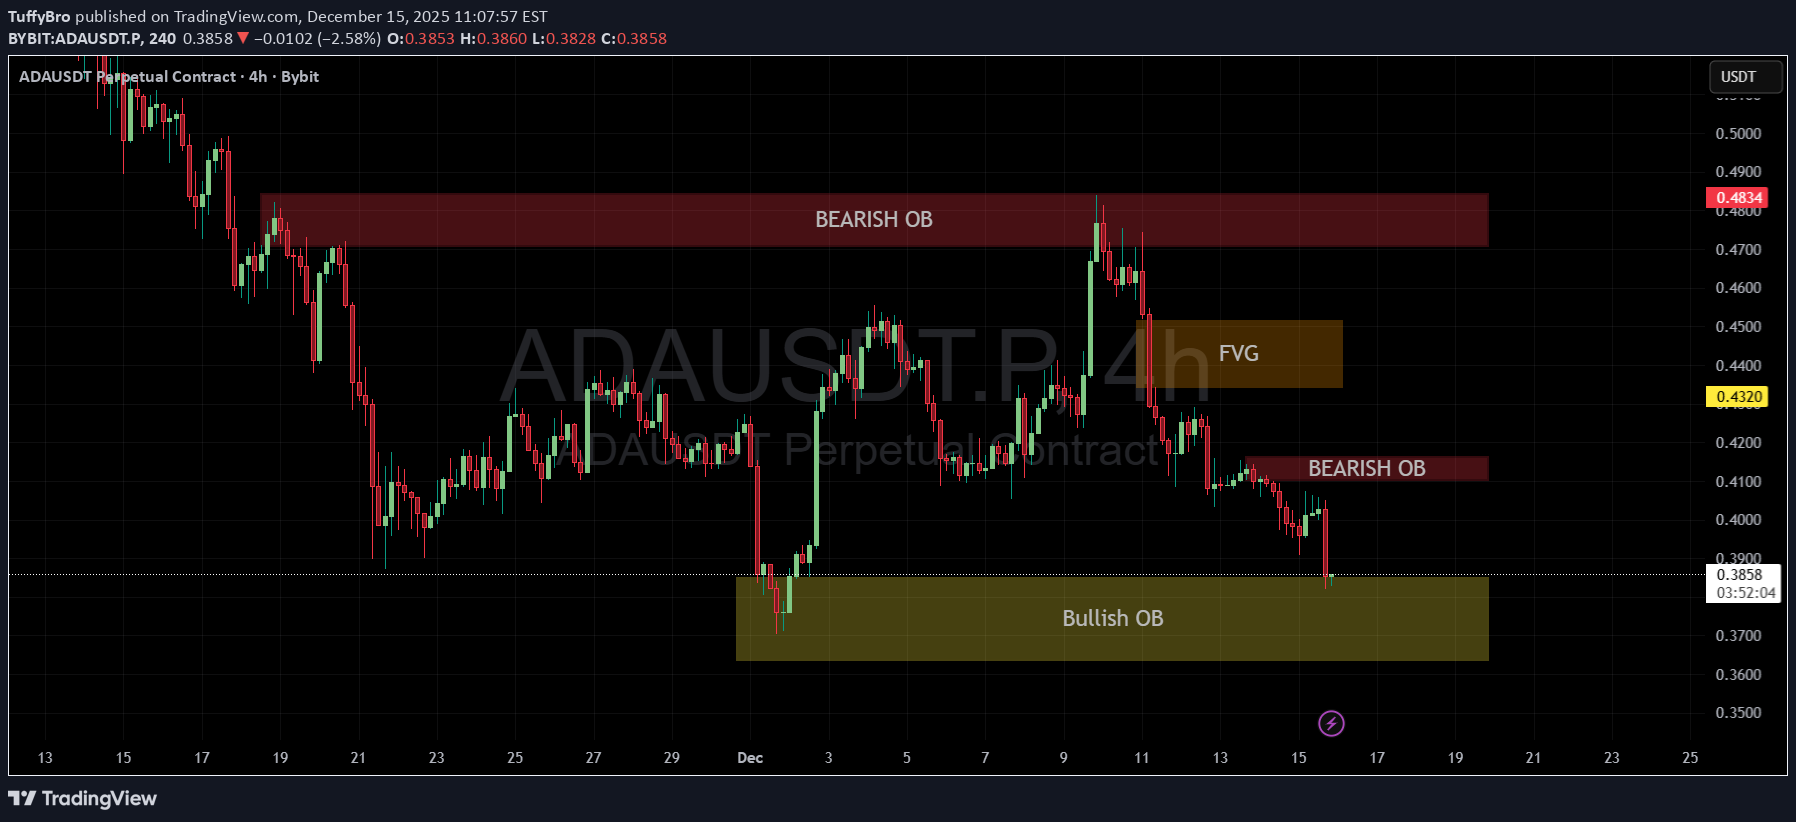
Cardano (ADA) is currently trapped in a clearly defined trading range, bouncing between institutional supply and demand zones. As shown on the chart, price action is respecting the "Order Block" (OB) levels perfectly, giving us a clear roadmap for the next few days. We are currently analyzing three critical areas of interest: THE BULLISH ORDER BLOCK (DEMAND ZONE) Zone. We are currently testing this zone. This represents the "Demand Floor" where buyers have historically stepped in aggressively. The Setup: Price has retraced fully into this block. We are looking for a reaction or a lower timeframe reversal pattern (like a break of structure on the 15m chart) to confirm that bulls are defending this level. The Trade: Long positions taken here offer a high Risk-to-Reward ratio because your invalidation point is very close (just below the box). THE FAIR VALUE GAP (FVG) - FIRST TARGET Zone Fair Value Gaps often act as magnets for price. If the Bullish OB holds, the first logical target is this imbalance. Expectation: Price is likely to be drawn up to fill this gap. This is a perfect area to take partial profits or move Stop Losses to breakeven. THE BEARISH ORDER BLOCK (SUPPLY ZONE) Zone: (The Red Box) This is the major resistance ceiling. The Strategy: This is the ultimate Take Profit zone for longs. Conversely, if price reaches this red box and shows rejection wicks, it becomes a high-probability SHORT entry to play the range back down. TRADING PLAN Scenario A: The Bounce (Bullish) Condition: Price holds above $0.3845 and creates a bullish candle close on the 4H. Action: Enter Long. Target 1: (FVG Fill). Target 2: (Bearish OB Test). Stop Loss: A daily close below $0.3638 invalidates the demand zone. Scenario B: The Breakdown (Bearish) Condition: If the Bullish OB fails and we get a confirmed close below $0.3630 Action: The setup is invalidated. We would then look for a retest of the broken level to go Short, targeting lower liquidity levels. SUMMARY The market is simple right now: We are at Support (Bullish OB). Until this level breaks, the bias at this specific price point is to look for Longs targeting the liquidity voids above (FVG). Are you buying the dip at this OB, or waiting for a breakdown? Let me know in the comments! Disclaimer: This analysis is for educational purposes only. Cryptocurrency trading involves high risk. Always manage your risk properly.taking tp
TuffyBro
4 TYPES OF TRADERS & THEIR RISK MANAGEMENT STYLES (MASTERCLASS)
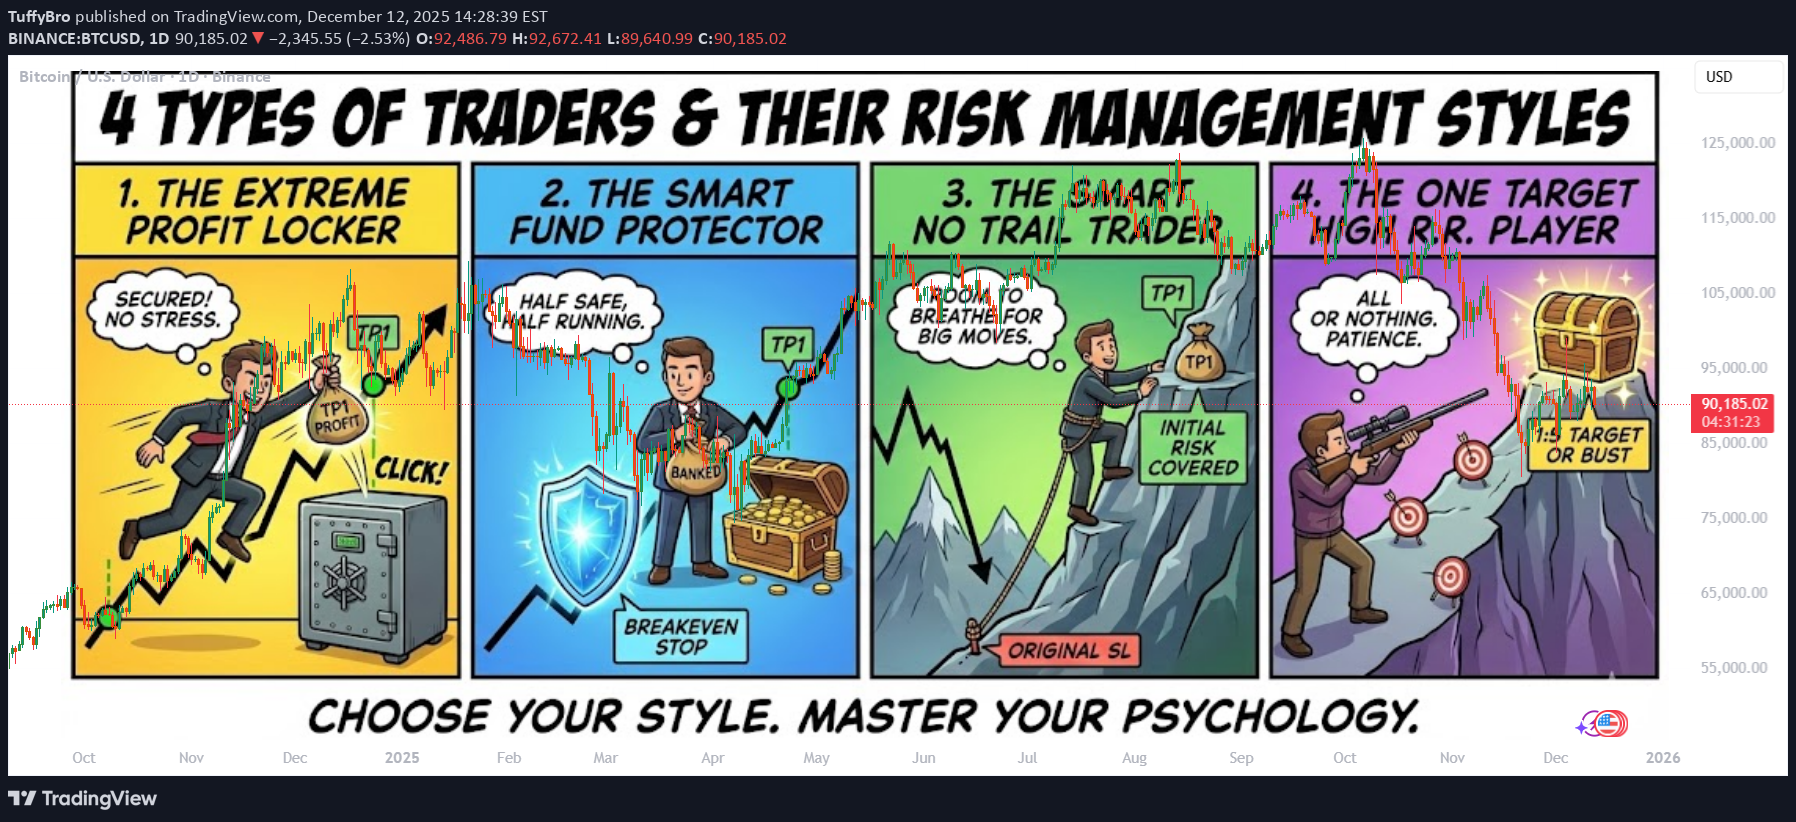
In the world of trading, your personality dictates your strategy. There is no "one size fits all" approach to closing a trade. Some traders prefer peace of mind, while others chase maximum potential returns. Below are the four main types of traders based on how they handle Take Profit (TP) levels and risk. Identifying which one you are the first step to consistency. 1) THE EXTREME PROFIT LOCKER This trader closes the entire position the moment TP1 is hit or at a certain level like 1R. PROS: Immediate Profit: The moment TP1 is hit, the profit is secured in the wallet. Zero Stress: No more emotional pressure or chart watching since the trade is fully closed. Safety: No chance of the trade reversing into a loss because you are already out. CONS: FOMO (Fear Of Missing Out): You completely miss TP2, TP3, or any massive continuation rallies. Limited Upside: You are capping your winners early, which means you need a higher win rate to be profitable long-term. 2) THE SMART FUND PROTECTOR This is the most balanced approach. This trader usually books 50% to 80% of the profit at TP1 and shifts the Stop Loss to Breakeven for the remaining position. PROS: Capital Preservation: Both the initial capital and a portion of the profit are locked in immediately. Stress-Free Runners: You are "safe" even if the trade reverses, as the worst-case scenario is breaking even on the remainder. Psychological Comfort: It is easier to hold for big targets when you have already banked money. CONS: Premature Stop-Outs: If price pulls back to entry after TP1 (a common occurrence) and then rallies, you get stopped out at breakeven and miss the big move. Regret: You may feel frustration when the market pumps hard, but you are only holding a tiny "moon bag" position. 3) THE SMART NO TRAIL TRADER This trader focuses on math over comfort. Instead of closing fully or moving to breakeven immediately, they scale out based on their initial risk. For example, if their risk was $100, they lock in $100 profit at TP1 and keep the rest running without moving the Stop Loss to breakeven. PROS: Maximum Potential: This style gives the best chance to ride big trends and catch all TPs. Balanced Math: At every TP, they cover their potential loss, ensuring the math works in their favor. Room to Breathe: By not rushing to breakeven, they avoid getting stopped out by standard market volatility before the real move happens. CONS: Reversal Risk: If the trade reverses completely from TP1, they might end up with nothing or a full loss. High Stress: Requires active monitoring, patience, and a strong stomach to watch profits turn into drawdowns during pullbacks. Whipsaw Danger: Many trades pull back after TP1. This trader risks giving back open profits in exchange for the chance of a home run. 4) THE ONE TARGET HIGH R.R. PLAYER This trader operates with a "sniper" mentality. They do not take partial profits. They only lock profit at a specific, high-value level (e.g., 1:3 or 1:5 Risk-to-Reward). It is usually "All or Nothing." PROS: Profitability with Low Win Rate: Because the winners are so big (3x or 5x the risk), you can be profitable even if you lose 60% of your trades. Efficiency: One winning trade covers multiple small losses. CONS: Low Win Rate: Since you target high rewards, price will reach your target less often. Psychological Difficulty: This requires extreme patience and experience. It is mentally painful to watch a trade go up 2R (2x profit) and then reverse to hit your Stop Loss, but that is the cost of this strategy. SUMMARY - Each style has its own specific advantages: The "Profit Locker" sleeps best at night. The "Fund Protector" survives the longest. The "No Trail Trader" maximizes trends. The "High R.R. Player" plays the long-term probability game. Choose the style that fits your risk appetite and how much time you can actively watch the charts. - TUFFYCALLS
TuffyBro
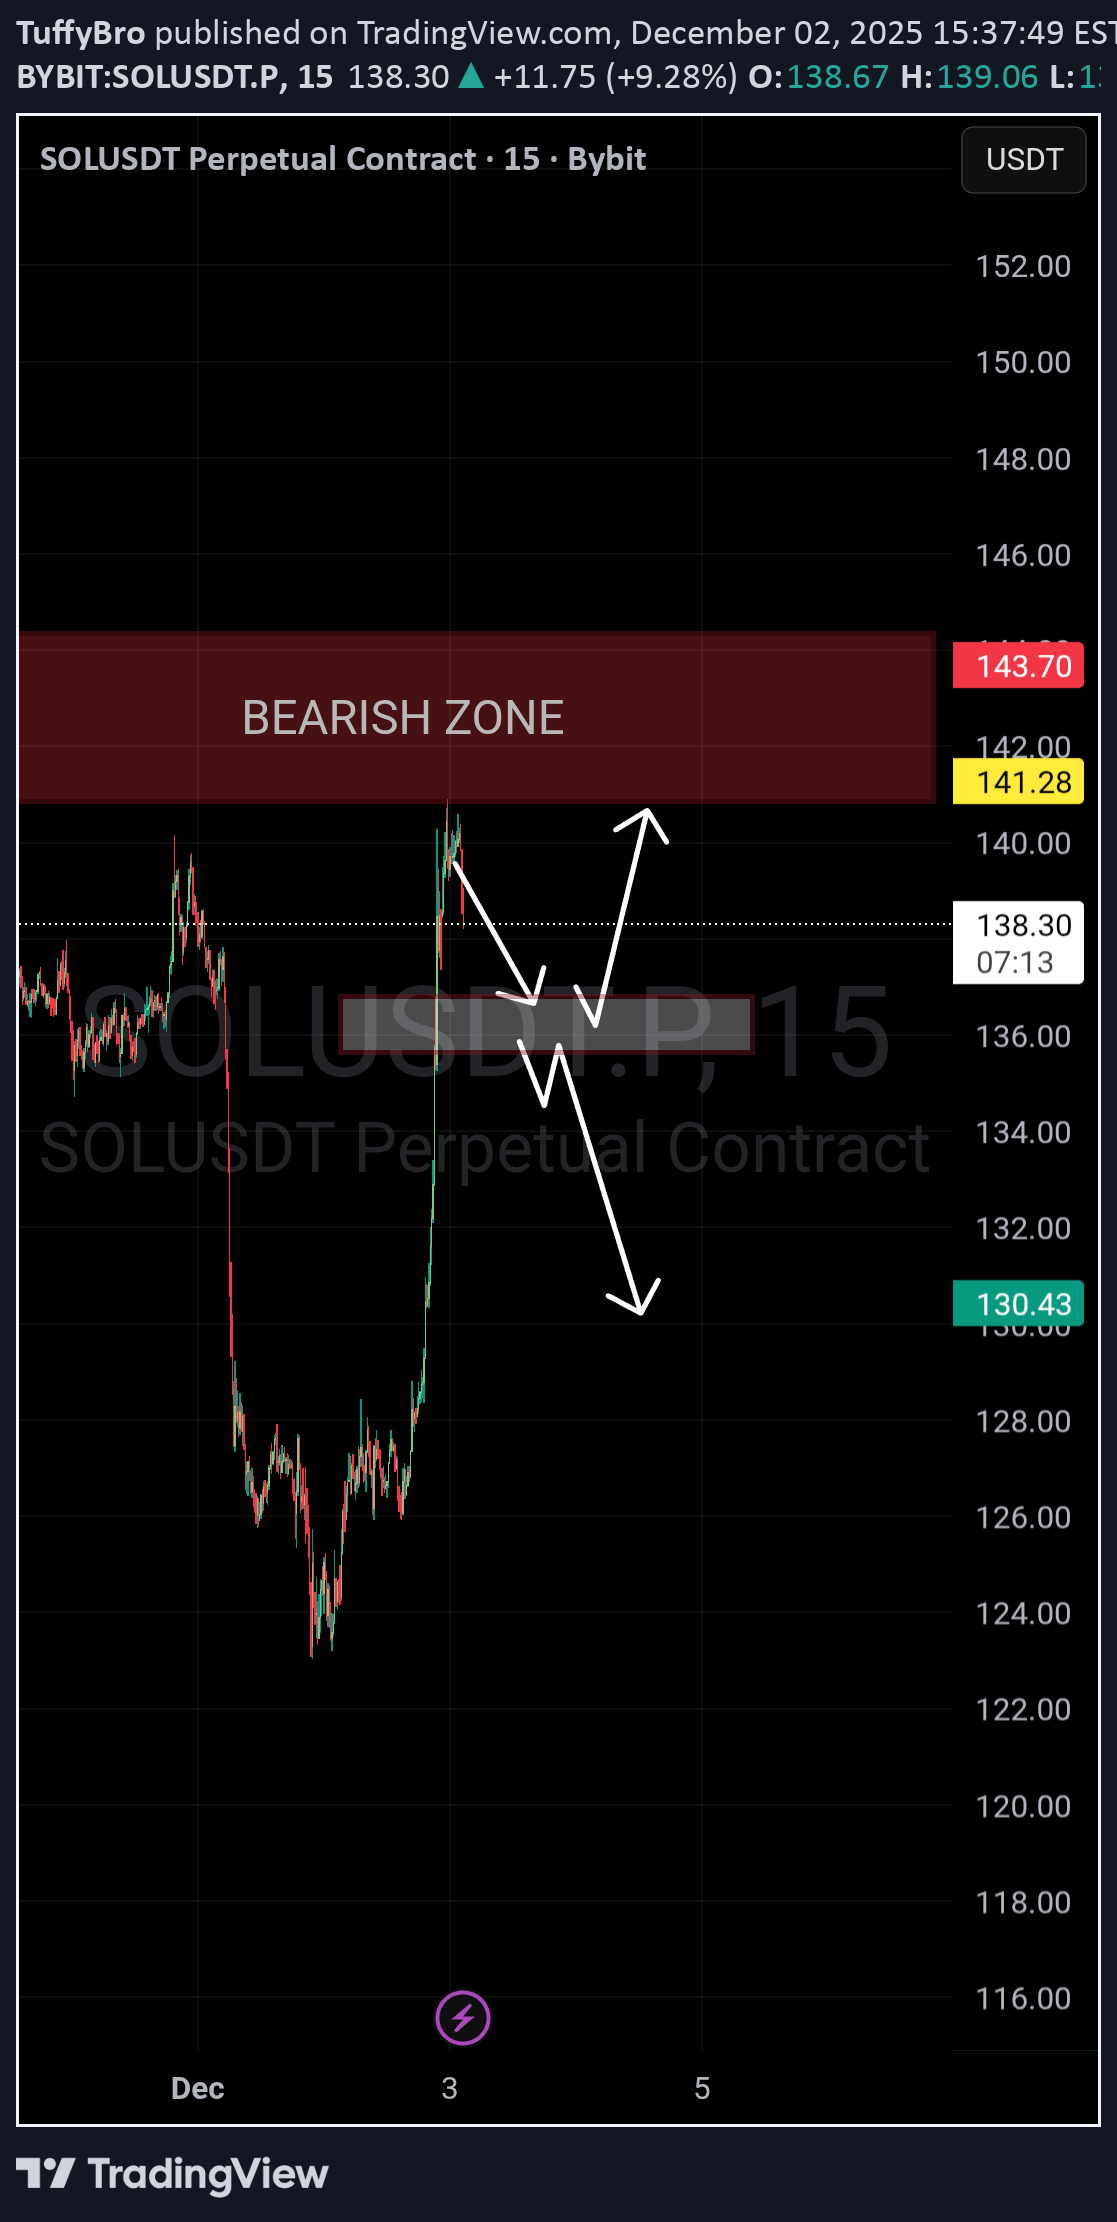
تحلیل تکنیکال سول: زمان ورود به پوزیشن خرید و سطوح کلیدی (134.50)
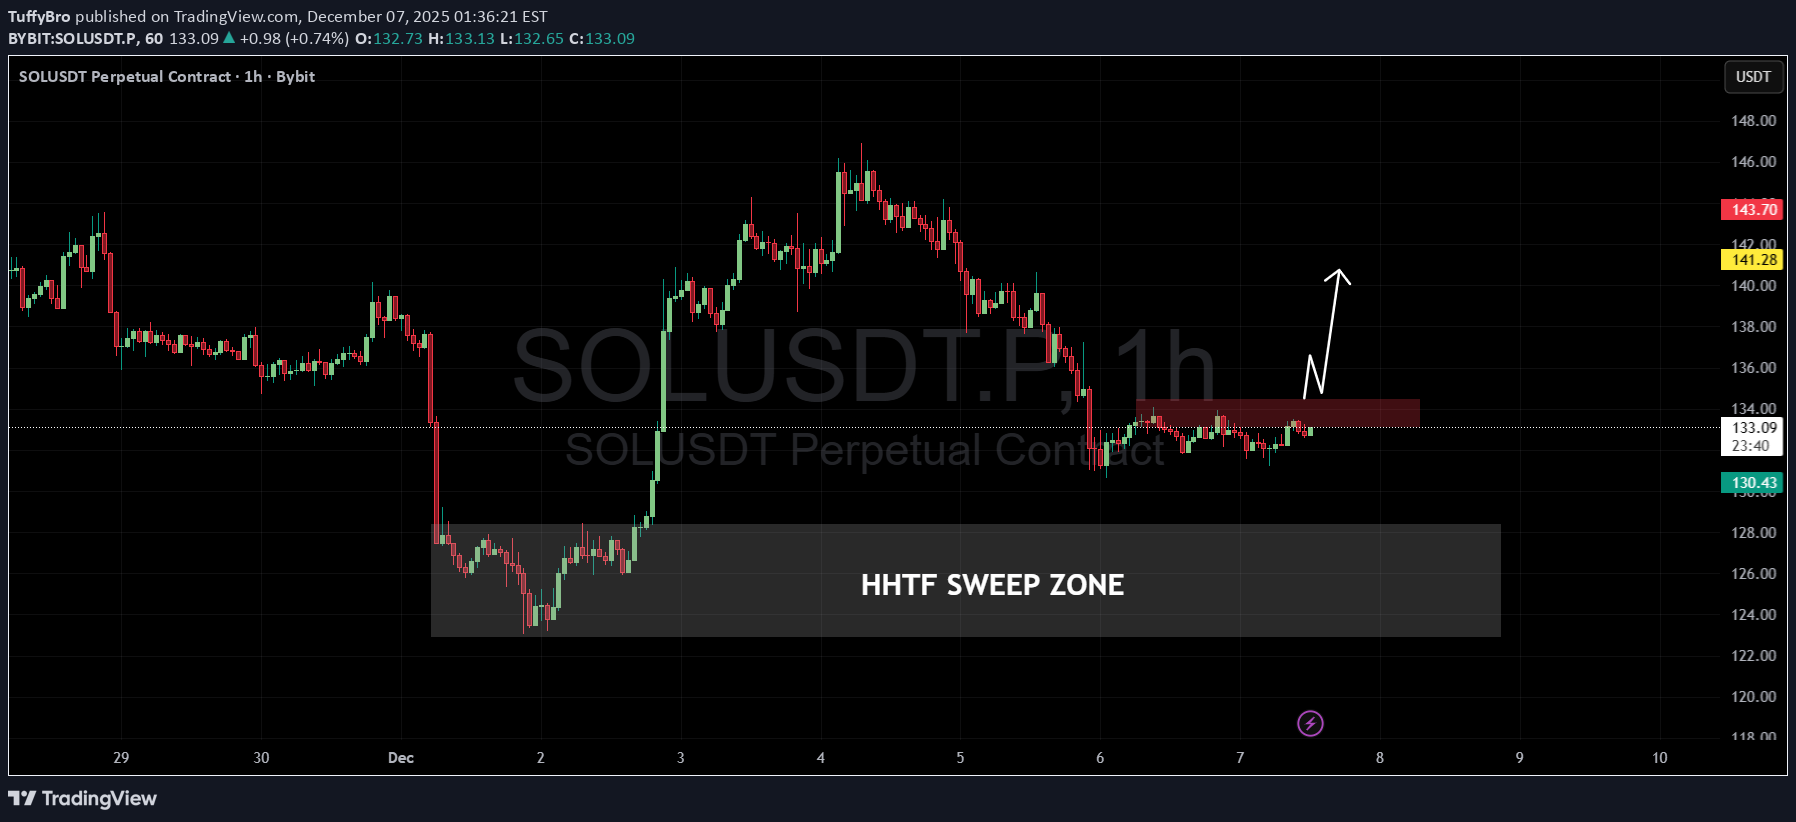
The Plan: Breakout: The price needs to close a 1-hour candle strongly above the Red Box (above ~134.50) to confirm that buyers have absorbed the selling pressure. Retest (Flip): Ideally, price pulls back slightly to turn the previous resistance (Red Box) into support. Expansion: Price continues upward toward the next liquidity targets. The chart shows a potential bullish reversal, but it is currently at a decision point. Aggressive Entry: Entering now anticipates the breakout but carries the risk of rejection at the Red Box. Conservative Entry: Waiting for the candle close above 134.50 (as per the white arrow projection) offers higher confirmation but a slightly worse entry price. The "HHTF Sweep Zone" provides a strong floor, giving this setup a defined risk-to-reward ratio if the breakout occurs.sniper entry from sweep zone !!! booking profits here
TuffyBro
TuffyBro
تحلیل حرکت بعدی ارز FART: دو سناریوی صعودی در انتظار کدام است؟
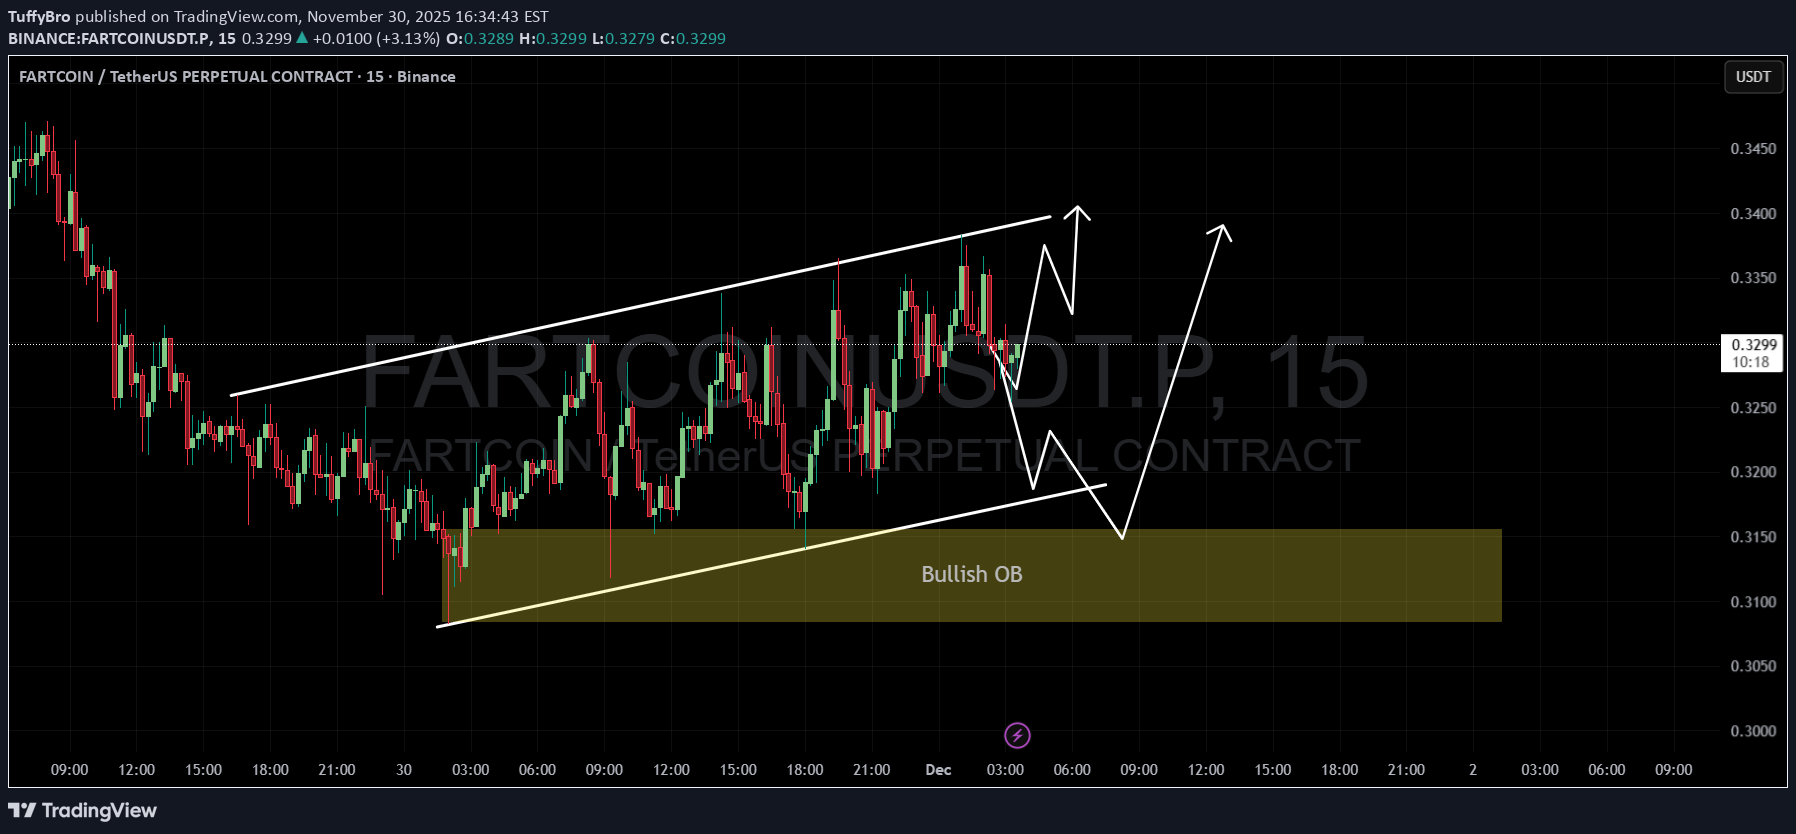
🔍 Analysis & Breakdown (My View) Market is currently moving inside a rising wedge and building liquidity on both sides. I’m keeping a bullish bias because the structure still supports an upside continuation. I see two possible scenarios here: 📌 Scenario 1: Move from CMP Price can pump straight from the current level if it breaks the wedge top cleanly. If it gives a higher-high and retest, the continuation becomes very likely. 📌 Scenario 2: Pullback to Bullish OB → Then Pump (More Probable) This is the cleaner setup for me. There’s an unmitigated bullish order block below the wedge. All the liquidity sits under these wedge lows. If price dips into that OB, sweeps liquidity, and gives a bullish reaction — that’s my best entry. This is the cleaner Smart Money model: Price breaks wedge down Falls into the Bullish OB Sweeps liquidity Reversal + sharp move up Why this scenario is strong: OB is fresh Liquidity sits below wedge lows Perfect demand + liquidity combodidnt hold ob
TuffyBro
پیشنهاد معامله فروش SPX: آیا این ارز دیجیتال غیرمنتظره قوی است؟
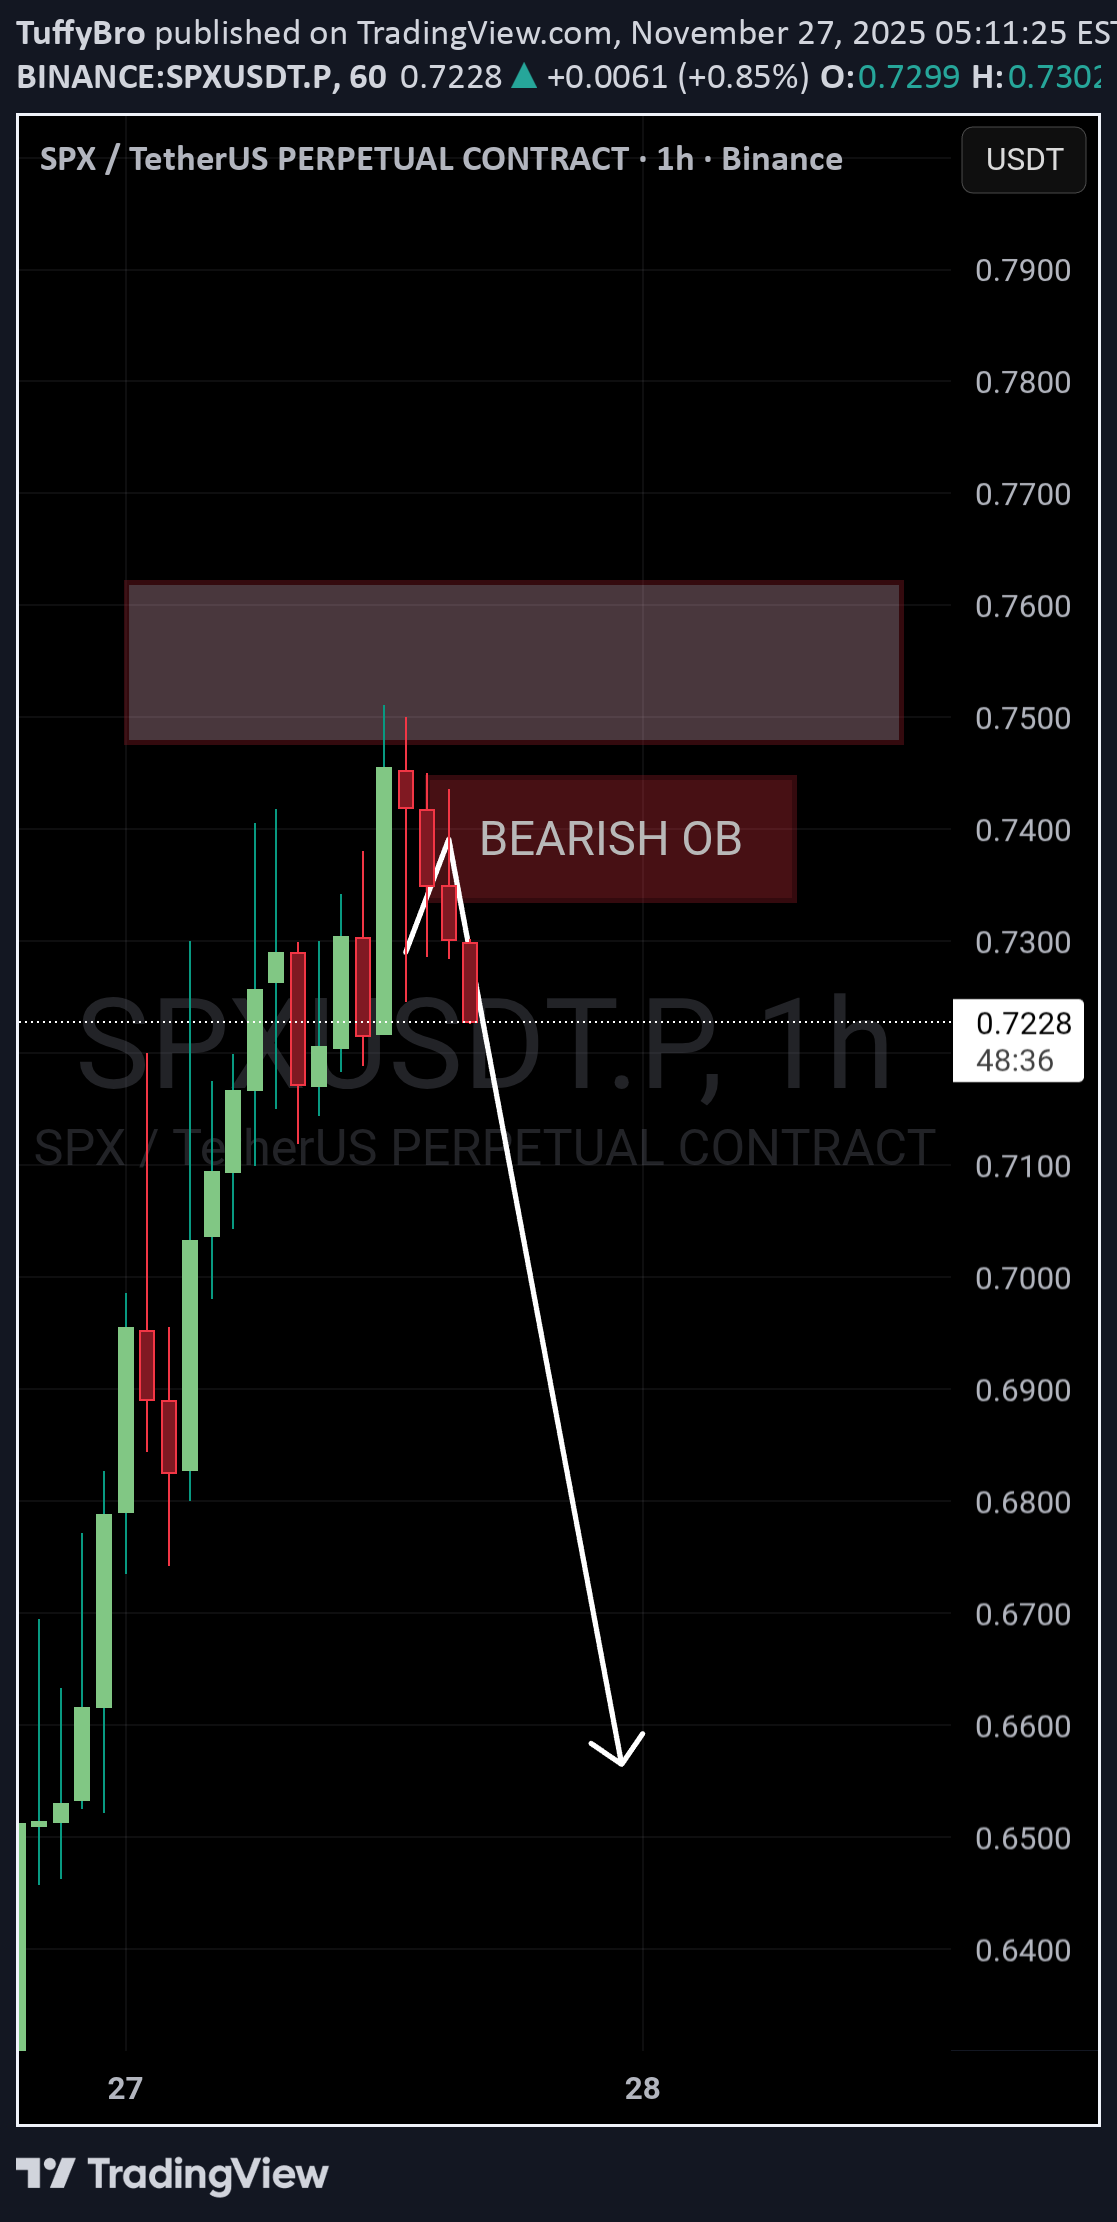
↳Shorting SPX6900 here, not sure why this shitcoin is so strong Note: not a lot of liquidity/volume on Hyperliquid, Binance futures better, if you trade other exchanges check liquidity.1.5r done to get proper signal join my premium
TuffyBro
سقوط بیت کوین ادامه دارد؟ نقطه ورود بعدی برای فروش بزرگ کجاست؟
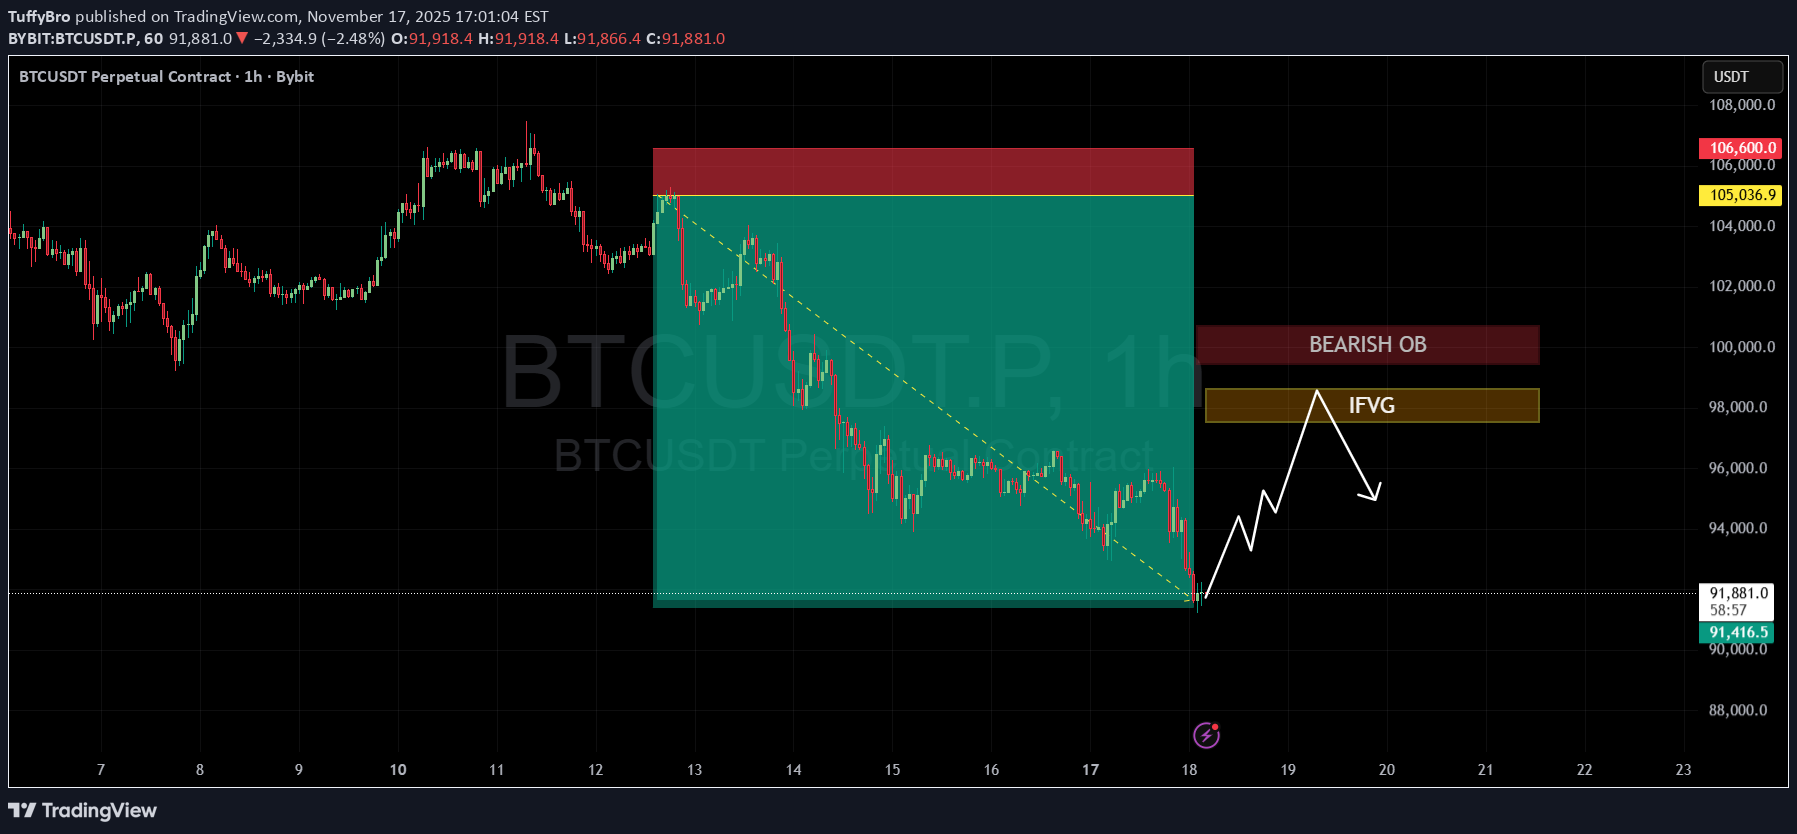
Price just took the low, exactly as anticipated. My bearish bias remains firm. Hope everyone stayed safe out there. Still looking for more downside. Now, I'm just waiting patiently for a retest of my marked zone to find another short setup.
TuffyBro
DOGE pump from cmp if holds
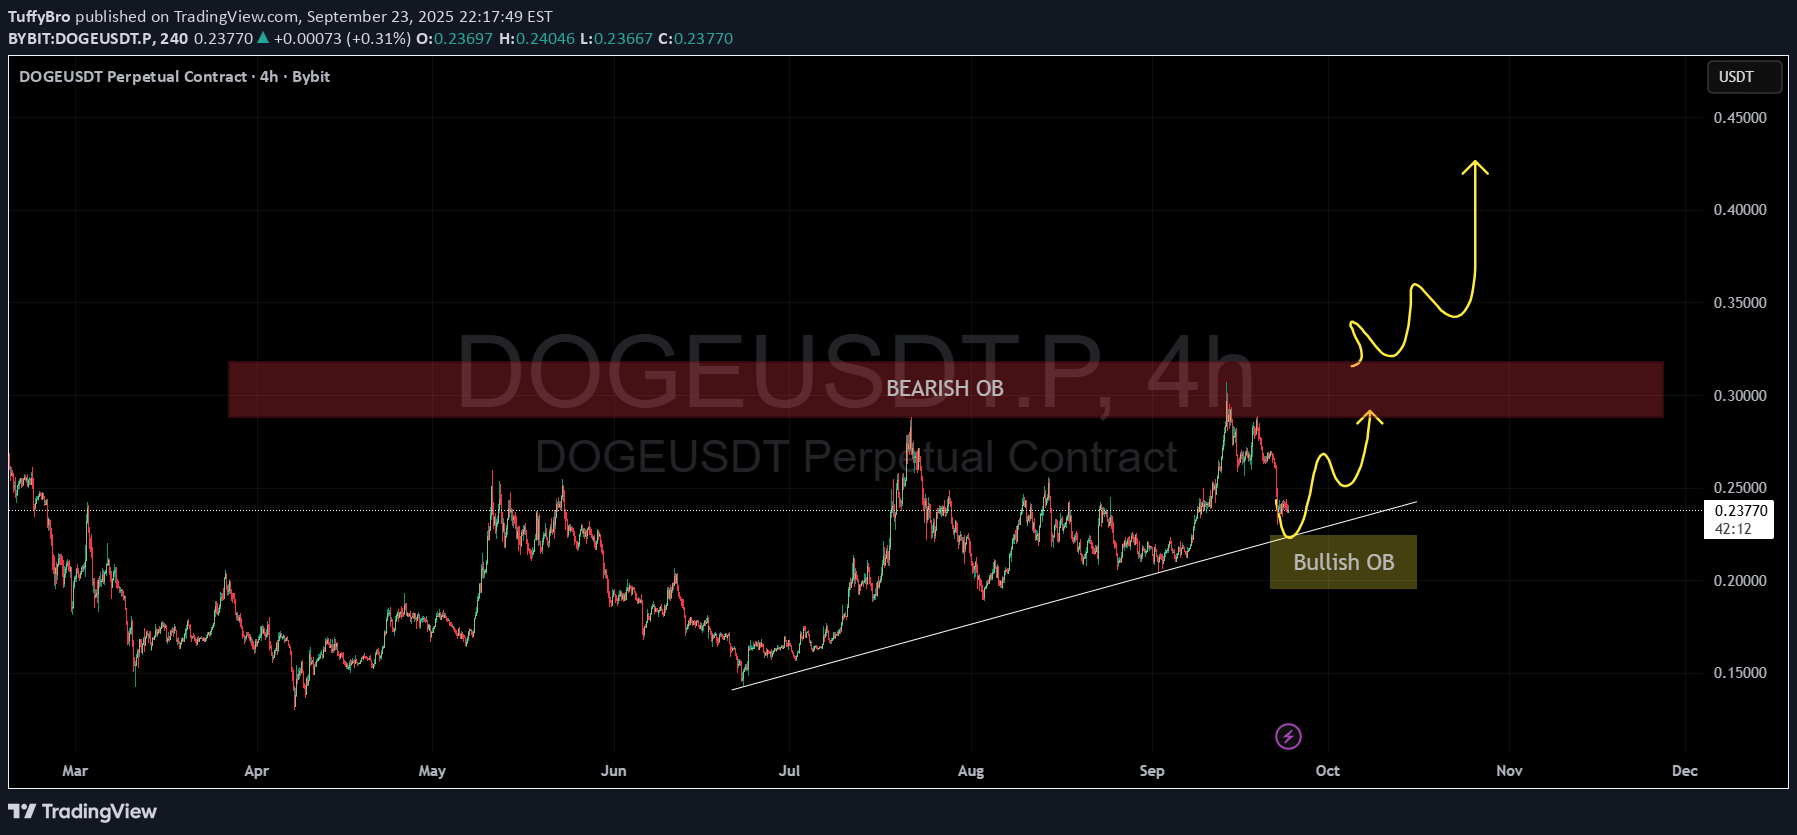
First DOGE ETF approved, if there are coins that profit off attention it’s memecoins - just liking the R/R in too many factors not to take the risk
TuffyBro
ENA can it sustain bullish ob ?
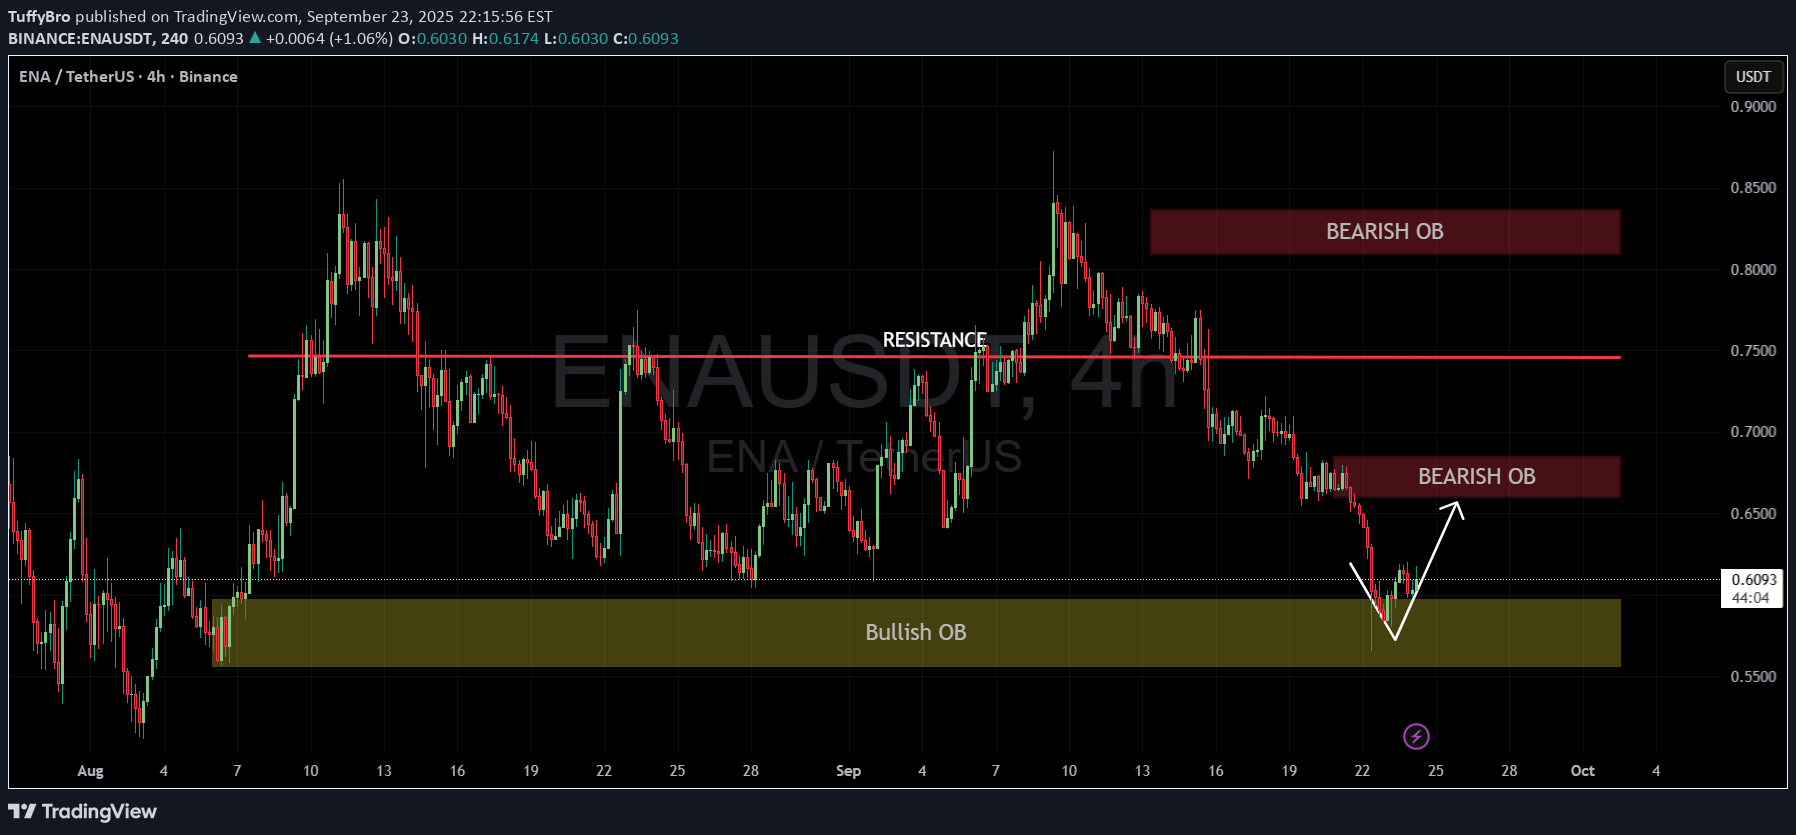
Trend: Overall bearish. Now: Price bounced from 0.55–0.60 bullish OB. Next Move: Likely push up to 0.64–0.66 bearish OB.
TuffyBro
BTC whats next ? a reversal in LTF
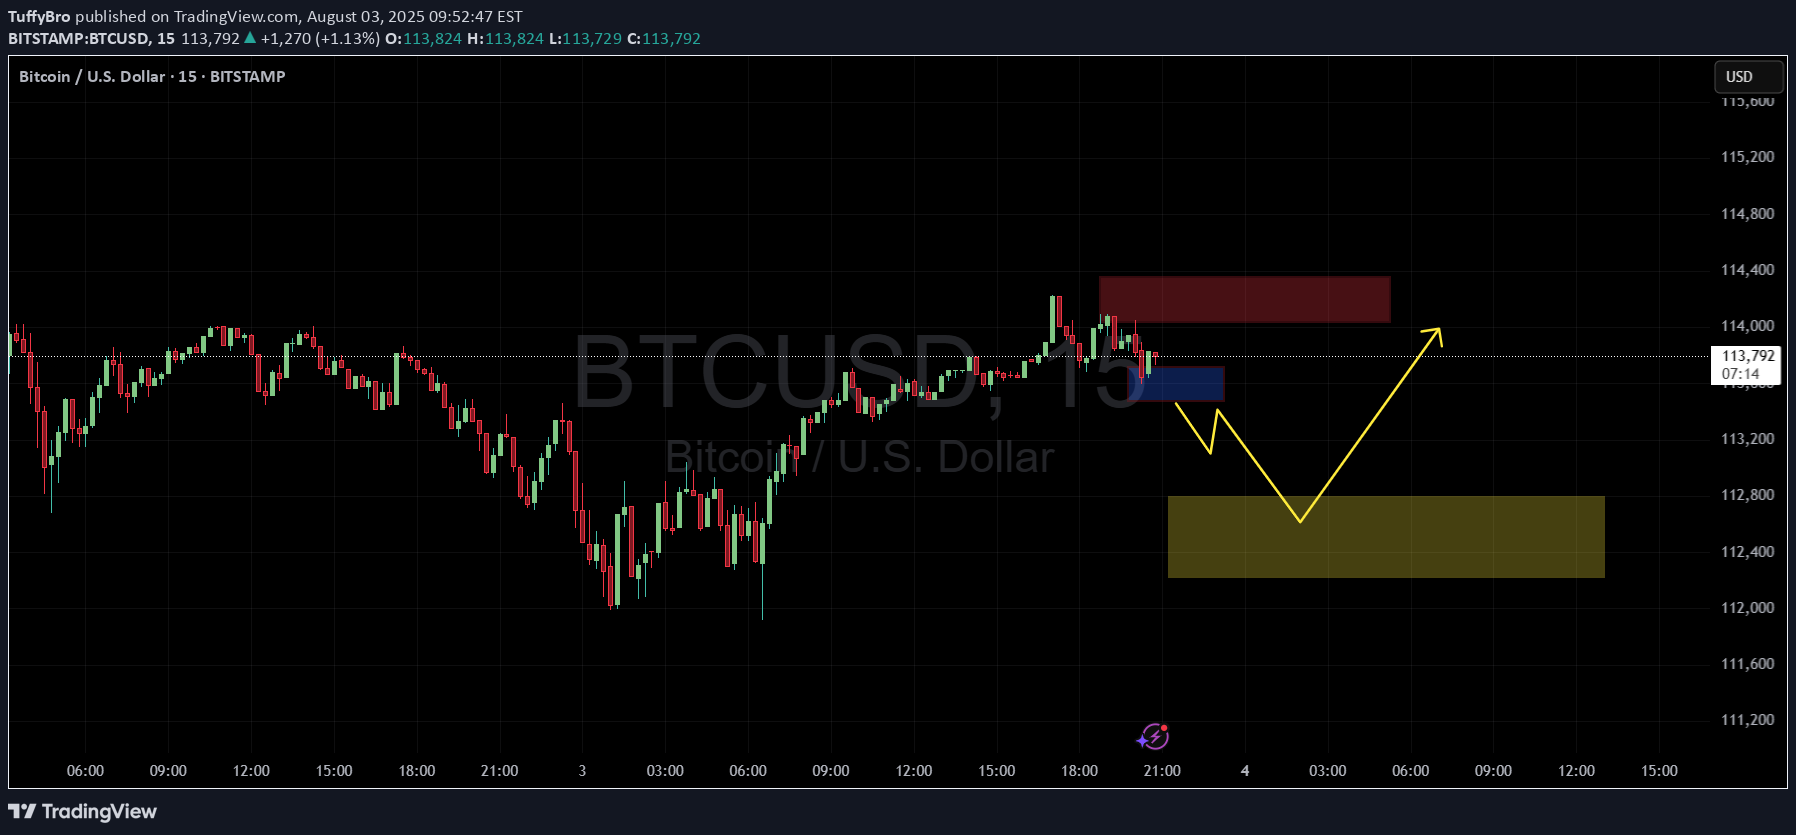
* **Blue Zone** = Minor bullish support or reaction zone * **Yellow Zone** = Major bullish order block / demand zone * **Red Zone** = Bearish supply zone or resistance --- ### 🧠 **Scenario Planning:** #### ✅ If price **holds above the blue zone**: * Expect a **bullish continuation** * Target: **Red zone** (potential resistance or reversal area) * Could be a scalp long opportunity with SL below blue #### ❌ If price **breaks below the blue zone**: * Expect a **drop toward yellow zone** * Yellow zone could act as **bullish OB** and reversal point * Possible long opportunity at yellow, targeting red again --- ### ⚠️ Key Considerations: * Wait for **reaction confirmation** at blue or yellow before entering * If BTC forms **bullish engulfing or BOS at yellow**, that’s your entry trigger * Volume and market structure confirmation will strengthen convictionpumped from blue still waiting for the yellow zone if red breaks and market structure changes will drop new market update
Disclaimer
Any content and materials included in Sahmeto's website and official communication channels are a compilation of personal opinions and analyses and are not binding. They do not constitute any recommendation for buying, selling, entering or exiting the stock market and cryptocurrency market. Also, all news and analyses included in the website and channels are merely republished information from official and unofficial domestic and foreign sources, and it is obvious that users of the said content are responsible for following up and ensuring the authenticity and accuracy of the materials. Therefore, while disclaiming responsibility, it is declared that the responsibility for any decision-making, action, and potential profit and loss in the capital market and cryptocurrency market lies with the trader.