
ACA
Acala Token
| تریدر | نوع سیگنال | حد سود/ضرر | زمان انتشار | مشاهده پیام |
|---|---|---|---|---|
No results found. | ||||
Price Chart of Acala Token
سود 3 Months :
سیگنالهای Acala Token
Filter
Sort messages by
Trader Type
Time Frame

BandForBands
شکست احتمالی ACA: فرصت طلایی سود 800 درصدی با استراتژی تجمعی
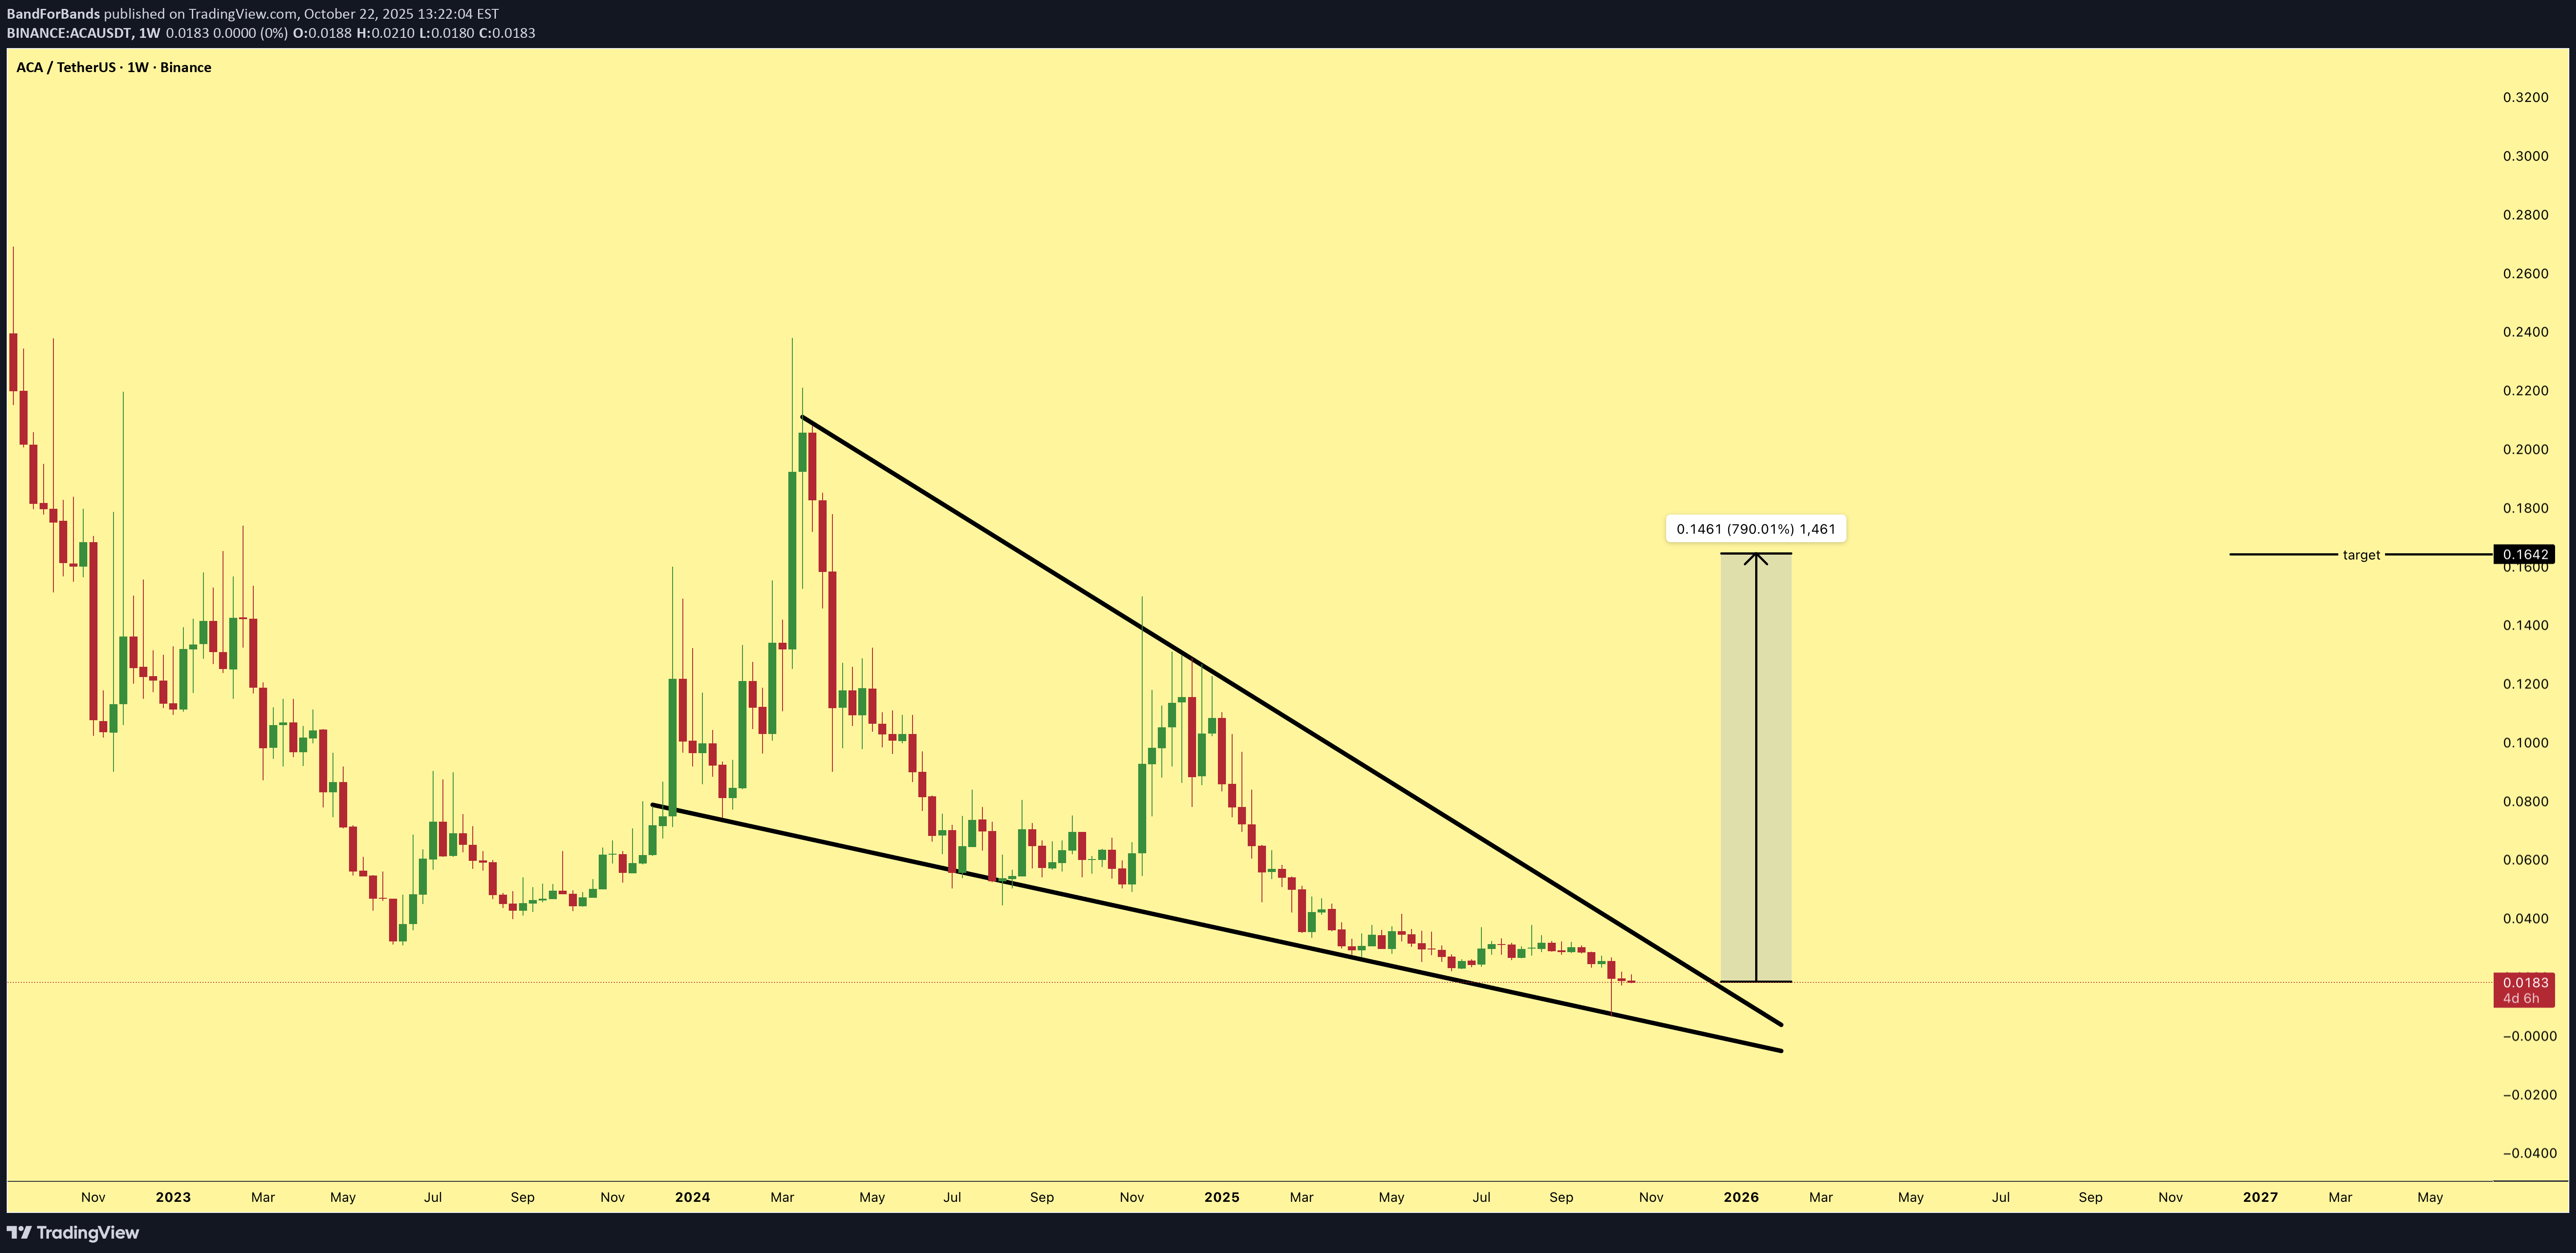
ACA is offering a solid R:R setup right now. The chart shows a clean descending wedge pattern forming near key support. A breakout from here could lead to around 800% upside potential even from a simple spot position. Great structure for patient accumulation.

Alpha-GoldFX
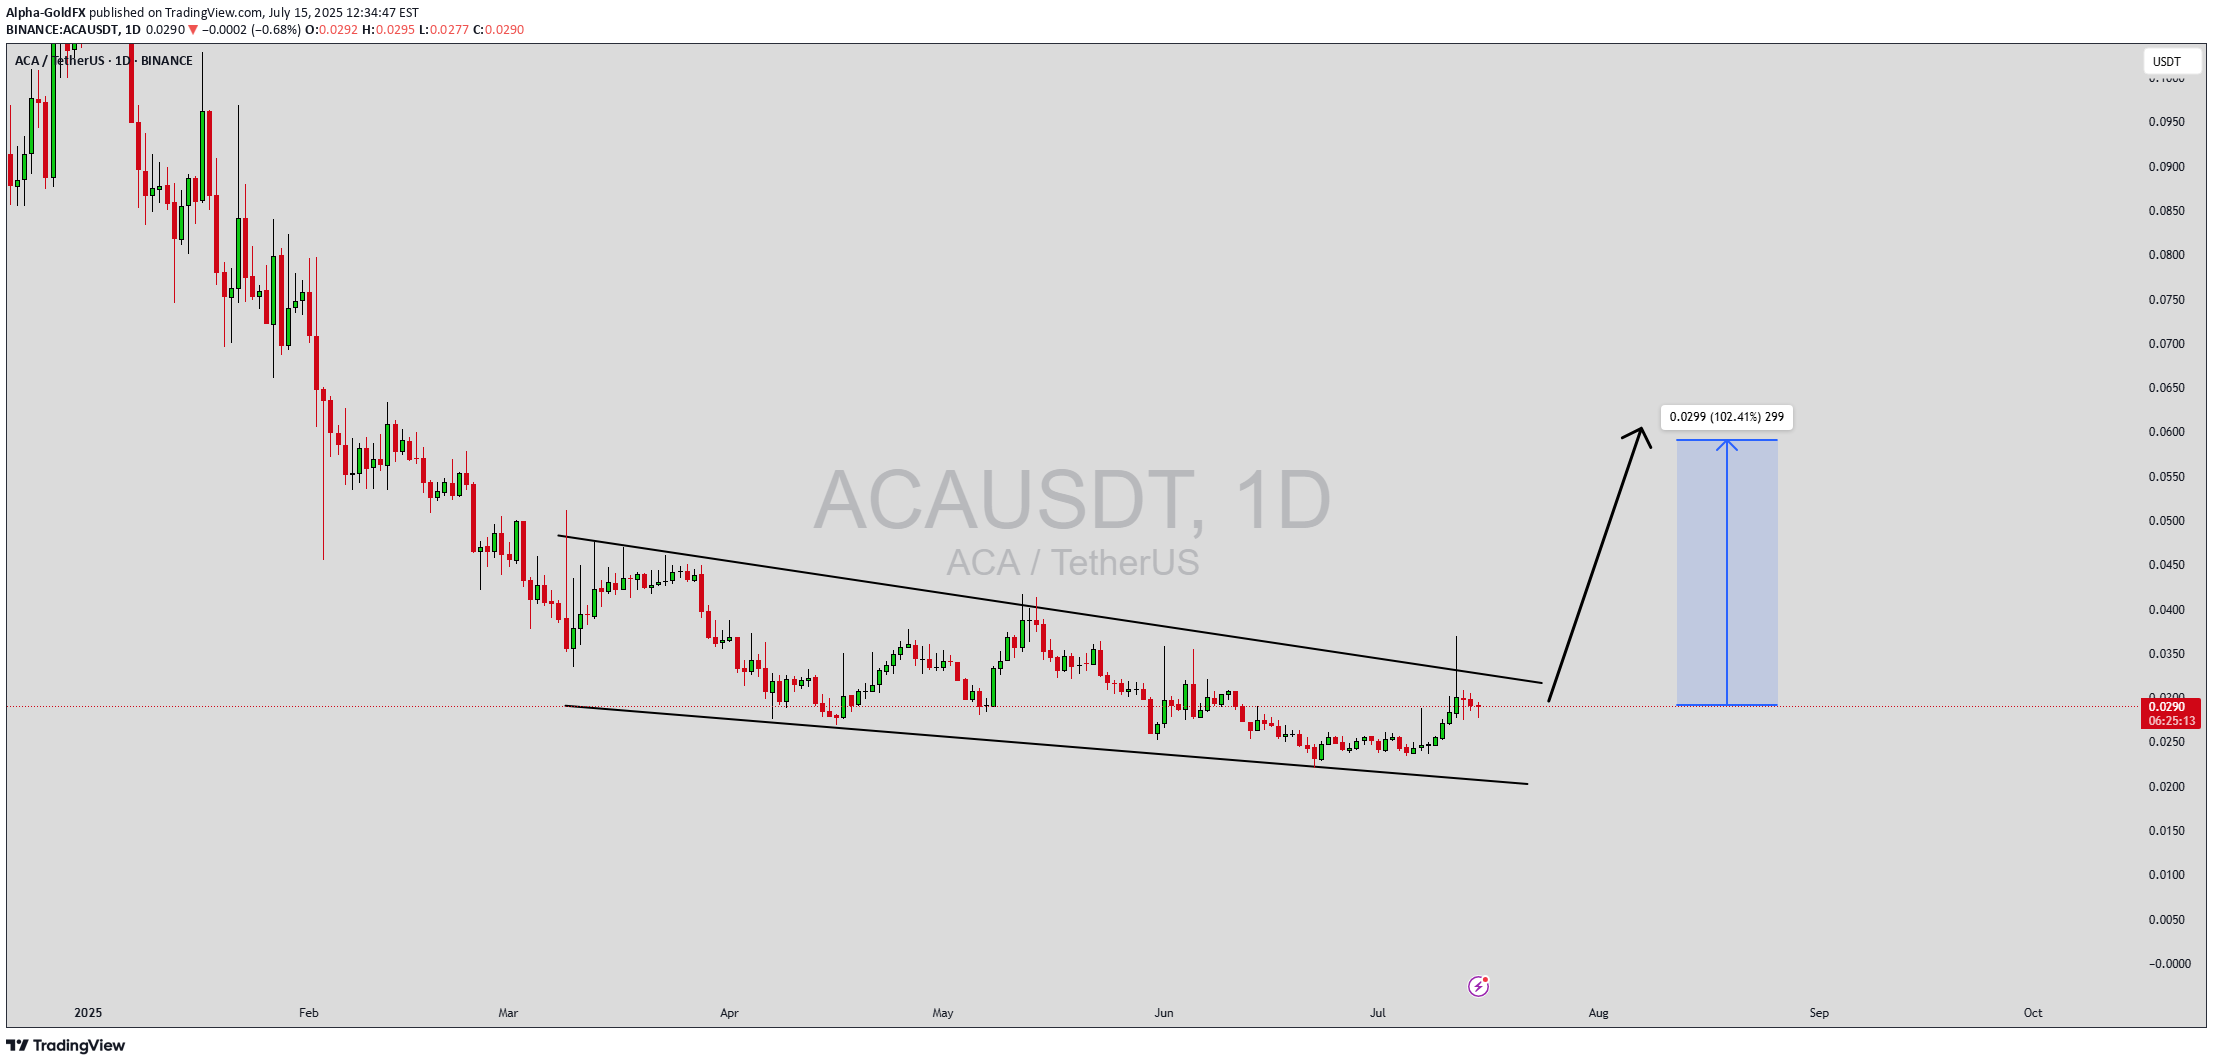
ACAUSDT Forming Falling Wedge

ACAUSDT is currently displaying a classic falling wedge pattern, which is widely recognized as a bullish reversal signal in technical analysis. This pattern suggests that while the price has been in a downtrend, the momentum is weakening, and a breakout to the upside is increasingly likely. With the narrowing price range and clear descending structure, ACAUSDT could be gearing up for a significant breakout, projecting a potential gain of 90% to 100% in the upcoming sessions. Trading volume remains supportive, showing strong interest among both retail and institutional traders. This steady volume behavior within a wedge pattern often precedes a powerful bullish impulse. It indicates accumulation is taking place while weaker hands exit, setting the stage for a breakout rally once a key resistance level is breached. From a technical standpoint, falling wedges typically act as launchpads during market bottoms. In ACA’s case, the overall market sentiment around innovative DeFi projects further enhances its rebound potential. If ACA can sustain its current support zone and break above the wedge resistance with volume confirmation, traders could see substantial upside in a short time frame. ✅ Show your support by hitting the like button and ✅ Leaving a comment below! (What is You opinion about this Coin) Your feedback and engagement keep me inspired to share more insightful market analysis with you!
Alpha-GoldFX
ACAUSDT Forming Descending Channel
ACAUSDT is shaping up to be an exciting crypto pair to watch, as it is currently trading within a well-defined descending channel pattern. This technical setup is widely recognized by traders as a potential bullish reversal indicator once the price breaks out above the upper trendline. The consistent formation of lower highs and lower lows within the channel reflects a controlled pullback phase, setting the stage for a significant breakout that could deliver gains in the range of 90% to 100%+. The good trading volume backing ACAUSDT’s current moves adds more conviction to this pattern. Increasing volume during a breakout from a descending channel often signals strong buying interest and growing momentum. This pattern has historically rewarded patient investors who can identify early signs of a reversal and position themselves accordingly. Many crypto traders actively search for descending channel breakouts to capitalize on explosive price moves that follow. Investor sentiment around ACAUSDT is turning increasingly positive as more participants take notice of this project’s fundamentals and technical signals. This growing interest is helping to build a solid base of support, making a breakout even more likely. If the overall crypto market remains favorable, ACAUSDT could attract significant capital inflow once the breakout confirms, driving the price well beyond current levels and potentially outperforming many other altcoins. ✅ Show your support by hitting the like button and ✅ Leaving a comment below! (What is You opinion about this Coin) Your feedback and engagement keep me inspired to share more insightful market analysis with you

MasterAnanda
Acala Hits Bottom, Which Means Bull Market Next (2800-3500% PP)
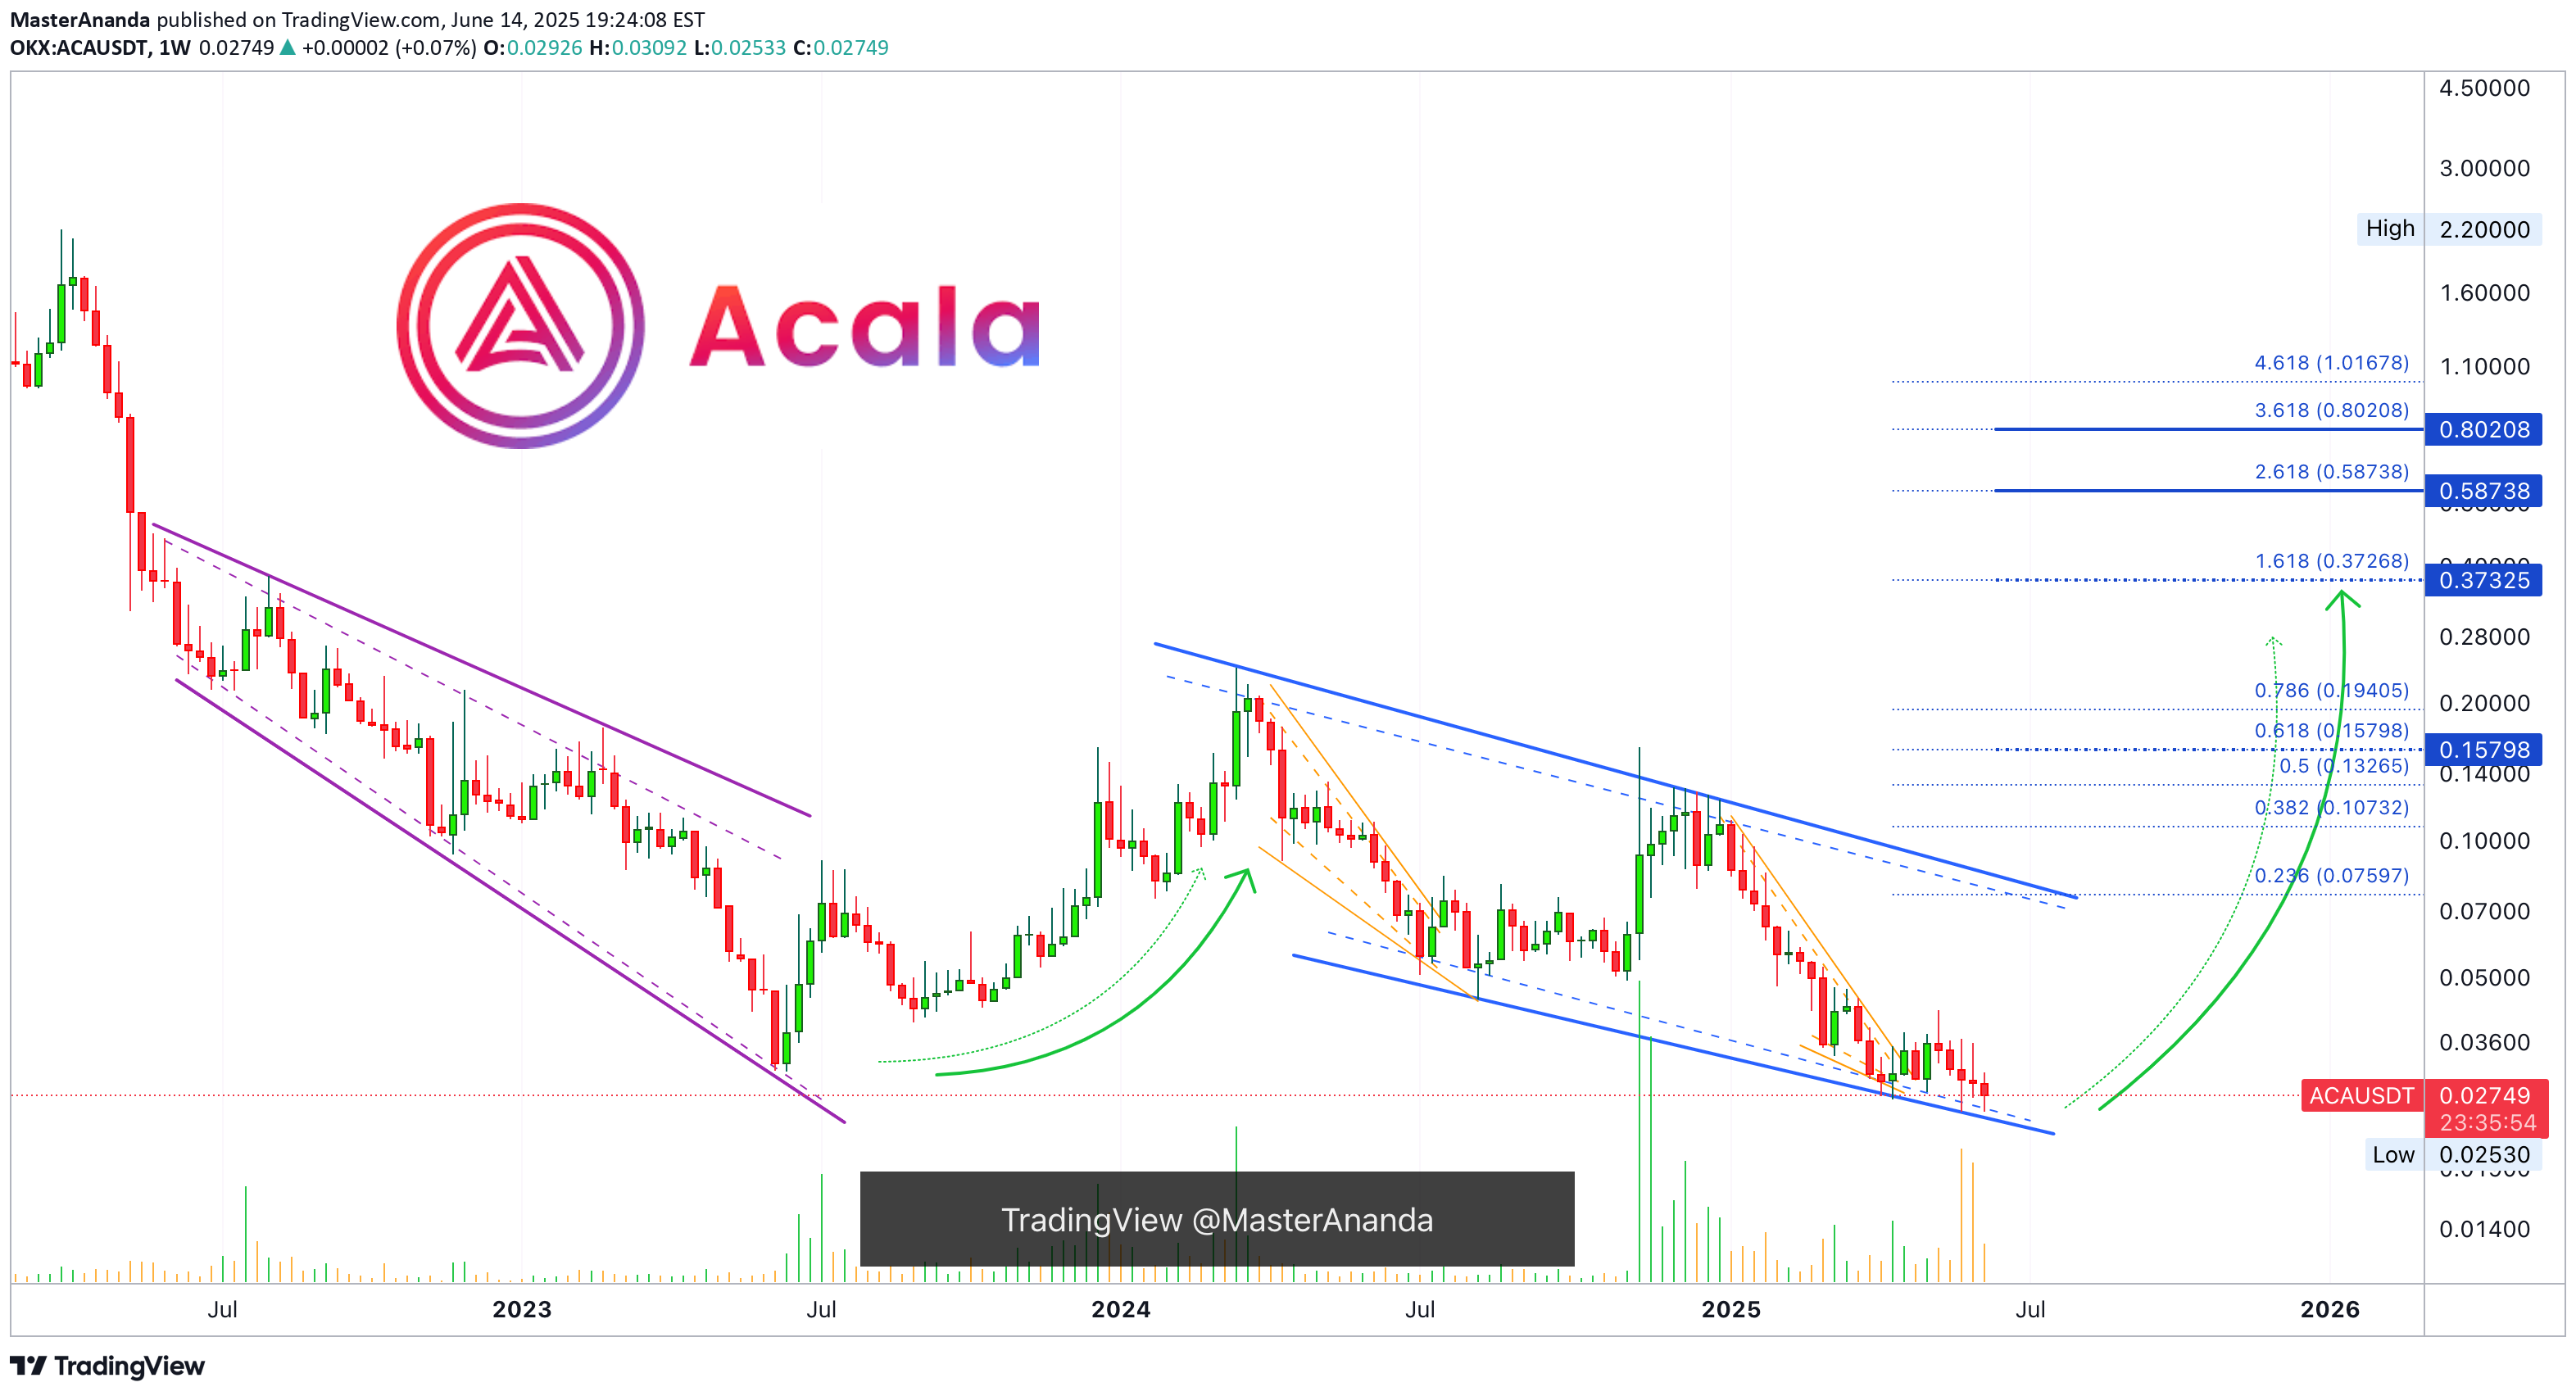
Acala is now five weeks into the fire. If you read often you will understand clearly what I mean; if you are new, this might not make much sense.The low happened 14-April here, ACAUSDT. Some weak action and then red. Five weeks red and the action remains relatively sideways, not much change in price.Current price trades above the 14-April low. The 14-April low was 0.02698. Current price is higher. Five weeks red, high bearish volume and yet, no new major lows.Notice the drop from early December 2024 until April 2025. Five weeks red can cover a huge distance, there can be a strong decline. When you see five weeks red but no change in price, this is a bullish signal. It means that the bears have no strength. It means we are not seeing a bearish trend nor a bearish impulse, instead, a retrace and stop-loss hunt. Since bearish pressure is non-existent and after weeks of selling prices aren't going any lower, we can predict change soon.This change is bullish. The bullish signal comes from the fact that the bearish action is just too weak. It is like seeing prices trading near resistance (say a new all-time high) for weeks, months with no advance. This would reveal that the top is in and a crash comes next. In this case, the bottom is in and a bull market will follow.Thank you for reading.Namaste.

CryptoNuclear

Bithereum_io
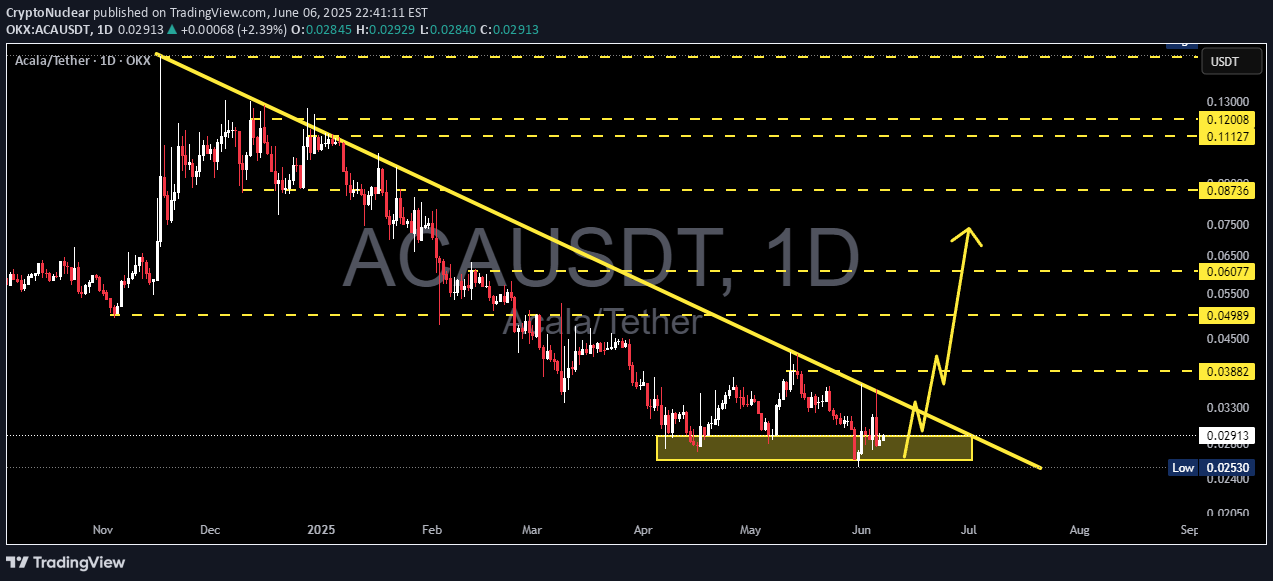
ACAUSDT 1D

#ACA is trading inside a Descending Channel on the daily chart — a pattern that often leads to a bullish breakout.If the price manages to break above the channel resistance and the daily EMA50, we could see upside momentum toward the following targets:🎯 $0.0335🎯 $0.0382🎯 $0.0475🎯 $0.0613⚠️ Always use a tight stop-loss to manage risk and protect your capital.
Alpha-GoldFX
ACAUSDT forming a falling Wedge

ACAUSDT is currently displaying a strong falling wedge pattern—a historically bullish reversal structure that typically precedes sharp breakouts. After a prolonged downtrend, the price has formed lower highs and lower lows within a narrowing channel, suggesting decreasing selling momentum. The recent price action bouncing off the wedge's lower boundary, combined with a solid spike in volume, indicates a potential bottom formation and growing buyer interest.Acala (ACA), known for its role in the Polkadot ecosystem as a decentralized finance hub, continues to show fundamental promise. With DeFi narratives heating up again and more liquidity flowing back into the Polkadot parachain ecosystem, ACA is regaining the attention of crypto investors and traders alike. Technical and fundamental convergence here is strong—making it a potential high-reward candidate for short- to mid-term bullish plays.If this breakout confirms with strength above the wedge resistance, the projected price move could reach up to 90% to 100%+ based on measured move theory. Such breakouts often accelerate quickly due to short covering and renewed speculative interest. This is supported by rising trading volume and increased chatter among crypto communities, pointing toward renewed bullish momentum for ACAUSDT.From a risk-reward perspective, the current zone near the wedge support offers an attractive entry for swing traders aiming to capitalize on the upcoming breakout. With multiple confluences lining up technically and fundamentally, this setup is one worth watching very closely.✅ Show your support by hitting the like button and✅ Leaving a comment below! (What is You opinion about this Coin)Your feedback and engagement keep me inspired to share more insightful market analysis with you!

RiskandReward
Aca usdt 1g

در نمودار روزانه، شکست رخ داده و پولبک انجام شده است. اگر بازار روند نزولی پیدا نکند، میتواند به ترتیب به اهداف سود (TP) تعیین شده برسد. توصیه سرمایهگذاری نیست.

Zorroreny
ACA - preparing for strong move up

ACA bounced from bottom and corrected back to form what it seems expanded flat correction where we have one more impulse up. If this is expanded flat correction then we will get 5 wave impulse to fibb 0.5 range (wick above previous pivot).On other side pattern is also similar to what XRP did (with exception that XRP did higher low in correction) so we can also develope full impulse leading to new ATH - how to recognise it? 1st step is breakout of local channel, test of breakout and then strong push past fibb 0.5 (yellow box) which would negate expanded flat correction scenario and make this a full power impulse with first TP points being at ATH range and at fibb 1.272 extension.
MasterAnanda
Acala Hits Bottom —Pre 2025 Bull Market Buy Opportunity

Let's start with the long-term linear chart for perspective.In this chart, we can see that the major decline ended in late 2022. All the action afterward is sideways.Then we can notice the candles becoming ultra-small. This is the confirmation that the market is in a period of consolidation. At some point, the consolidation period ends and a new market cycle starts, the bull market.Now, notice the far right, present day. Acala is trading at bottom prices and what happens? The highest volume ever, clearly visible; whales are buying.So after years of sideways and strong new lows, buy activity goes off the chart. Those in the know are loading up and getting ready because Crypto is about to grow. The biggest growth cycle since 2021.Thanks a lot for your continued support.This is a friendly reminder. The best time to buy is now, when prices are low trading near support.Namaste.
Disclaimer
Any content and materials included in Sahmeto's website and official communication channels are a compilation of personal opinions and analyses and are not binding. They do not constitute any recommendation for buying, selling, entering or exiting the stock market and cryptocurrency market. Also, all news and analyses included in the website and channels are merely republished information from official and unofficial domestic and foreign sources, and it is obvious that users of the said content are responsible for following up and ensuring the authenticity and accuracy of the materials. Therefore, while disclaiming responsibility, it is declared that the responsibility for any decision-making, action, and potential profit and loss in the capital market and cryptocurrency market lies with the trader.