
ProjectSyndicate
@t_ProjectSyndicate

ما هو الشيء الذي ننصحك بشراءه من المواد الغذائية؟
سابق في الشراء
پیام های تریدر
مرشح
فروپاشی بزرگ بیت کوین در ۲۰۲۶: آیا BTC تا ۳۰,۰۰۰ دلار سقوط میکند؟
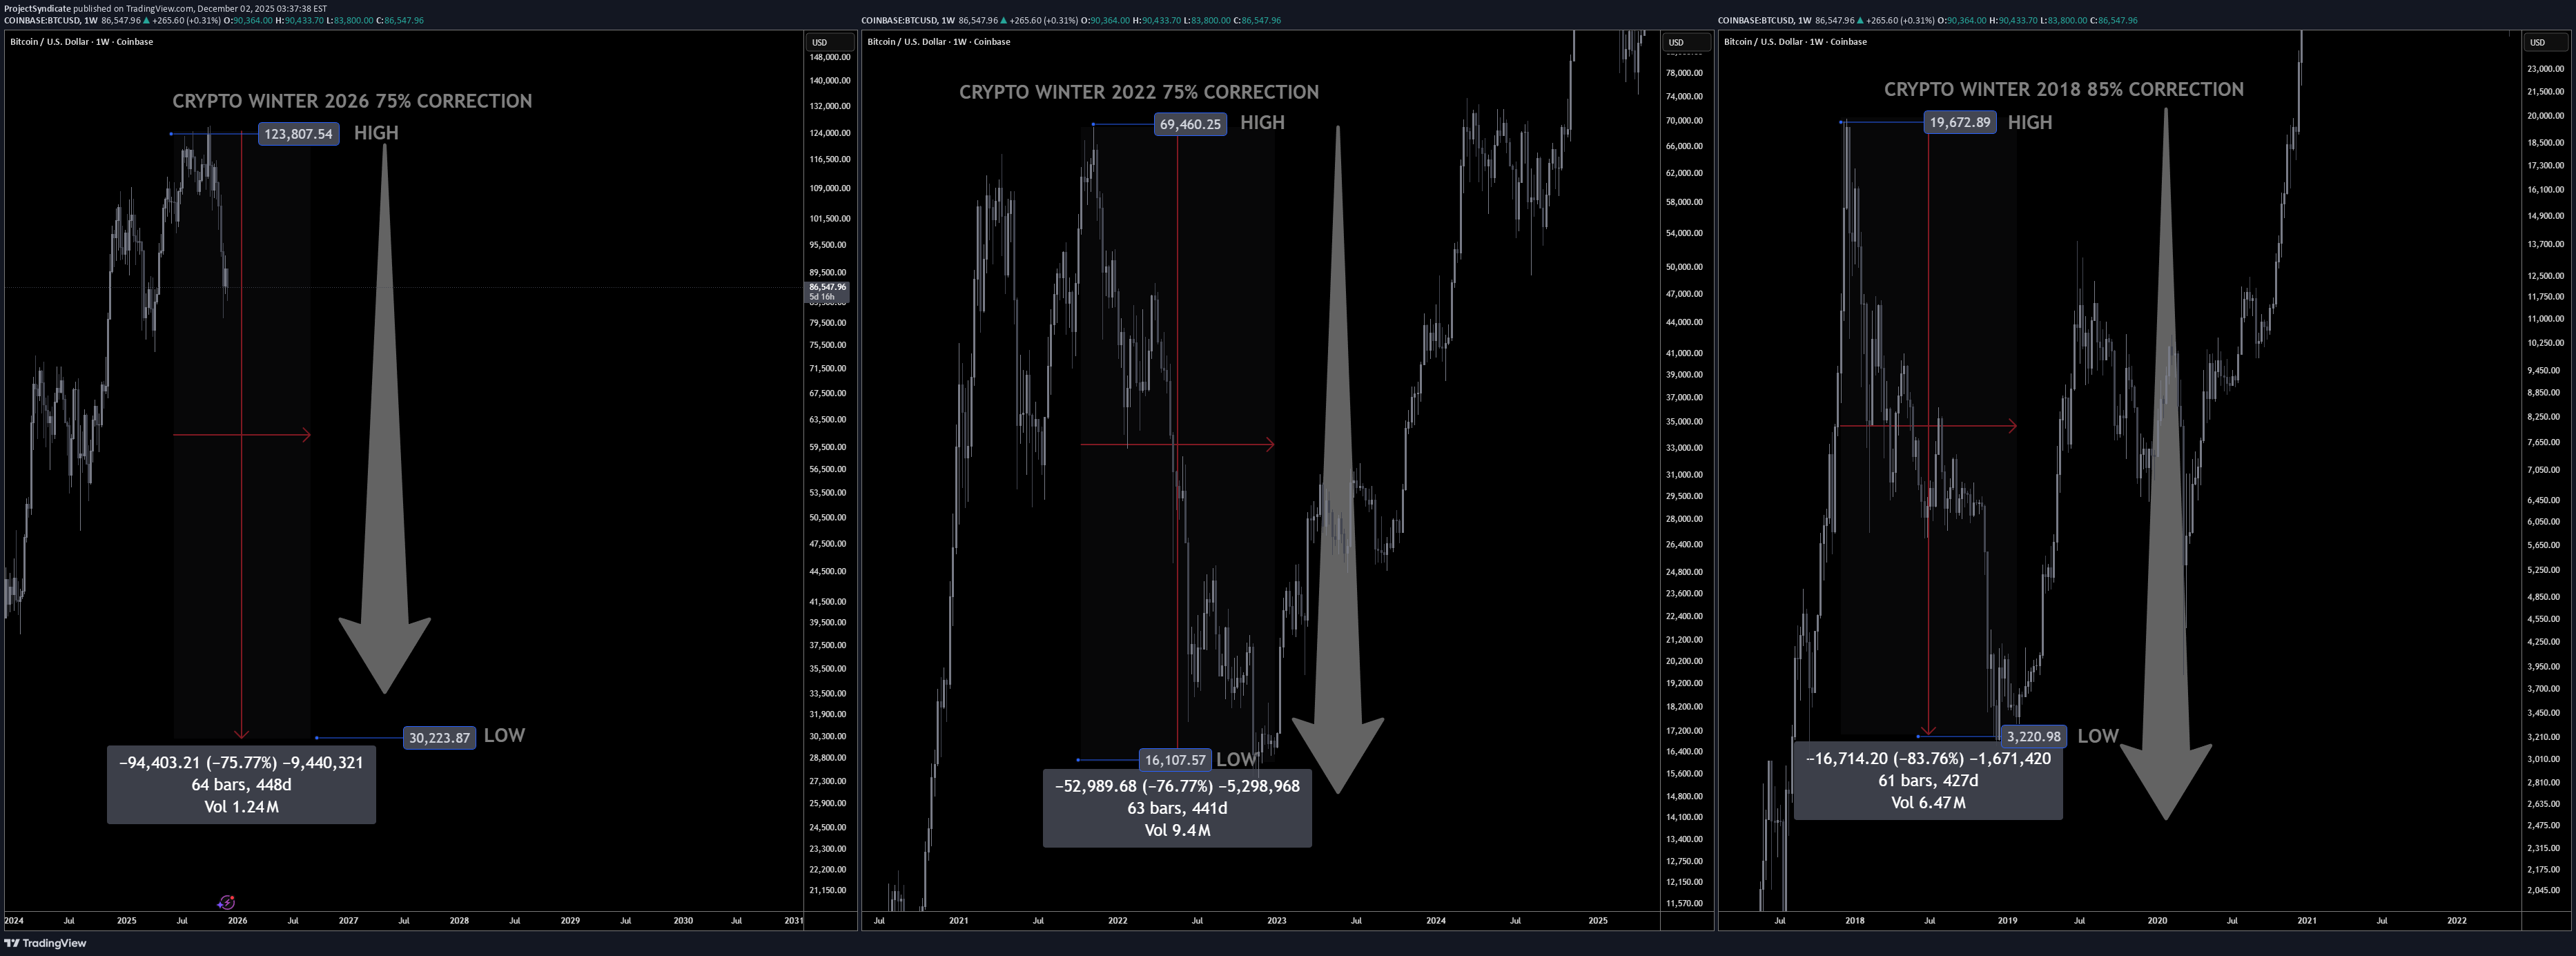
Investment Memo: Anticipating a 2026 Bitcoin Crypto Winter By ProjectSyndicate ________________________________________ 1. Executive Summary ❄️ Summary view: This memo treats 2026 as the high-probability crypto winter year for Bitcoin following the 2024 halving, with a working top around 123,000 USD and an expected cycle low near 30,000 USD, implying roughly a 75–76% drawdown from the peak. This is fully consistent with historical Bitcoin bear markets, which have typically seen 75–85% corrections from all-time highs. ❄️ Contrarian hook: While mainstream narratives still focus on ETFs, institutional adoption, and “crypto as macro asset,” the explosion of leverage (Aster DEX up to 1001x), CZ-backed perps, and BNB-chain meme-coin mania are treated here as late-cycle excess—classic topping signals rather than sustainable foundations. ________________________________________ 2. Thesis & Target Range 📊 Cycle top assumption: cycle high of ~123,000 USD per BTC. That is well within the band implied by recent ATH prints ~125–126k in mid-2025 and aligns with a typical “blow-off” overshoot above the prior psychological milestone at 100k. 📊 Cycle low assumption: 30,000 USD downside target represents a drawdown of ~75.6% from 123,000 USD—slightly shallower than the 2018 crash (~84%) and broadly in line with the 2021–22 bear (~77% from 69k to ~15–16k). That keeps this winter brutal but not apocalyptic, consistent with a maturing asset still capable of deep mean reversion. 🧮 Math check on prior winters •2017–18: 19k → 3k ≈ 84% drawdown •2021–22: 69k → 16k ≈ 77% drawdown •2025–26 (your base case): 123k → 30k ≈ 76% drawdown This places scenario squarely inside the historical corridor of 75–85% post-peak corrections. ________________________________________ 3. Historical Pattern: Why Large Drawdowns Are the Base Case 📉 Structural volatility: Bitcoin’s entire price history is punctuated by massive post-parabolic drawdowns—early cycles saw 86–93% collapses, later ones 75–80%. Each halving-to-peak run has ended in a violent crash once marginal buyers are exhausted and leverage saturates. 📉 Time dimension: Historically, the “winter” phase has lasted 9–18 months from peak to capitulation and then a long grinding accumulation. The 2017 peak to 2018–19 bottom spanned roughly a year; the 2021 peak to 2022–23 nadir similarly took about a year, with a further period of sideways chop. 📉 Drawdown normalization: Traditional asset allocators increasingly frame Bitcoin as an alternative macro asset, but the statistical reality is unchanged: drawdowns of 70%+ are not outliers—they are typical. An assumption of only shallow corrections is the non-consensus view; a 75% winter is actually the boringly normal scenario from a historical distribution standpoint. ________________________________________ 4. Where We Are in the Current Cycle ⏳ Post-halving positioning: The fourth Bitcoin halving occurred in April 2024, cutting block rewards to 3.125 BTC and effectively tightening supply. Historically, the major blow-off tops occur 12–18 months after halving, as reduced supply + narrative momentum pulls in late-stage retail and leverage. ⏳ Evidence of late-cycle behavior: By mid-2025, Bitcoin had already pushed to new ATHs above 100k and then into the ~120–126k region, with growing signs of ETF saturation, institutional FOMO, and leverage-driven upside. From a purely cyclical lens, we are more likely in the “euphoria / distribution” band than in early bull territory. ________________________________________ 5. Aster DEX & Meme-Coin Mania as Contrarian Top Signals 🚨 Aster DEX as the “Hyperliquid of BNB Chain”: Aster DEX, emerging from APX Finance and Astherus and explicitly leveraging Binance’s network, is marketed as a high-performance perp DEX with MEV-resistant trading and leverage up to 1001x, backed by CZ/affiliate ventures. From a contrarian perspective, this is textbook late-cycle: maximum leverage offered to the broadest possible audience at or near cycle highs. 🚨 BNB meme-coin carnival: Simultaneously, BNB-chain meme coins and speculative listings (Maxi Doge, PEPENODE, various new BNB meme projects) are being pushed as high-beta “next 100x” plays. Historically, similar episodes—2017 ICOs, 2021 dog-coin and NFT mania—have coincided with or slightly lagged Bitcoin’s macro top rather than signal early-cycle value. 🎭 Narrative pattern recognition: In prior cycles, the market’s center of gravity shifted from Bitcoin to highly speculative edges (ICOs, NFTs, obscure DeFi, meme coins) at the very end of the bull. Late-cycle liquidity rotates into lottery tickets while BTC quietly transitions from “must own” to “source of funds.” The current Aster + BNB meme complex rhymes strongly with that historical script. ________________________________________ 6. Why a 75% Drawdown to 30,000 USD is Plausible 🧊 From 123k to 30k mechanically: A move from 123k to 30k doesn’t require structural failure; it merely requires a reversion to historical drawdown. That kind of move can be achieved by: •ETF inflows slowing or turning to mild outflows •Derivatives funding turning negative as carry trades unwind •A moderate macro risk-off (equities correction, higher real yields) 🧊 Maturing, not invincible: As adoption broadens—spot ETFs, institutional mandates, integration into macro portfolios—Bitcoin’s upside may gradually compress, but liquidity cycles and leverage cycles haven’t vanished. Even if each cycle’s drawdown edges slightly lower from ~85% to ~77%, there’s no reason to assume sub-50% drawdowns are the new regime. A respectable winter at 30k is almost conservative relative to earlier -80%+ events. ________________________________________ 7. Why the Floor Might Hold Above Prior Lows 🛡️ On-chain + macro floor logic: Without pinning to proprietary on-chain models, two simple supports for a 30k floor are: •Institutional cost basis: A growing chunk of supply is held via ETFs and treasuries accumulated in the 40–70k band. Many of these players may defend positions with hedging or incremental buying in the high-20k / low-30k region rather than panic-sell at -70–80%. •Realized price ratcheting higher: Across cycles, Bitcoin’s long-term realized price average on-chain cost basis tends to step up structurally. Past winters have bottomed not far below that long-term average; as the realized base rises, so does the likely bear-market floor. 🛡️ Regime shift vs. previous cycles: In 2018 and 2022, Bitcoin was still climbing the wall of institutional skepticism. By the mid-2020s, you have: •Spot ETFs •Corporate treasuries •Sovereign/FI experimentation These players typically do not capitulate to zero; they reduce risk, but they also accumulate in stress. That supports the idea of a shallower floor (30k) instead of a full 85–90% purge. ________________________________________ 8. Timing the 2026 Winter 🧭 Halving + 18-month lag template: Using the standard halving cycle template, major tops often occur 12–18 months post-halving, and winters then dominate the following year. With the fourth halving in April 2024, a 2025 ATH and a 2026 winter are exactly what the simple cycle model would project. 🧭 Scenario sketch •2025: Distribution at elevated levels (80–120k+), persistent Bitcoin as digital gold narrative, alt & meme blow-off, over-issuance of high-leverage products (Aster, other perps). •2026: Liquidity withdrawal + ETF fatigue + regulatory flare-ups → a stair-step decline through 80k, 60k, 45k, culminating in capitulation wicks into the 30–35k zone before a multi-month bottoming process. ________________________________________ 9. Market Structure Stress Points in a Winter Scenario 🧱 Leverage cascade risk: Perp DEXs offering hundreds to 1000x leverage attract the most price-insensitive flow at the worst time. When BTC breaks key levels (e.g., 80k → 60k → 50k), auto-deleveraging and forced liquidations can accelerate downside far beyond spot selling. Aster-style platforms, while innovative, mechanically create risk of cascading liquidations in a volatility spike. 🧱 Alt & meme vaporization: BNB meme coins and other speculative assets that rode the late-cycle pump will likely see 90–99% drawdowns, as in previous winters where smaller alts dramatically underperformed BTC. In your framework, BTC at 30k is actually the “high-quality survivor” outcome; the majority of late-cycle tokens may never reclaim their peaks. 🧱 Mining and infrastructure: With halved rewards and a much lower BTC price, marginal miners will be forced offline, just as in prior winters. That tends to deepen the short-term pain but ultimately improves the cost curve (strong miners consolidate, inefficient ones exit), laying groundwork for the next cycle. ________________________________________🎁Please hit the like button and 🎁Leave a comment to support our team!let me know your thoughts on the above in the comments section 🔥🏧🚀🚨🚨🚨 2026 CRYPTO WINTER PLAYBOOK – CONTRARIAN BTC OUTLOOK 🥶 Bitcoin cycle top penciled in around $123K, with a projected winter low near $30K (≈-75%). ❄️ Previous winters: 2018 -84%, 2022 -77% – a -75% drawdown is actually “normal” for BTC. 🌨️ 2024 halving → 2025 blow-off → 2026 winter fits the classic 12–18 month post-halving boom-and-bust pattern. 🧊 Aster DEX 1000x leverage + BNB meme coin mania = classic late-cycle euphoria, not the start of a new bull. 🌬️ Spot ETF + institutional FOMO can’t delete BTC’s historical 70–80% crash DNA – they just shift where the floor is. 🌨️ $30K acts as a plausible new floor, supported by higher institutional cost basis and long-term realized price. 🧊 Expect alt & meme coins to nuke 90–99%, while BTC “only” does -75% and survives to lead the next cycle. ❄️ Smart money sells euphoria near 6-figure BTC, builds dry powder, and targets gradual entries 40–35–30K. 🥶 Leverage is the enemy: perps and 1000x casinos likely accelerate the crash via liquidation cascades. 🌨️ Not financial advice – it’s a cycle-based contrarian framework for a statistically “normal” 2026 Bitcoin winter.final DEATH BOUNCE incoming shortly in December/January. then lights out.
طلا هفته آینده: سطوح حیاتی حمایت و مقاومت و پیشبینی تریدرها
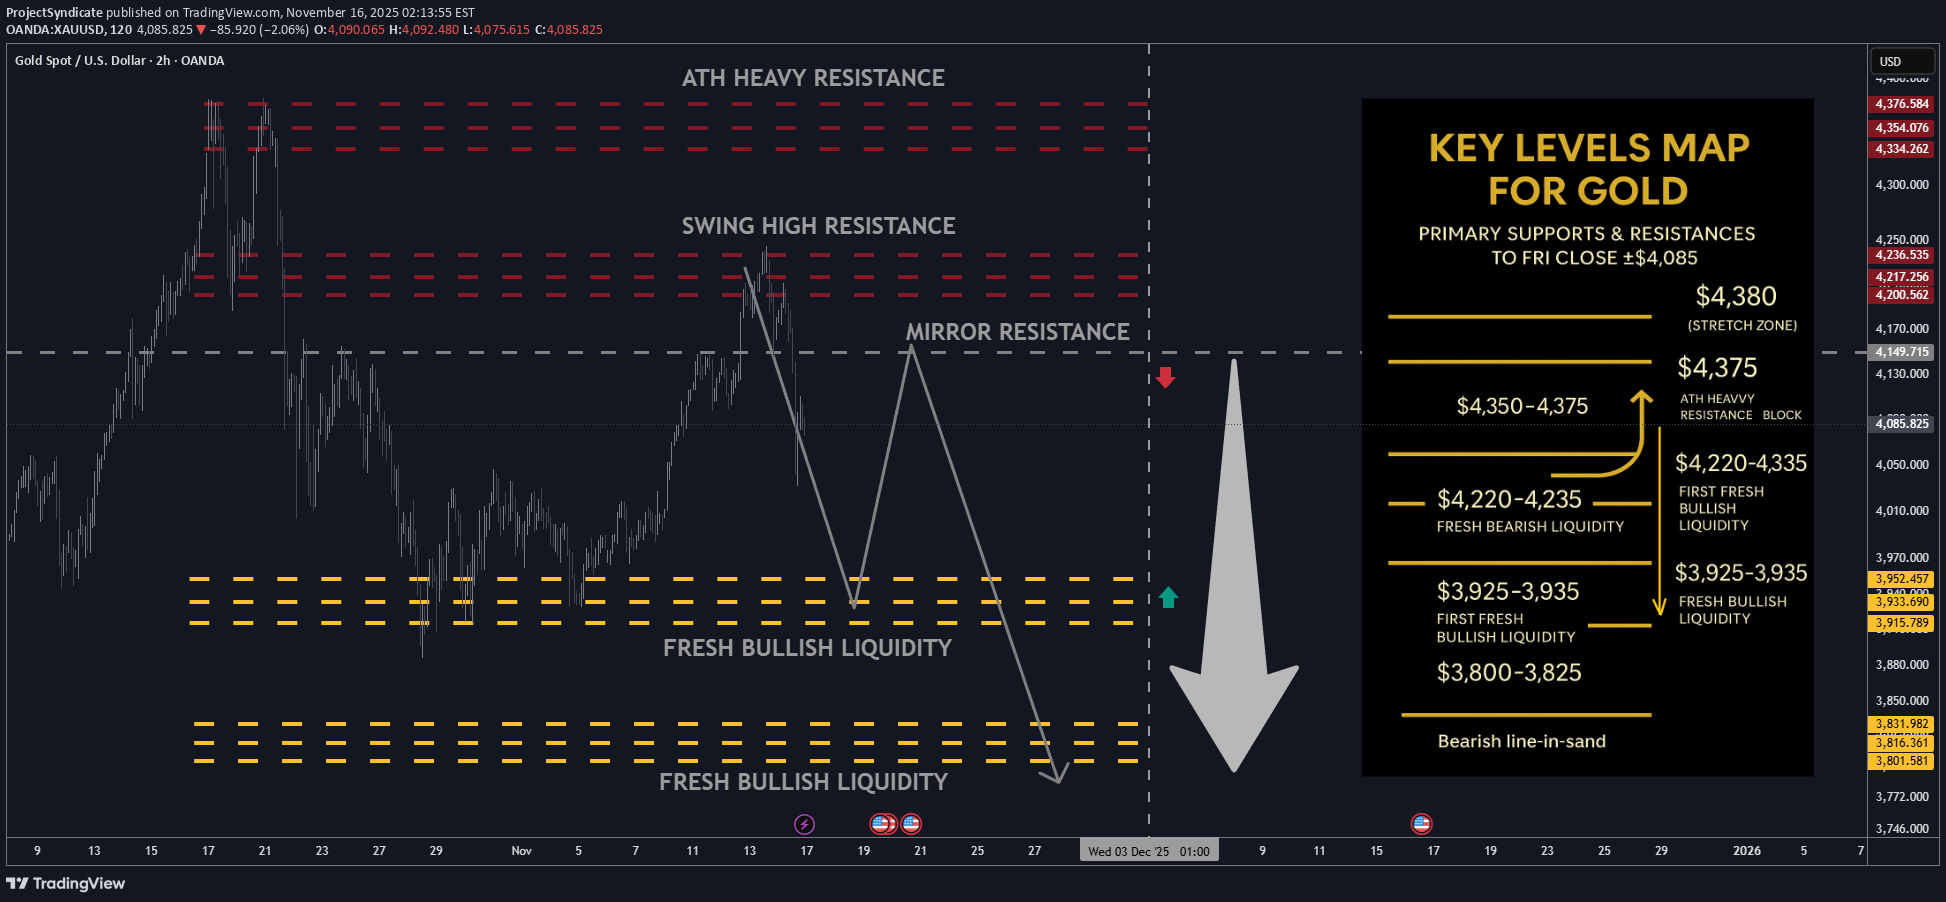
🔥 لقطة ذهبیة أسبوعیة – من PROJECTSYNDICATE 🏆 السعر الأعلى/الإغلاق: ~4,244 دولارًا أمریکیًا → ~4,085 دولارًا أمریکیًا - حقق المشترون 4.20 ألف دولار لکن البائعین دافعوا عن النطاق الذی یتراوح بین 4220 و4250 دولارًا؛ الإغلاق الأسبوعی ضعیف ولکنه لا یزال أعلى من 4 آلاف دولار ومتوسط المدى بشکل مریح. 📈 الاتجاه: صاعد ولکن فی الوضع التصحیحی / فی اتجاهین ; التعامل مع الشریط الحالی باعتباره نطاقًا تجاریًا بینما یکون أقل من کتلة العرض البالغة 4350-4375 دولارًا. 🛡 الدعم: 3,925-3,935 دولارًا سیولة صعودیة جدیدة ← جیب طلب أعمق بقیمة 3,800-3,825 دولارًا أمریکیًا - الرفوف الرئیسیة حیث یُتوقع الشراء عند الانخفاض. 🚧 المقاومة: 4,220-4,230 دولارًا لمنطقة التلاشی قصیرة المدى → 4,350-4,375 دولارًا (ATH کتلة مقاومة ثقیلة). 🧭التحیز الأسبوع المقبل: الأفضلیة لتلاشی القوة إلى 4,220-4,230 دولارًا أمریکیًا، مستهدفًا التناوب مرة أخرى إلى 3,925-3,935 دولارًا أمریکیًا. البدیل هو شراء الانخفاضات إلى 3,925-3,935 دولارًا ثم رکوب النطاق مرة أخرى نحو 4,220-4,230 دولارًا. إبطال القبول المستدام الذی یزید عن 4,350-4,375 دولارًا أمریکیًا؛ إن خسارة ما بین 3800 إلى 3825 دولارًا أمریکیًا تخاطر بانعکاس أعمق. ________________________________________ ________________________________________ 🔝 مناطق المقاومة الرئیسیة • 4,220-4,230 دولارًا — سقفًا أسبوعیًا فوریًا؛ یتماشى مع کتلة المقاومة الخاصة بک، وهی منطقة جذابة لبدء السراویل القصیرة فی الاختبارات الأولى. • 4,350-4,375 دولارًا أمریکیًا - قبل ATH / "کتلة المقاومة الثقیلة"؛ أی ارتفاع هنا هو مرشح للتلاشی ما لم یقبل السعر فوقه بحجم تداول قوی. 🛡 مناطق الدعم • 3,925–3,935 دولارًا — سیولة صعودیة جدیدة؛ یفضل أخذ الربح الأول فی صفقات البیع ومنطقة الشراء الأولیة. • 3,800-3,825 دولار — سیولة جدیدة أعمق؛ الفشل هنا من شأنه أن یشیر إلى تصحیح أکثر أهمیة، ولیس مجرد تراجع فی الاتجاه الصعودی. ________________________________________ ⚖️ سیناریو الحالة الأساسیة النطاق/الدمج بین 3,800 دولار أمریکی تقریبًا - 4,230 دولارًا أمریکیًا: • الدفعات الأولى إلى 4,220-4,230 دولارًا قابلة للبیع بالتناوب نحو 3,925-3,935 دولارًا. •طالما استمرت عملیات الإغلاق الأسبوعیة فی رفض الکتلة ATH التی تتراوح بین 4,350 دولارًا و4,375 دولارًا، فسیظل التحیز قائمًا على "قوة البیع، وشراء انخفاضات السیولة النظیفة". 🚀 مشغلات الاختراق / الانهیار •محفز الثور: القبول المستدام فوق 4,350 دولارًا أمریکیًا - 4,375 دولارًا أمریکیًا للجلسات المتعددة، والثبات فوق ذلک واستخدام band کدعم من شأنه أن یحول النغمة مرة أخرى إلى الاتجاه الکامل ویعید فتح المسار نحو الحدود القصوى السابقة وما بعدها (حوالی 4,400 دولار أمریکی). •التحفیز الهبوطی: الإغلاق الیومی الحاسم تحت مستوى 3800 دولار أمریکی یحول "التراجع الصحی" الحالی إلى تصحیح أعمق، مما یفتح المجال نحو الرفوف السفلیة السابقة دون 3750 دولارًا أمریکیًا وتوسع التقلب المحتمل. ________________________________________ 💡 محرکات السوق التی یجب مراقبتها • عائدات الاحتیاطی الفیدرالی والعائدات الحقیقیة: زادت احتمالات التخفیض فی شهر دیسمبر مرة أخرى؛ أی تراجع متشدد أو أکثر سخونة data یمکن أن یحد من الارتفاعات بالقرب من المقاومة. •ش.S. المخاطر المالیة/السیاسیة: لا یزال الإغلاق وسیاسة حافة الهاویة المالیة فی الخلفیة؛ قد تضغط عناوین القرار على الذهب لفترة وجیزة، بینما یدعم تجدد عدم الاستقرار الطلب. • التدفقات وتحدید المواقع: لا یزال الطلب على صنادیق الاستثمار المتداولة والبنک المرکزی داعمًا، ولکن بعد ارتفاع بنسبة 60% منذ بدایة العام، تسارع الأموال السریعة إلى جنی الأرباح بقوة. • السلوک عبر الأصول: انتبه إلى العلاقة بین الأسهم والذهب؛ إذا ضربت موجة العزوف عن المخاطرة واستمر بیع الذهب مع الأسهم، فقد تستمر الانخفاضات أکثر قبل تدخل المشترین الاستراتیجیین. ________________________________________ 🔓 خطوط الزناد الثور / الدب • الاتجاه الصعودی أعلاه: 4,350 دولارًا - 4,375 دولارًا (قبول مستمر؛ کتلة ATH تم استعادتها کدعم). •هبوط أدناه: 3800 دولار (یفتح خطر التصفیة العمیقة تحت أرفف السیولة الحالیة). ________________________________________ 🧭 استراتیجیة لهذا الأسبوع الخطة الأساسیة – قصیرة عن المقاومة (فکرتک core): منطقة الدخول: قم بتوسیع نطاق البیع إلى حدود 4,220-4,230 دولارًا أمریکیًا front على حافة کتلة المقاومة. •النقطة المستهدفة رقم 1: 3,925-3,935 دولارًا أمریکیًا للسیولة الصعودیة الجدیدة؛ فکر فی إغلاق معظم الحجم هنا. •المسار الصاعد/التمدید: إذا امتد الزخم للأسفل، راقب 3,800-3,825 دولارًا أمریکیًا لجنی الأرباح النهائیة؛ أدناه هنا ینتقل الملف الشخصی إلى وضع التصحیح الأعمق. •المخاطرة: Hard إبطال السعر إذا قبل السعر أعلى من 4,350 دولارًا أمریکیًا - 4,375 دولارًا أمریکیًا، وثبات عملیات الإغلاق الیومیة أعلاه وإعادة الاختبار الناجحة. الخطة البدیلة – شراء الانخفاض فی السیولة: منطقة الدخول: عروض الأسعار المتأرجحة تتراوح بین 3,925-3,935 دولارًا أمریکیًا، وللمضاربة الأکثر قوة، تصل إلى 3,800-3,825 دولارًا أمریکیًا. منطقة الخروج: الهدف الأول یعود إلى 4,220-4,230 دولارًا أمریکیًا؛ فکر فی التخلص من المخاطر بشکل کبیر عندما تقترب من تلک المقاومة band. •المخاطر: قم بالخفض أو التخفیض إذا فشل السعر فی البقاء فوق 3800 دولار على أساس الإغلاق الیومی أو إذا تسارع البیع بکمیات کبیرة عبر هذا الرف.
پیشبینی تسلا ۲۰۲۶: رتبهبندی کاتالیزورها و هدف قیمتی ۶۰۰ دلاری
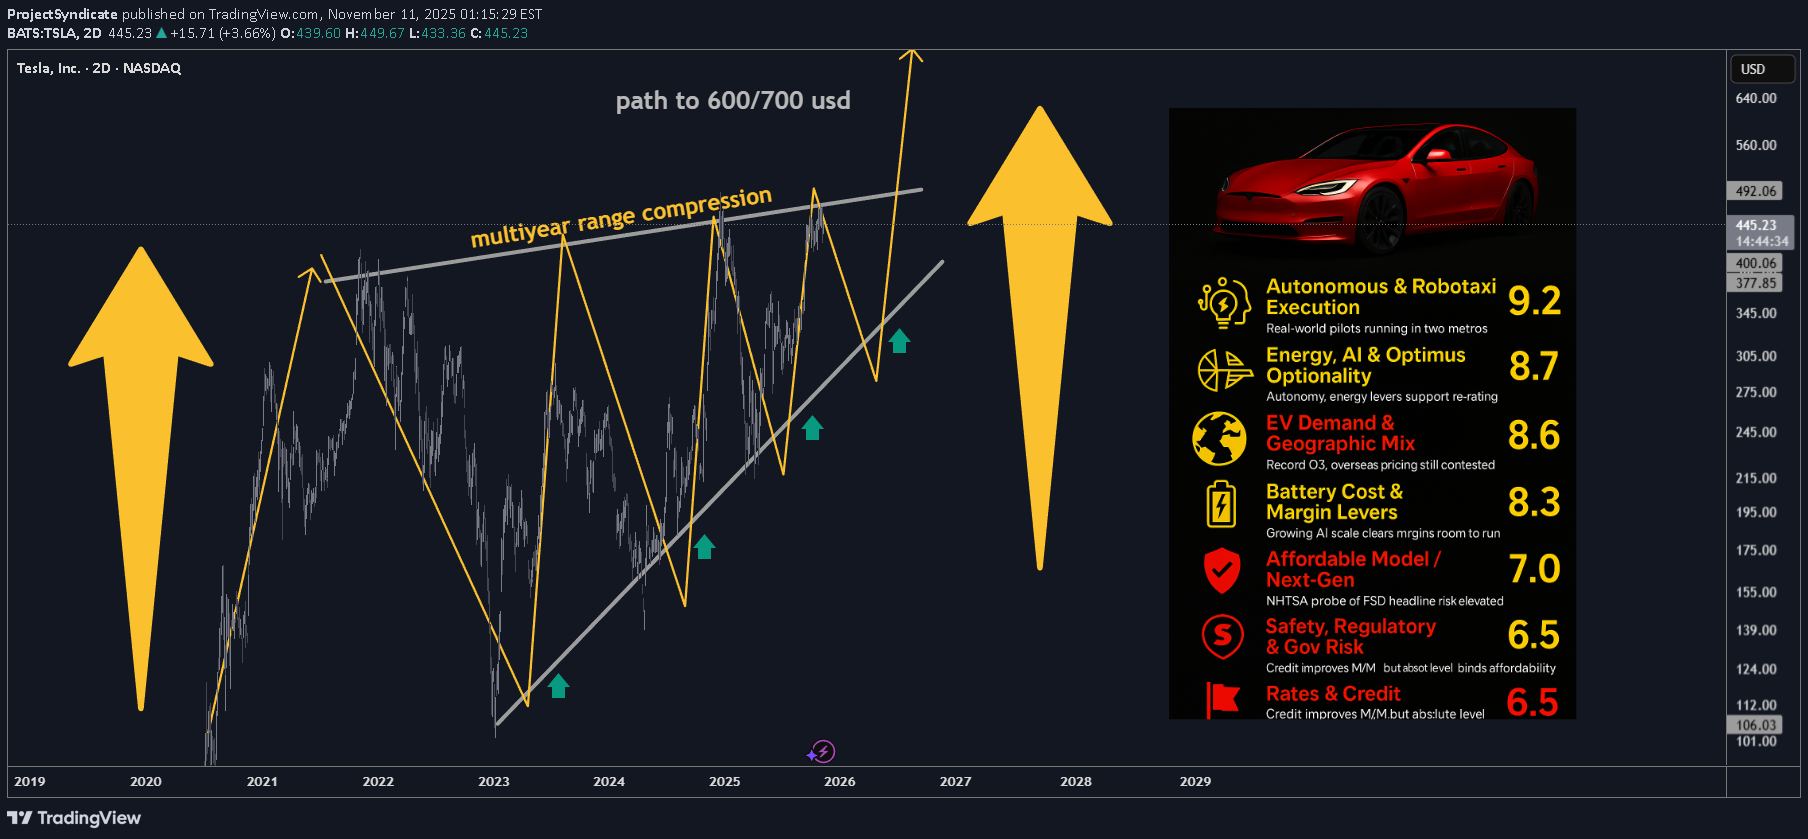
________________________________________ TSLA: Updated Outlook (Nov-2025) Here's an updated/revised outlook for TSLA including all the primary catalyst ranking and analyst ratings and overview of latest developments this was updated for Q1 2026 with all the viable market data. ________________________________________ 🤖 1) Autonomous & Robotaxi Execution — 9.2/10 (↑) •What changed: Tesla’s invite-only Austin robotaxi pilot kept running through the summer; Tesla also says it launched a Bay Area ride-hailing service using Robotaxi tech (Q3 deck). FSD v14 (Supervised) began rolling out in Oct with broader model upgrades; Tesla claims billions of supervised miles and AI training capacity lifted to ~81k H100-equivalents. •Offsetting risk: NHTSA opened a fresh probe (Oct-2025) into ~2.9M Teslas over traffic-safety violations when using FSD; investigation cites 58 reports incl. crashes/injuries. •Why the bump: Real pilots in two metros + visible AI scale-up keep autonomy the center of the bull case—even with elevated regulatory risk. ________________________________________ 🌍 2) EV Demand & Geographic Mix — 8.6/10 (↘ ) •What changed: Q3-25 delivered record vehicles and record energy storage deployments, with record revenue and near-record free cash flow. Still, we’re past the U.S. tax-credit pull-forward and China/Europe pricing remains competitive. •Read-through: Momentum into Q4 looks better than 1H-25, but regional price discipline and mix will matter. ________________________________________ 💸 3) U.S. EV Tax Credits & Incentives — 6.0/10 (↘) •What changed: Federal new/used EV credits ended for vehicles acquired after Sept 30, 2025 under OBBB. Buyers can still qualify if a binding contract + payment was made by 9/30 and the car is placed in service later (“time-of-sale” reporting). This creates a limited after-deadline tail into late ’25/early ’26 but the program has sunset for new acquisitions. •Implication: Pull-forward demand helped Q3; near-term becomes tougher without the credit. ________________________________________ 📉 4) Rates & Credit Conditions — 6.5/10 (↔) •Rate-cut expectations have eased financing costs M/M, but absolute affordability still binds EV uptake. (Macro-sensitive; no single decisive print.) ________________________________________ 🎯 5) Affordable Model / Next-Gen Platform — 8.0/10 (↔) •Q3 deck emphasized Model 3/Y “Standard” variants to expand entry price points; true next-gen remains staged, with execution risk. ________________________________________ 🔋 6) Battery Cost & Margin Levers — 8.3/10 (↑) •What changed: Q3 total GAAP GM improved vs 1H; energy revenue +44% YoY; free cash flow ~$4.0B. Scale/learning and supply-chain localization called out. ________________________________________ ⚡ 7) Energy, AI & Optimus Optionality — 8.7/10 (↑) •Record storage deployments, Megapack 3 / Megablock unveiled; expanding AI inference/training and a U.S. semi-conductor deal noted. This is the clearest re-rating vector beyond autos. ________________________________________ 🛡️ 8) Safety, Regulatory & Governance Risk — 7.5/10 (risk) (↑ risk) •New NHTSA probe into FSD reporting/behavior escalates headline risk; audit scrutiny persists. Interpret higher score here as more material risk to multiple. ________________________________________ 🚩 9) Competition & Global Share — 6.2/10 (↔) •Competitive intensity in China/EU remains high; Q3 execution improved but pricing power still contested. ________________________________________ 🌐 10) Macro & Trade/Policy — 6.5/10 (↑) •Policy shifts (e.g., OBBB tax-credit sunset; tariff/trade uncertainty) remain a swing factor for cost & demand corridors. ________________________________________ ✅ 11) Commodities/Inputs — 5.5/10 (↔) •Mixed moves across lithium/nickel; no single driver eclipses execution/AI narrative near term. ________________________________________ Updated Catalyst Scorecard (ranked by impact) 1.Autonomous & Robotaxi Execution — 9.2 2.Energy, AI & Optimus Optionality — 8.7 3.EV Demand & Geographic Mix — 8.6 4.Battery Cost & Margin Levers — 8.3 5.Affordable Model / Next-Gen — 8.0 6.U.S. EV Incentives — 6.0 7.Rates & Credit — 6.5 8.Macro/Trade — 6.5 9.Competition/Share — 6.2 10.Safety/Reg/Gov Risk — 7.5 (risk flag) 11.Commodities — 5.5 (Key Q3 facts from Tesla’s deck; probe/tax-credit items from NHTSA/IRS reporting.) ________________________________________ 📊 Analyst Rankings & Price Targets •Street consensus (near-term 12-mo): ~$391 average target; consensus rating: Hold across ~46 firms. •Bull camp: Wedbush (Dan Ives) $600 PT (reiterated Nov-5; Street-high; thesis = embodied-AI/robotics optionality + robotaxi). Benchmark $475 Buy (post-Q3). •Cautious/negative: UBS $247 Sell (raised from $215 but still bearish on deliveries/margins). •Tape-check from Tesla: Q3-25 revenue $28.1B, non-GAAP EPS $0.50, record FCF, record deliveries & storage. (EPS miss vs some expectations; revenue beat.) ________________________________________ 🔍 Headlines that moved the needle •NHTSA opens new FSD probe (scope ~2.9M vehicles). •FSD v14 (Supervised) broad rollout; AI capacity to ~81k H100-eq; Bay Area robotaxi ride-hailing noted (Q3 deck). •OBBB EV tax credits sunset 9/30/25; binding-contract/time-of-sale guidance enables limited post-deadline claims. •Q3 print: record deliveries, record energy storage, record FCF; EPS light vs some models but narrative shifts to AI/energy. ________________________________________ 🧭 Technicals: Levels & Structure (weekly focus) Primary structure: since late-2022, TSLA’s traded inside a contracting wedge, with noteworthy compression into 2H-2025—typical of late-stage accumulation before a decisive break. Momentum divergences are improving on weekly frames even as price consolidates. ________________________________________ Key levels (spot-agnostic): •Support: $360–$370 (prior breakdown area/weekly shelf); $330–$345 (multi-touch base/pivot); $310–$320 (cycle risk zone). •Resistance: $405–$420 (range top & supply), $450–$475 (post-robotaxi pop zone / analyst PT cluster), $500 (psych), then $600–$650 (LT measured target band). •Roadmap Expect one more downside probe into $310–$320 in Q1-2026 to complete the wedge, then trend break and resume bull leg toward $600/$650 over the subsequent cycle (≈ ~100% off the projected low). •Risk markers: sustained weekly closes < $305 would postpone the “final low” timing and force a re-mark to the 200-week MA cluster; weekly closes > $475 accelerate the upside timing toward the $500/$600 handles. ________________________________________ Cases unchanged framework •Bull: Robotaxi expands to more metros, regulators settle into a supervised-AV regime, energy/AI scale continues; market re-rates to $475–$600 (Benchmark/Wedbush anchors). •Base: Solid execution across autos + energy, FCF stays healthy, autonomy rolls out cautiously under oversight; stock tracks Street $350–$400 band. •Bear: Delivery softness post-credit-sunset, tougher pricing in China/EU, or adverse NHTSA actions; retest of $300–$330 zone before trend resolution. ________________________________________ What to watch next (60–90 days) 1.NHTSA probe path and any software/recall remedies. 2.Robotaxi geographic expansion cadence and any shift from safety-monitor to remote-assist ops. 3.Energy bookings & Megapack 3/Megablock ramp against utility RFP calendars. 4.Delivery run-rate post-credit sunset and mix of Standard trims. ________________________________________🚗 TSLA Catalysts Ranking: Q1 2026 Outlook PT 600 USD 🤖 Autonomy Surge: Robotaxi pilots live in Austin & Bay Area; FSD v14 expanding fast. ⚡ Energy & AI Lift: Record storage deployments + AI training scale hitting 80k H100 eq. 🌍 EV Demand: Q3 deliveries & FCF at record highs, though EU/China pricing still tight. 🔋 Margins Recovering: Cost cuts & energy growth push GM ↑, strong cash generation. 💰 Tax Credit Fade: U.S. EV credits ended 9/30; only pre-deadline contracts still qualify. 📉 Rates & Macro: Fed easing helps affordability, but demand gap post-credits to watch. 🦾 Optimus & AI Story: Embodied-AI optionality now key to long-term re-rating. 🚨 Reg Risk: NHTSA probes ~2.9 M FSD cars—headline volatility risk persists. 🏁 Tech Map: Wedge compression since ’22 = accumulation; possible final low $310–$320 Q1-26. 🚀 LT Target: Bull cycle toward $600–$650, ≈ +100% from projected base.🎁Please hit the like button and 🎁Leave a comment to support our team!let me know your thoughts on the above in the comments section 🔥🏧🚀Ferrari (RACE) Catalyst Scorecard AND 2026 Outlook
تحلیل طلای هفته آینده: سطوح حیاتی حمایت و مقاومت برای معاملهگران
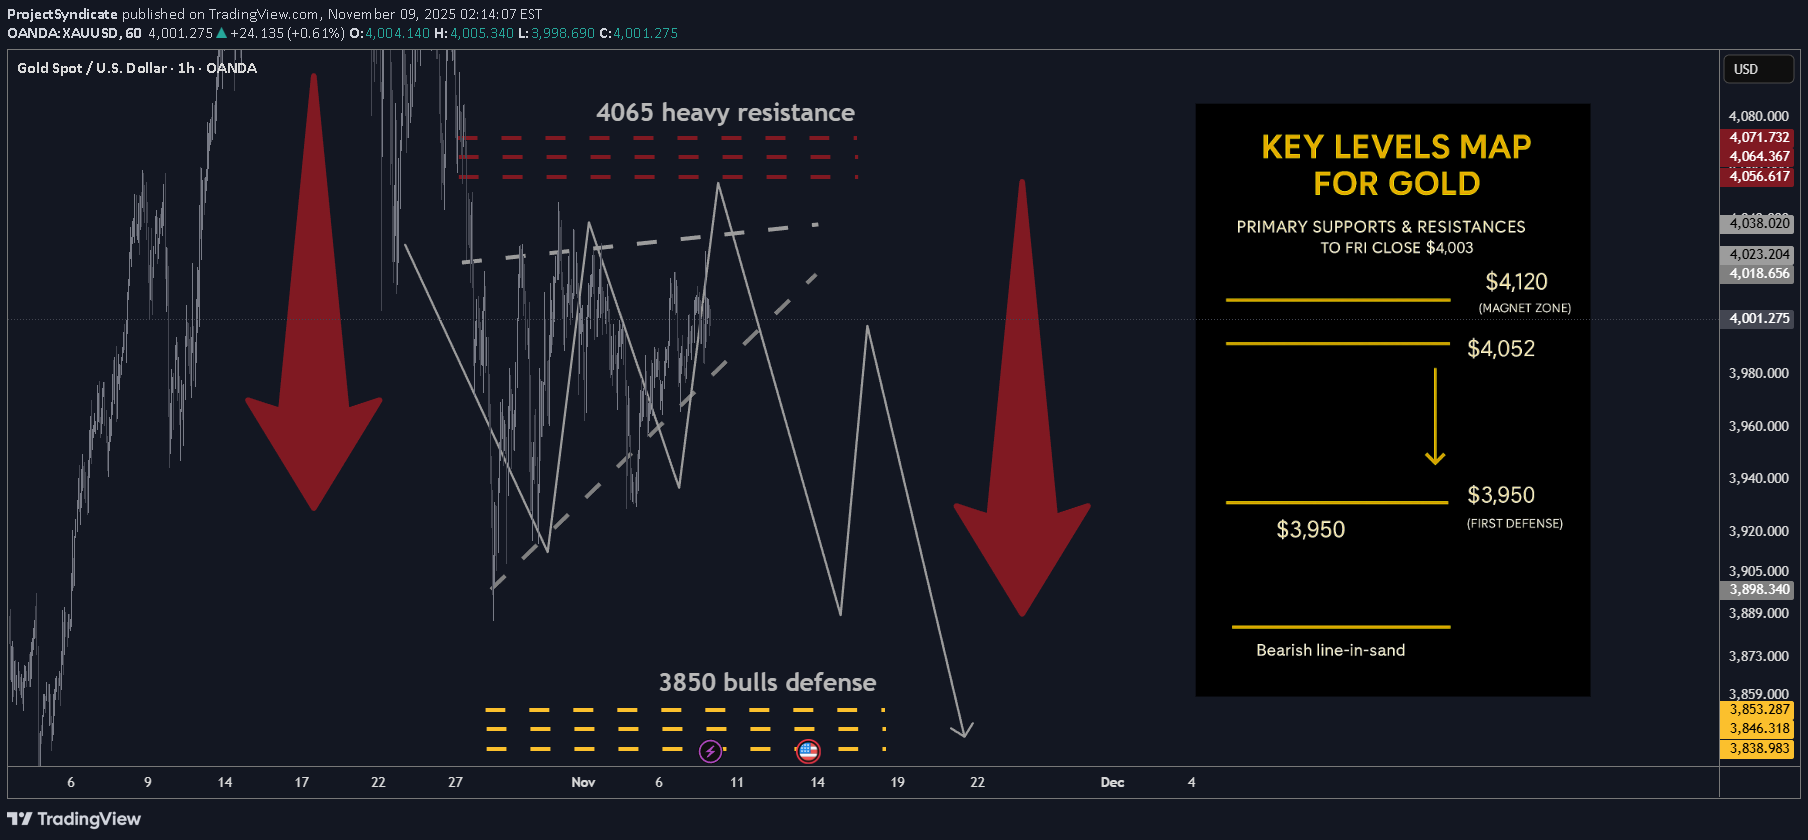
🔥 لقطة ذهبیة أسبوعیة – من PROJECTSYNDICATE 🏆 أعلى سعر/إغلاق: 4,024.9 دولارًا أمریکیًا ← ~4,003 دولارًا أمریکیًا — تلاشى ارتفاع البائعین؛ إغلاق أسبوعی ضعیف ولکنه عاد فوق مستوى 4 آلاف دولار. 📈 الاتجاه: تصحیح محاید / معتدل داخل النطاق؛ لا أتوقع ارتفاعات جدیدة فوریة عند أقل من 4,080-4,120 دولارًا. 🛡 الدعم: 3,950 دولارًا → 3,900 دولارًا → 3,850 دولارًا - أرفف محوریة لجنی الربح والسیطرة على الدببة. 🚧 المقاومة: 4,040 دولارًا أمریکیًا / 4,080 دولارًا أمریکیًا / 4,120 دولارًا أمریکیًا - مناطق العرض المتکررة؛ الصنابیر الأولى مفضلة للتلاشی. 🧭 التحیز الأسبوع المقبل: البیع على المکشوف بمبلغ 4,040 دولارًا - 4,120 دولارًا؛ TP 3,950 دولارًا ثم 3,850 دولارًا (خطتک). إبطال الاسترداد المستمر > 4,120 دولارًا - 4,175 دولارًا؛ خسارة 3850 دولارًا تهدد بتمدید الانخفاض. 🌍 الریاح الخلفیة/الریاح المعاکسة الکلیة (شریط هذا الأسبوع): •نغمة السرد: أشارت Kitco إلى "حافة الشفرة" بالقرب من 4000 دولار أمریکی مع آراء متباینة (الفقاعة مقابل الدمج)، فی حین قامت قطعة أخرى من Kitco بتصویر المماطلة على أنها "وقفة صحیة". • وول ستریت جورنال flow: تأرجحت العناوین الرئیسیة بین "انخفاض سعر الدولار إلى ما دون 4000 دولار" وبین أیام صعود متواضعة؛ صافی القراءة هو التوحید بحوالی 4 آلاف دولار من خلال التجارة السریعة فی الاتجاهین. •المستویات: أنهى السعر الفوری الأسبوع بشکل أساسی عند 4 آلاف دولار. لم یتمکن ارتفاع intrawEEK من تجاوز الحد الأقصى فی بدایة الأسبوع الذی یتراوح بین 4.02 و4.03 ألف دولار. 🎯 منظر الشارع: بعد طباعة الشهر الماضی بأکثر من 4000 دولار (الأولى على الإطلاق)، تحولت نغمة وول ستریت جورنال إلى الهضم؛ لا تزال المسیرات تجتذب العرض حتى استعادة حاسمة للمقاومة العلیا. ________________________________________ 🔝 مناطق المقاومة الرئیسیة • 4,040 دولارًا — سقفًا فوریًا؛ القرب الأسبوعی العالی، من المرجح أن یحد من الاختبارات الأولى. • 4,080 دولارًا — حافة العرض الثانویة من حالات الفشل الأخیرة. • 4,120 دولارًا — النطاق العلوی؛ القبول أعلاه هنا یبدأ فی تحیید التصحیح. 🛡 مناطق الدعم • 3,950 دولارًا — الدفاع الأول / TP الأول. • 3900 دولار — رف ذو رقم مستدیر؛ الخسارة تدعو إلى تحقیقات الزخم. • 3,850 دولارًا أمریکیًا — قاعدة هیکلیة حرجة ونقطة بیع ثانیة؛ کسر المخاطر تسارع الجانب السلبی. ________________________________________ ⚖️ سیناریو الحالة الأساسیة الضغط داخل هیکل یشبه الإسفین الصاعد، یتراوح بین 3850 دولارًا و4120 دولارًا. یمکن بیع الدفعات الأولى إلى 4,040 دولارًا - 4,120 دولارًا للتناوب نحو 3,950 دولارًا - 3,850 دولارًا بینما یحترم السوق أعلى المستویات الأسبوعیة المنخفضة. 🚀 مشغلات الاختراق / الانهیار •محفز الثور: القبول المستدام> ~4,120 دولارًا - 4,175 دولارًا یحول النغمة البناءة مرة أخرى ویعید فتح ما یزید عن 4,200 دولار. • مؤشر الهبوط: الإغلاق الیومی < 3,900 دولار أمریکی یزید من احتمالات اختبار 3,850 دولارًا أمریکیًا بالکامل؛ فشل سعر 3850 دولارًا یهدد بانسکاب الزخم. 💡 محرکات السوق التی یجب مراقبتها • مسار بنک الاحتیاطی الفیدرالی / العائدات الحقیقیة (احتمالات خفض أسعار الفائدة مقابل روایة التضخم الثابتة فی نسخة وول ستریت جورنال). • تقلبات الدولار الأمریکی (لا یوجد ضعف واسع النطاق للدولار الأمریکی ← تعثر المحاولات الصعودیة). •تدفقات صنادیق الاستثمار المتداولة/البنک المرکزی (تسلط المقابلات التی أجرتها شرکة Kitco الضوء على الانقسام فی المشاعر؛ المشترین الذین یتراجعون نشطون، واللاعبون فی الزخم حذرون). • مخاطر الأحداث (تظل حساسیة العنوان مرتفعة؛ ومن الممکن حدوث ضغط سریع للمقاومة). 🔓 خطوط الزناد الثور / الدب • صعودی فوق: 4,120 دولارًا - 4,175 دولارًا (مستدامًا). •هبوط أدناه: 3,900 دولار - 3,850 دولار (تتسع المخاطر إلى أقل من 3,850 دولار). 🧭 استراتیجیة لهذا الأسبوع البیع على مستوى المقاومة: یبلغ حجمه حوالی 4,040 دولارًا أمریکیًا → 4,080 دولارًا أمریکیًا → 4,120 دولارًا أمریکیًا؛ الربح رقم 1: 3,950 دولارًا أمریکیًا؛ الربح رقم 2: 3,850 دولارًا أمریکیًا؛ المخاطرة: Hard توقف عند إغلاق یومی أعلى من 4120 دولارًا (أو الاختراق خلال الیوم الذی یستمر عند إعادة الاختبار). فکر فی التقلیص إذا کان الضغط المبنی على الأخبار علامة 4175 دولارًا وفشل. 🏆 توقعات أسبوعیة ذهبیة - تشغیل ضغط النطاق 💰 4,024 دولارًا أمریکیًا → 4,003 دولارًا أمریکیًا - إغلاق أسبوعی ثابت فوق 4 آلاف دولار أمریکی؛ البائعین توج صعودا. ⚖️ الاتجاه: محاید / تصحیحی؛ نطاق محدد أقل من 4,080 دولارًا - 4,120 دولارًا. 🏗 الهیکل: ضغط الإسفین الصاعد - تلاشی الزخم. 🎯 الإستراتیجیة: قصیر 4,040 دولارًا - 4,120 دولارًا؛ یستهدف 3,950 دولارًا → 3,850 دولارًا. 🧱 الدعم: 3,950 دولارًا أمریکیًا / 3,900 دولارًا أمریکیًا / 3,850 دولارًا أمریکیًا - مناطق جنی الربح الخاصة بالدببة. 🚧 المقاومة: 4,040 دولارًا أمریکیًا / 4,080 دولارًا أمریکیًا / 4,120 دولارًا أمریکیًا - حدود العرض المتکررة. 🌍 نغمة الاقتصاد الکلی: وول ستریت جورنال وکیتکو - "الاستقرار بالقرب من 4 آلاف دولار"، عوائد حقیقیة ثابتة، والدولار الأمریکی مختلط. 🔥 الزناد الهبوطی: إغلاق یومی <3,900 دولار → یفتح اختبار 3,850 دولار. 🚀 محفز الثور: مستدام > 4,120 دولارًا - 4,175 دولارًا ← خطر الانعکاس. 🧭 التحیز: بیع القوة، والبقاء ذکیًا؛ الوتد الصاعد = تلاشی الارتفاعات، وحجز الأرباح عند الانخفاضات.
پیشبینی طلای ۲۰۲۶: آیا اصلاح فعلی فرصت خرید نهایی قبل از صعود است؟
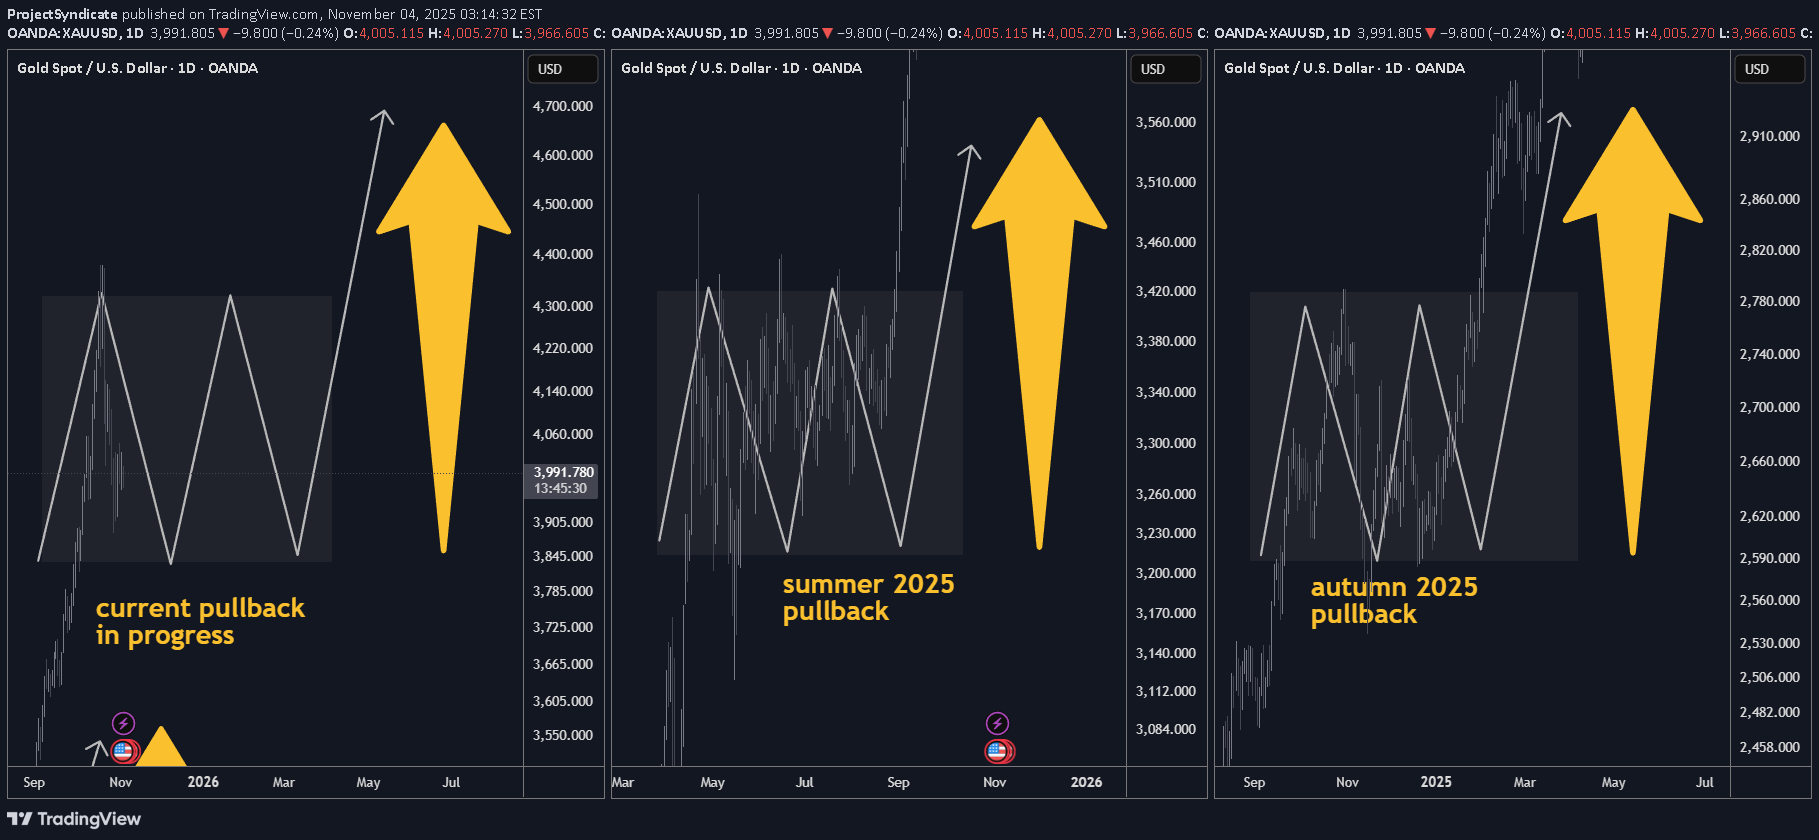
📌 Executive Summary •Base case (60%): The current pullback is a normal retracement within the primary bull trend. We expect consolidation through late Q4-2025 and potentially into January 2026, followed by a resumption of the uptrend in Q1/Q2-2026. •Drivers remain intact: Persistent central-bank accumulation, reserve-diversification dynamics, and episodic macro/geopolitical risk keep the structural bid under gold. •Positioning stance: Maintain core long exposure, add tactically on weakness into the $3.8k–$4.0k zone spot equivalent with tight risk controls, and ladder call spreads into Q2-2026. •Risk skew: Near-term pullback risk persists position shakeouts, macro data surprises. Structural bearish risks are low unless central-bank demand materially softens. ________________________________________ 🧭 Market Context & Recent Price Action •Gold printed successive record highs into mid-October; front-month futures traded above $4,170/oz before easing. Headlines framed the rally as policy and safe-haven led, with year-to-date gains exceptionally strong. •Central-bank demand continues to underpin the move: WGC and sell-side coverage highlight accelerating official-sector buying and diversification away from FX reserves; banks forecast higher prices into 2026. •The current setback aligns with prior bull-market pauses (e.g., Apr–Jul 2025 and Sep 2024–Dec 2024 pullbacks), consistent with the user-stated pattern of multi-month consolidations before trend resumption. What’s new in headlines late Oct–Nov 2025: •Pullback is “technical and temporary,” with buy-the-dip framing from UBS; next tactical target cited around $4,200. •Official-sector flows: Korea & Madagascar exploring reserve increases; PBoC extended buying streak into September. •WSJ coverage stresses gold’s role in erosion of trust in fiat/central banks and the reserve-diversification theme. ________________________________________ 🔑 Structural Bull Case 2025-2026 1.Official-Sector Accumulation: oMulti-year build in central-bank gold holdings (EM-led) as a sanctions-resilient reserve asset; this remains the single most important marginal buyer narrative. 2.Reserve Diversification & Financial Geopolitics: oEvidence that gold’s share of global reserves has risen while some institutions reassess currency composition. 3.Macro Volatility & Policy Trajectory: oPeriodic growth scares, policy pivots, and real-rate uncertainty sustain hedging demand. Street targets for late-2026 (e.g., ~$4,900 GS) anchor upside convexity. 4.Market Microstructure: oThin above prior highs and crowded shorts on pullbacks can fuel sharp upside re-accelerations when macro catalysts hit data, geopolitics, policy hints. ________________________________________ 📊 Technical Map Top-Down •Primary trend: Up. The sequence of higher highs/higher lows since 2024 remains intact; current move is a trend-within-trend consolidation. •Pullback anatomy: Prior bull pauses (Apr–Jul 2025; Sep–Dec 2024) lasted 2–4 months, with troughs forming on volatility compression and momentum washouts—a template for now. •Key tactical zones spot-equiv.: o$3,800–$4,000: First reload area prior breakout shelf / 50–61.8% of the last leg. o$4,200–$4,250: First resistance / re-acceleration trigger retests of breakdown pivots. o$4,350–$4,400: High congestion; decisive weekly close above here re-opens ATH extension. ________________________________________ 🗓️ Scenario Pathing Q4-2025 → Q2-2026 •Base Case 60% — “Consolidate then resume”: oSideways-to-lower into late Q4/Jan 2026 as positioning resets; range $3.8k–$4.2k. oBreakout resumption in Q1/Q2-2026 as macro and official flows re-assert. •Bullish Extension 25% — “Shallow dip, quick reclaim”: oSofter real yields / risk flare trigger swift recapture of $4.2k–$4.4k and new highs earlier in Q1-2026. oCatalysts: heavier central-bank prints, geopolitical shock, or earlier policy-easing rhetoric. •Bear-Risk 15% — “Deeper flush, trend intact”: oHawkish macro surprise or forced deleveraging drives $3.6k–$3.7k probes; structure holds unless official-sector demand meaningfully fades ________________________________________ 🧪 What to Watch High-Signal Indicators •Official-Sector Data: Monthly updates from WGC, IMF COFER clues, and PBoC reserve disclosures. Continuation of EM purchases = green light for the bull. •Rates & Liquidity: Real-rate direction and dollar liquidity conditions around data and policy communications. •Microstructure: CFTC positioning inflections, ETF out/in-flows a lagging but useful confirmation when they finally turn. •Asia Physical/Policy: China/Japan retail and wholesale dynamics; policy/tax headlines can create short-term volatility. ________________________________________ 🎯 Strategy & Implementation 1) Core: •Maintain strategic long allocation consistent with mandate e.g., 3–5% risk budget; avoid pro-cyclical reductions during orderly pullbacks. 2) Tactical Adds •Scale-in buy program within $3.8k–$4.0k •Optionality: Buy Q2-2026 call spreads (e.g., 4.2/4.8) on dips; fund via selling Q1-2026 downside put spreads around $3.6k–$3.7k where comfortable with assignment. 3) Risk Controls 🛡️: •Hard-stop any tactical adds on weekly close < ~$3.6k or if credible evidence emerges of official-sector demand reversal.🥇 Base Case: Normal pullback inside primary bull trend — consolidation likely till Jan ’26, rally resumes Q1/Q2 ’26. 💰 Drivers Intact: Central-bank buying, reserve diversification, & macro/geopolitical hedging sustain long-term bid. 🏦 CB Demand: PBoC, Korea, Madagascar add reserves; official-sector flows remain the key pillar. 📉 Current Pullback: Mirroring Apr–Jul ’25 & Sep–Dec ’24 pauses — 2-4 month digestion phase. 🪙 Tech Zones: Buy zone $3.8k–$4.0k | Resistance $4.2k | ATH trigger $4.35k–$4.4k. 📊 Scenario Path: 60% → Consolidate → Resume bull 25% → Quick reclaim > $4.2k 15% → Deeper flush $3.6k–$3.7k (trend intact). 🔔 Watch: WGC/PBoC data, real-rate trends, CFTC & ETF flows, Asia policy headlines. 🎯 Strategy: Maintain core long (3-5% risk); scale-in $3.8–$4.0k; add Q2-26 call spreads 4.2/4.8; hedge via Q1-26 put spreads. 🛡️ Risk Control: Cut if < $3.6k or CB demand fades — otherwise, stay gold & buy the dip.🎁Please hit the like button and 🎁Leave a comment to support our team!let me know your thoughts on the above in the comments section 🔥🏧🚀Gold Bull Market Outlook And Targets: 5000 USD/7500 USD
تحلیل طلا هفته آینده: سطوح حیاتی حمایت و مقاومت و پیشبینی معاملهگران
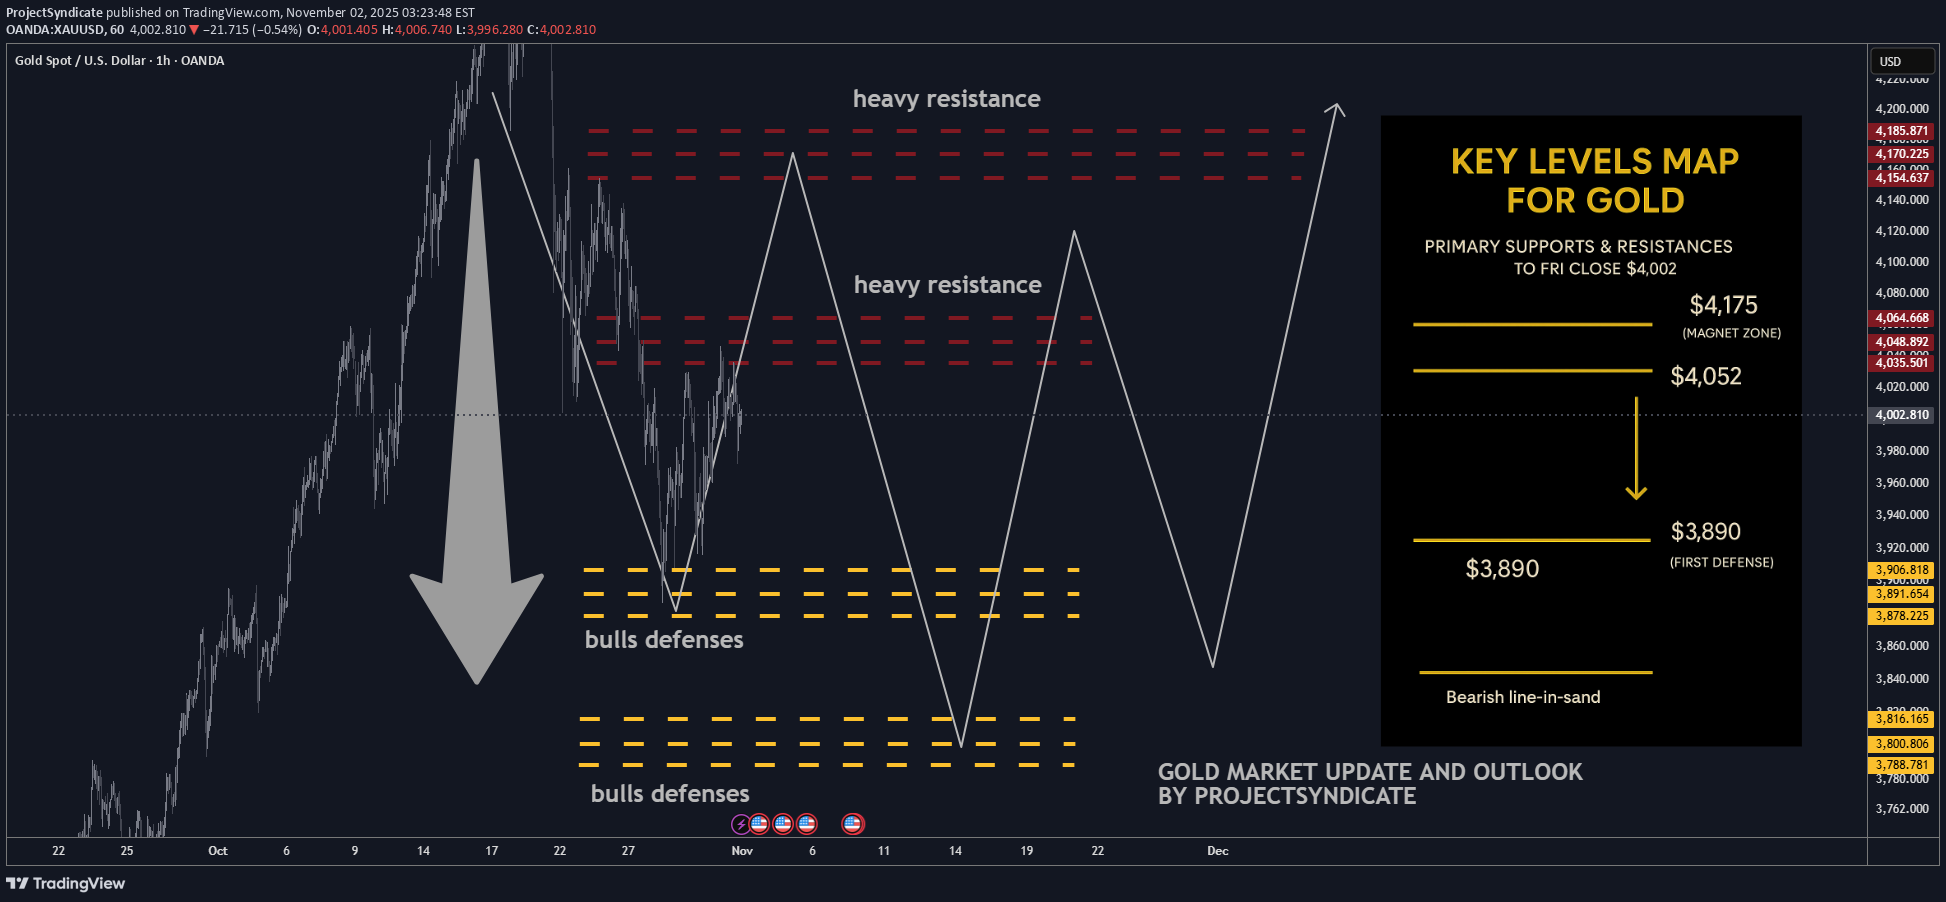
🔥 لقطة ذهبیة أسبوعیة – من PROJECTSYNDICATE 🏆 السعر المرتفع/الإغلاق: 4,108 دولارًا أمریکیًا ← ~4,002 دولارًا أمریکیًا — دافع البائعون عن النفقات العامة؛ إغلاق أسبوعی ضعیف ضمن النطاق. 📈 الاتجاه: الوضع المحاید / التصحیح لا یزال قید التشغیل؛ لا أتوقع ارتفاعات جدیدة على المدى القریب. 🛡 الدعم: 3,890 دولارًا → 3,800 دولارًا – أرفف محوریة لاحتواء الجانب السلبی. 🚧 المقاومة: 4,052 دولارًا أمریکیًا / 4,175 دولارًا أمریکیًا — مناطق مغناطیسیة لمحاولات العرض/التلاشی. 🧭 التحیز الأسبوع المقبل: تفضیل عملیات البیع على المکشوف إلى 4,052 دولارًا - 4,175 دولارًا مع أخذ الربح نحو 3,890 دولارًا - 3,800 دولارًا. إبطال الاسترداد المستمر > 4,175 دولارًا أمریکیًا؛ فشل 3800 دولار یخاطر بتمدید الانخفاض. 🌍 الریاح الخلفیة/الریاح المعاکسة الکلیة: • الأسعار: العائدات الحقیقیة مستقرة إلى ثابتة مع احتواء الاتجاه الصعودی. وأی مفاجأة حذرة قد تؤدی إلى ضغوط للمقاومة. • العملات الأجنبیة: مؤشر DXY مختلط – عدم وجود ضعف واسع النطاق للدولار الأمریکی یحد من متابعة الاندفاع. • التدفقات: الطلب على CB/ETF داعم عند الانخفاضات deep ولکنه فاتر بالقرب من أعلى المستویات. • الجغرافیا السیاسیة: توفر مخاطر الأحداث عروضًا متقطعة. لیس محرک الاتجاه هذا الأسبوع. 🎯 رؤیة الشارع: الروایات الصعودیة على المدى المتوسط تحفظ التنویع، ولا یزال تخفیف السیاسة حتى عام 2026 قائمًا، لکن الشریط على المدى القریب یفضل متوسط الارتداد نحو الانخفاض تحت المقاومة. ________________________________________ 🔝 مناطق المقاومة الرئیسیة • 4,052 دولار — سقف فوری؛ من المحتمل أن یغطی محور الإمداد المسبق الاختبارات الأولى • 4,175 دولار — مستوى المقاومة العلوی. القبول أعلاه یقلب النبرة من التصحیحیة إلى البناءة 🛡 مناطق الدعم • 3,890 دولارًا — الدفاع الأول. الخسارة تدعو إلى تحقیقات الزخم • 3800 دولار — القاعدة الهیکلیة الحیویة. کسر المخاطر تسارع الجانب السلبی ________________________________________ ⚖️ سیناریو الحالة الأساسیة تداول من النطاق إلى الناعم فی حدود 3800 دولار - 4175 دولارًا. الارتفاعات إلى 4,052 دولارًا - 4,175 دولارًا قابلة للبیع. توقع عودة التناوب نحو 3890 دولارًا مع نطاق یصل إلى 3800 دولار إذا ضغط البائعون. 🚀 مشغل الاختراق فقط القبول المستدام > ~ 4,175 دولارًا أمریکیًا ینفی التصحیح ویفتح مسارًا بقیمة 4,200 دولارًا أمریکیًا +؛ على العکس من ذلک، فإن الرفض المؤکد عند 4,052 دولارًا أمریکیًا مع إغلاق یومی أقل من 3,890 دولارًا أمریکیًا یزید من احتمالات اختبار 3,800 دولار أمریکی. 💡محرکات السوق • مسار بنک الاحتیاطی الفیدرالی والعائد الحقیقی drift • تقلبات مؤشر الدولار الأمریکی • نغمة ETF/CB flow عند الانخفاضات مقابل التمزقات • عناوین المیل إلى المخاطرة (الجغرافیا السیاسیة/التجارة) 🔓 خطوط الزناد الثور / الدب • صعودی فی الأعلى: من المحتمل أن تنتهی مرحلة التصحیح عند 4,175 دولارًا أمریکیًا إذا تم الحفاظ علیها • هبوطی أدناه: 3,890 دولارًا أمریکیًا ← توسع المخاطر إلى أقل من 3,800 دولار أمریکی 🧭 الإستراتیجیة البیع على المکشوف من المقاومة العلویة (4,052 دولارًا → 4,175 دولارًا). قم بتوسیع الأرباح إلى 3,890 دولارًا ثم 3,800 دولارًا ؛ حافظ على نقاط الوقف ضیقة فوق مستویات الزناد. ابتعد عن صفقات الشراء الجدیدة حتى یؤدی الاسترداد المستمر فوق 4175 دولارًا إلى إعادة تأکید الزخم.
اپل در مسیر ۴ تریلیون دلاری: پیشبینی Q1 2026 و کاتالیزورهای کلیدی هوش مصنوعی
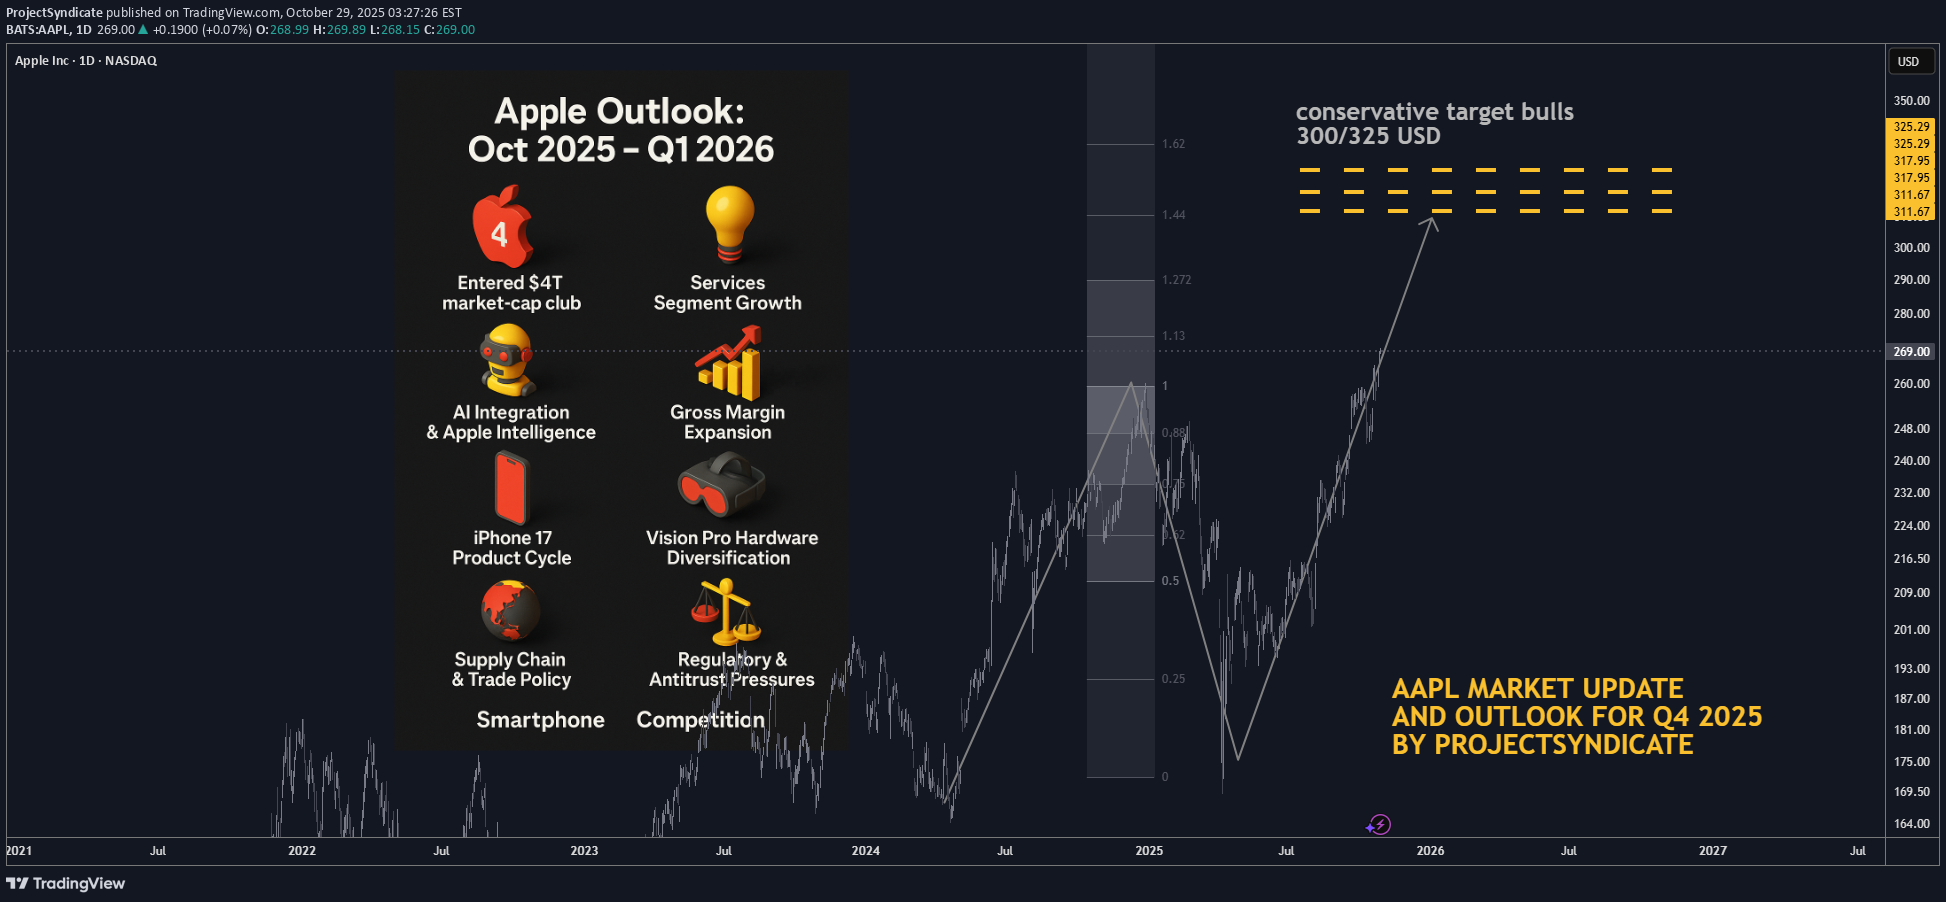
🍏 Apple Outlook: Oct 2025 – Q1 2026 🧠 Status and Tape Read. Apple (AAPL) has entered the $4 T market-cap club on Oct 28–29 2025, propelled by strong iPhone 17 sell-through and Services momentum. Shares pushed toward the $270 area intraday before easing, marking a powerful reversal from mid-year consolidation. Near-term, positioning is elevated into Thursday’s print; options imply ~±4% move on earnings. 📈 Path into Q1’26. Our base case shifts from a prolonged correction to a higher-low / buy-the-dip regime: dips toward the mid-$240s–$250s should attract sponsorship unless Services rolls over or China iPhone demand fades. A constructive tape through Q1’26 hinges on (1) Apple Intelligence engagement metrics, (2) iPhone 17 replacement/Android switcher rates, and (3) regulatory overhang. 📰 What’s New and recent headlines 🏆 Apple hits $4 T market value for the first time, joining Nvidia and Microsoft. Drivers: iPhone 17 traction and Services strength; stock up sharply since spring. 🗓️ Earnings set for Thu, Oct 30 (after-close); Street looking for growth in revenue/EPS; Services eyed >$100 B annual run-rate. 🔼 Loop Capital upgraded AAPL to Buy with $315 PT ahead of the move, citing iPhone cycle acceleration. 🧾 “Who Bought 8 Million Shares?” 🧺 JPMorgan Large Cap Growth Fund (SEEGX) increased its Apple position by ~8.15 million shares to ~32.9 million shares, per latest fund tracking. ⚙️ Catalysts Shaping Apple’s Stock Price in 2025–26 🤖 AI Integration & Apple Intelligence — Strength: 9/10 Rollout of on-device Apple Intelligence and upgraded Siri remains the core narrative into 2026. Look for user engagement datapoints and third-party app integrations at/after earnings. A positive read-through would validate the iPhone super-cycle argument. 💡 Services Segment Growth — Strength: 8.5/10 Consensus expects Services to push past a $100 B annual clip; durability watched versus regulatory pressure (DMA in EU, global app store scrutiny). A sustained >13% YoY growth print keeps multiple support intact. 📊 Gross Margin Expansion & Cost Efficiencies — Strength: 8/10 Management has guided 46–47% GM for FQ4 (tariff headwind embedded). Mix shift to Services + component deflation support FY26 margin resilience. 📱 iPhone 17 Product Cycle — Strength: 8/10 (↑ from 7.5) Early sell-through outpacing prior gen in the U.S. and China within first days; the iPhone 17 (incl. “Air”) is the incremental driver restoring unit momentum. 🥽 Vision Pro & Hardware Diversification — Strength: 7/10 Next-gen devices + Apple Intelligence tie-ins create optionality; still niche near-term but adds ecosystem gravity. 💵 Capital Returns — Strength: 7/10 $110 B buyback authorization remains a floor; watch cadence vs. stock at ATHs and post-print cash deployment commentary. 🌏 Supply Chain & Trade Policy — Strength: 6.5/10 China exposure/tariffs remain a swing factor; Apple has been absorbing some costs rather than pushing through prices on key models. ⚖️ Regulatory & Antitrust Pressures — Strength: 6/10 DMA compliance and global app store cases could trim Services take-rate; monitor any remedial changes called out on the call. 📈 Macro & Rates — Strength: 5/10 “Higher for longer” limits multiple expansion; any disinflation/soft-landing upside would expand P/E support. 🥊 Smartphone Competition — Strength: 5/10 Android OEM velocity still high in EM; Apple’s cycle needs sustained switcher share to outrun. 💼 Earnings Set-Up: FQ4 reporting Thu Oct 30 2025 📅 Consensus into print: • Revenue: ~$101–104 B (TipRanks ref: $102.2 B) • EPS: ~$1.74–$1.82 (TipRanks ref: $1.78) • Gross Margin guide: 46–47% (company indication) • Services: watch for >$100 B annualized pace confirmation • Implied move: options pricing ~±4% 🎧 Watch items on the call: Apple Intelligence activation/MAUs, iPhone 17 channel inventory, China mix, Services take-rate headwinds (EU), GM puts/takes (tariffs), cap-return cadence. 🎯 Street Positioning & Targets 🔼 Loop Capital: Buy, PT $315 (Oct 20/21 2025). 📊 General take: Many houses remain Overweight; focus turning to 2026 EPS power and AI monetization path. 🧭 Tactical View 0–3 Months 📈 Into/after print: Choppy but constructive. Chasing at ATHs is risky; prefer buy-on-weakness zones near $248–255 with stop discipline. A bullish guide/Services beat could sustain a breakout; a light AI engagement update or China wobble likely gets faded back into the mid-$250s. ⚠️ Risk-case: Regulatory headline or guide below mid-single-digit growth could quickly compress P/E and retest the $240s. 🚀 Bull-case: Clean beat/raise + AI usage KPIs → re-rate toward $290–300 into holiday. 🏁 Quick Milestone Recap 🥇 $4 Trillion Market Cap achieved on Oct 28–29 2025, making Apple the third public company (after Nvidia, Microsoft) to reach the level; iPhone 17 momentum and Services strength cited across coverage.🚀 Apple Outlook (Oct 2025 – Q1 2026) 🍏 Hit $4 T market cap, third company ever to reach the milestone. 🤖 Apple Intelligence & AI rollout driving next growth wave. 📱 iPhone 17 cycle strong, fueling demand recovery. 💡 Services segment on track for >$100 B annual run-rate. 📊 Gross margins guided at 46–47%, resilient vs. tariffs. 🥽 Expanding Vision Pro & AR/VR hardware ecosystem. 💵 $110 B buyback and dividends underpin valuation floor. 🌏 Supply-chain shift to India & Vietnam continues. ⚖️ Regulatory pressures in EU/US remain medium-term risk. 🧭 Base case: Buy-on-dips near $250 → target $290-300 if AI metrics beat.let me know your thoughts on the above in the comments section 🔥🏧🚀🎁Please hit the like button and 🎁Leave a comment to support our team!TSLA path to 550/650 USD Breakout Still PendingTSLA Catalysts Ranking: September 2025 update and Path ForwardGold next week: Key S/R Levels and Outlook for TradersGold Bull Market Update and Outlook Q4 2025 / Q1 2026
طلا سقوط کرد: آیا اصلاح قیمت تا ۳۵۰۰ دلار ادامه دارد؟
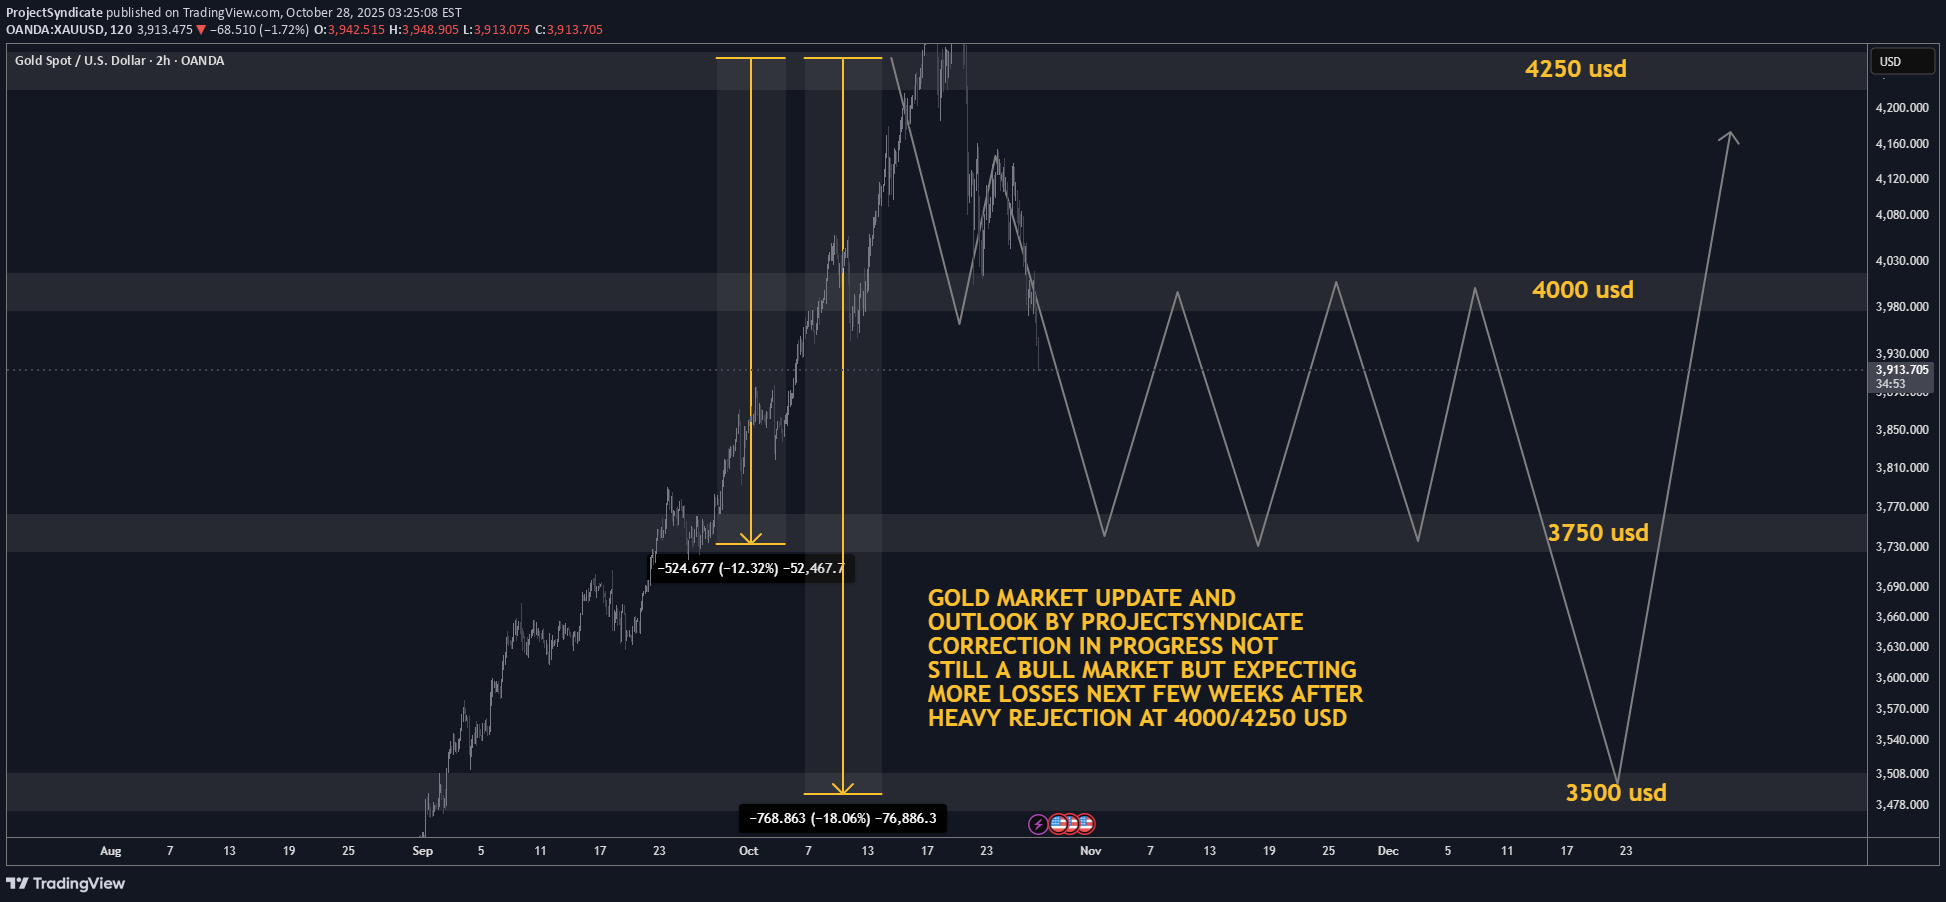
🟡 Where We Are Right now After ripping to fresh records, gold snapped hard — WSJ logged the steepest one-day loss in years last week and a follow-through weekly drop as longs unwound. Analysts across Kitco and others frame this as a technical/positioning correction after a parabolic run, with a fight around the $4k handle and scope to probe $3,750 → $3,500 if selling persists. Sentiment/flows flipped: GLD and other gold ETFs saw notable outflows into the selloff after heavy YTD inflows. That flow reversal is consistent with a near-term correction phase. 🔻 Why the Market Is Correcting Now 1️⃣ Positioning & Froth Unwinds The rally attracted outsized speculative length; once momentum cracked, forced de-risking kicked in. WSJ called out “long unwind” dynamics; Kitco says the correction could persist for months as near-term drivers fade. 2️⃣ $4k Failed on First Retest; Technical Break Triggered Stops Kitco flagged a “fight for $4k” with downside risk if that shelf gives. Once sub-4k prints hit, systematic sellers likely accelerated. 3️⃣ Flow Flip in ETFs After massive 2025 inflows, GLD posted a sharp daily outflow during the drop — classic late-cycle reversal behavior for a momentum move. 4️⃣ Macro Balance Less Supportive at the Margin Even with long-term tailwinds (deficits/geopolitics), the recent leg higher ran ahead of fundamentals. Kitco and others note easing physical tightness and cooling central-bank buying pace compared with earlier in the year, removing a key prop for spot. ⚙️ Near-Term Levels That Matter (Tactical) $4,000 → Battle zone. Regaining and holding above turns near-term tone neutral. $3,750 → First meaningful downside target; aligns with multiple analysts’ “healthy pullback” zone. $3,500 → Deeper correction magnet if flows/positioning continue to bleed; widely discussed as a plausible washout level. 🔮 4–8 Week Catalyst Map (What Can Push Price) 🏛️ Macro / Policy Treasury Quarterly Refunding (Nov 5): Mix/size guidance can sway the long-end, USD, and real yields — key for gold. A heavier bill tilt (and steady coupons) is less threatening than a surprise coupon ramp. Fed Communication Cadence: With the Oct 28–29 FOMC just occurred, watch minutes (Nov 19) + any guidance shifts. A less-dovish tone or firmer real yields = near-term headwind; growth scares or easing bias = support. US Data Prints: CPI/PCE, NFP, ISM — anything that re-prices the path of real rates. (Direction of real yields remains the single most important macro input.) 💰 Flows & Positioning ETF Flows (GLD/IAU): Continued outflows would confirm distribution; a turn back to net inflows often leads price inflections. COT Positioning: If spec length compresses materially, downside fuel diminishes — setting up a cleaner base. (Track weekly CFTC updates.) 🪙 Physical / Seasonal India Demand (festive/wedding season) and China retail demand can stabilize spot if discounts narrow and premiums re-emerge, but Kitco notes near-term tightness has eased versus the squeeze earlier in the rally. 📈 Base Case Outlook (Next 4–8 Weeks) Trend: We’re in a bull-market correction — momentum currently with sellers — inside a bigger, intact secular uptrend. WSJ + Kitco both frame it as a technical consolidation after a near-vertical ascent. Range Expectation: $3,500–$4,100 with whipsaws around $4k. The market likely tests $3,750 and could overshoot to $3,500 on negative macro surprises or persistent outflows before attempting a higher-low base. Bull Re-acceleration Triggers: (a) USD/real-yield rollover post-Refunding/Fed minutes (b) A visible reversal in ETF flows (c) Stabilization in Asia physical premiums (d) Fresh geopolitical shocks Bear Extension Risks: (a) Firmer real yields / stronger USD (b) Deeper ETF outflows and CTA/systematic supply (c) Evidence of slower central-bank demand than H1 (d) Soft physical uptake into dips ⚔️ Trade / Hedge Tactics If Underweight/Flat: Stagger bids $3,760 → $3,520, scale size smaller into weakness; insist on confirmation (stops above prior day’s high) before adding. If Long From Higher: Respect $3,750 — below it, tighten or partially hedge (short miners, long USD vs. FX beta, or buy short-dated puts) targeting $3,500 as a potential flush. If Momentum Trader: Let $4,000 decide regime. Sustained reclaims with rising on-balance volume/ETF creations = green light for a bounce to $4,080–$4,150; failure = fade rallies into $3,950–$3,980. 🧭 What I’m Watching Day-to-Day 1️⃣ Treasury refunding headlines (Nov 5) and term-premium reaction. 2️⃣ Fed minutes (Nov 19) and any shift in balance-of-risks language. 3️⃣ GLD/IAU flow tape (creations/redemptions). 4️⃣ Kitco/WSJ desk color on physical tightness and dealer inventories.🚨 GOLD MARKET CORRECTION: THE BULL PAUSES BUT NOT DEAD 🚨 💰 Gold peaked at $4,380, now sliding — momentum shifted to bears. 📉 Broke $4,000, spot near $3,920 — correction phase confirmed. 🔥 Overheated positioning + ETF outflows triggered the unwind. ⚙️ Next support: $3,750 → $3,500 key psychological zones. 🏦 Macro catalysts: Treasury refunding (Nov 5) & Fed minutes (Nov 19). 💵 Rising real yields / USD strength adding short-term pressure. 📊 ETF + COT flows will signal when washout ends. 🌏 India/China demand could stabilize spot in coming weeks. 🧭 Range view: $3,500–$4,100 over next 4–8 weeks. 🚀 Big picture: Still a bull market correction — reload zone coming soon.BREAK BELOW 3950/3960 USD EXPOSES FURTHER DOWNSIDE TARGETS TP1 3900 USD TP2 3850 USD. TP1 HIT ALREADY.
پیشبینی طلای هفته آینده: سطوح حیاتی حمایت و مقاومت برای معاملهگران
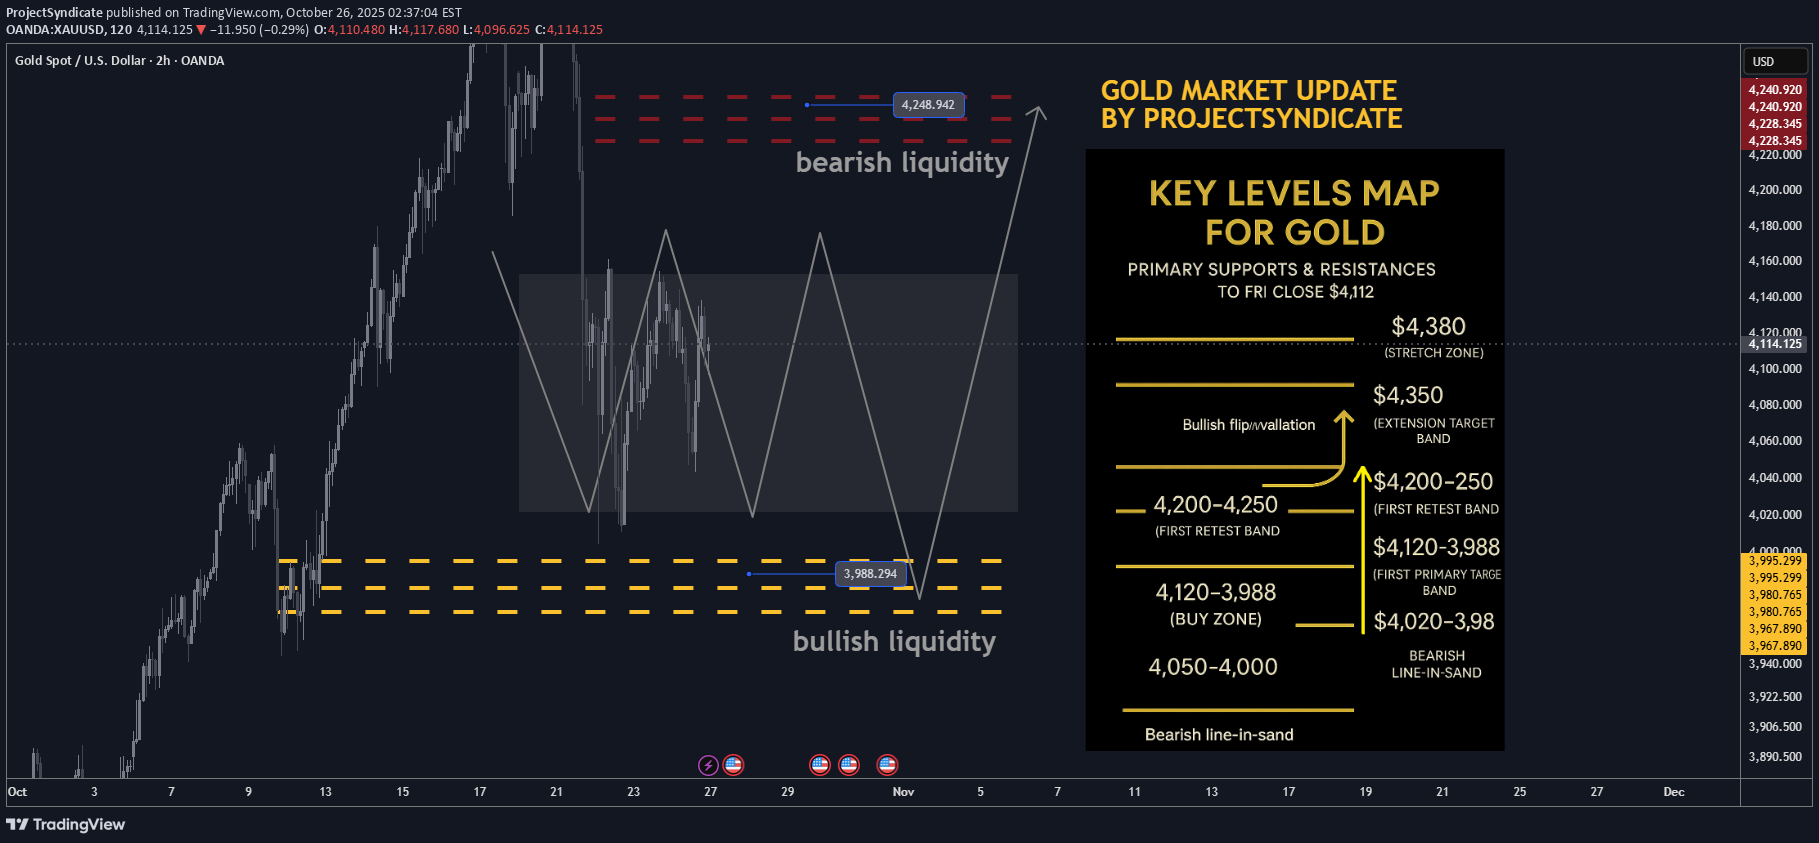
🔥 لقطة ذهبیة أسبوعیة – من PROJECTSYNDICATE 🏆 أعلى سعر/إغلاق: 4,380 دولارًا أمریکیًا ← ~4,112 دولارًا أمریکیًا — إغلاق أقل ضمن النطاق؛ تباطأ الزخم ولکنه ظل ثابتًا عند المقبض 4000 دولار. 📈 الاتجاه: الاتجاه الصعودی سلیم > 4,000 دولار؛ ذروة البیع إلى 4.1 ألف دولار — یفضل الإعداد الارتداد المنعکس. 🛡 الدعم: 4,120 دولارًا - 4,080 دولارًا → 4,020 دولارًا - 3,988 دولارًا (سیولة صعودیة) → 4,000 دولارًا / 3,980 دولارًا یجب الاحتفاظ بها. 🚧 المقاومة: 4,200 دولار أمریکی / 4,250 دولار أمریکی (سیولة هبوطیة) / 4,300 دولار أمریکی → امتداد 4,350 دولار أمریکی - 4,380 دولار أمریکی. 🧭 التحیز الأسبوع المقبل: شراء الانخفاض بقیمة 4,020 دولارًا - 3,988 دولارًا؛ یستعید الزخم ما فوق 4200 دولار أمریکی ویستهدف 4250 دولارًا أمریکیًا → 4300 دولارًا أمریکیًا - 4350 دولارًا أمریکیًا. الإبطال الذی یقل عن 3,980 دولارًا أمریکیًا یخاطر بتدفق أعمق إلى 3,950 دولارًا أمریکیًا. 🌍 الریاح الخلفیة الکلیة: • السیاسة: تخفیف العوائد الحقیقیة داعمة عند الانخفاضات. • الفورکس: انخفاض نغمة الدولار الأمریکی = خلفیة بناءة. • التدفقات: مشتریات البنک المرکزی + الفائدة التکتیکیة لصنادیق الاستثمار المتداولة تدعم مبلغ 4 آلاف دولار. • الجغرافیا السیاسیة: التجارة/التعریفات الجمرکیة والتوترات الإقلیمیة تبقی عروض السلامة على قید الحیاة. 🎯 منظر الشارع: لا تزال بعض المنازل تطفو على سعر 5000 دولار للأونصة بحلول عام 2026 بناءً على سیاسات تخفیف السیاسات وتنویع الاحتیاطیات. ________________________________________ 🔝 مناطق المقاومة الرئیسیة • 4,200-4,230 دولارًا أمریکیًا للعرض الفوری بدءًا من الإغلاق الأسبوعی • سیولة هبوطیة بقیمة 4,250 دولارًا أمریکیًا / الهدف الأساسی • 4,300 دولار - 4,350 دولار ملحق band • ارتفاع / امتداد سابق بقیمة 4,380 دولارًا أمریکیًا 🛡 مناطق الدعم • 4,120 دولارًا - 4,080 دولارًا لإعادة الاختبار الأول band تحت مستوى الإغلاق • منطقة شراء بقیمة 4,020 دولارًا - 3,988 دولارًا (السیولة الصعودیة) • 4,000 دولار أمریکی / 3,980 دولار أمریکی یجب حمل الرف ________________________________________ ⚖️ سیناریو الحالة الأساسیة توقع حدوث تراجعات إلى 4120 دولارًا - 4080 دولارًا و4020 دولارًا - 3988 دولارًا لجذب المشترین، مما یؤدی إلى تدویر السعر مرة أخرى نحو 4200 دولار ثم 4250 دولارًا. القبول الذی یزید عن 4,250 دولارًا أمریکیًا یدعو إلى الانتقال إلى 4,300 دولار أمریکی - 4,350 دولارًا أمریکیًا. 🚀 مشغل الاختراق یؤدی الدفع / القبول المستدام> ~ 4,250 دولارًا أمریکیًا إلى فتح 4,300 دولارًا أمریکیًا → 4,350 دولارًا أمریکیًا، مع وجود مجال للوصول إلى 4,380 دولارًا أمریکیًا إذا استمر الزخم. 💡محرکات السوق • العائد الحقیقی drift أقل (خلفیة حمل داعمة) • لیونة الدولار تساعد المعادن • استمرار تراکم CB. تستقر تدفقات صنادیق الاستثمار المتداولة عند الانخفاضات • المخاطر الرئیسیة (التجارة/الجغرافیا السیاسیة) التی تدعم الطلب على الملاذ الآمن 🔓 خطوط الزناد الثور / الدب • صعودی فی الأعلى: 4,020 دولار - 4,100 دولار (یدافع المشترون عن عملیات التراجع) • هبوطی أدناه: 3,980 دولارًا (تتوسع المخاطر؛ وتهدد 3,950 دولارًا) 🧭 الإستراتیجیة شراء بسعر منخفض من السیولة الصعودیة (~ 3,988 دولارًا أمریکیًا) بهدف 4,250 دولارًا أمریکیًا؛ ظروف ذروة البیع تفضل ارتدادًا قویًا. أضف القوة التی تزید عن 4200 دولار إلى 4300 دولار - 4350 دولارًا. أبقِ المخاطر محدودة عند مستوى أقل من 3,980 دولارًا - 4,000 دولار للإلغاء. 🎁یرجى الضغط على زر الإعجاب و 🎁اترک تعلیقًا لدعم فریقنا! واسمحوا لی أن أعرف أفکارک حول ما ورد أعلاه فی قسم التعلیقات 🔥🏧🚀
پیشبینی ریاضیاتی دقیق: کف بعدی بیت کوین کجاست؟ (احتمال ۹۵ هزار دلار)
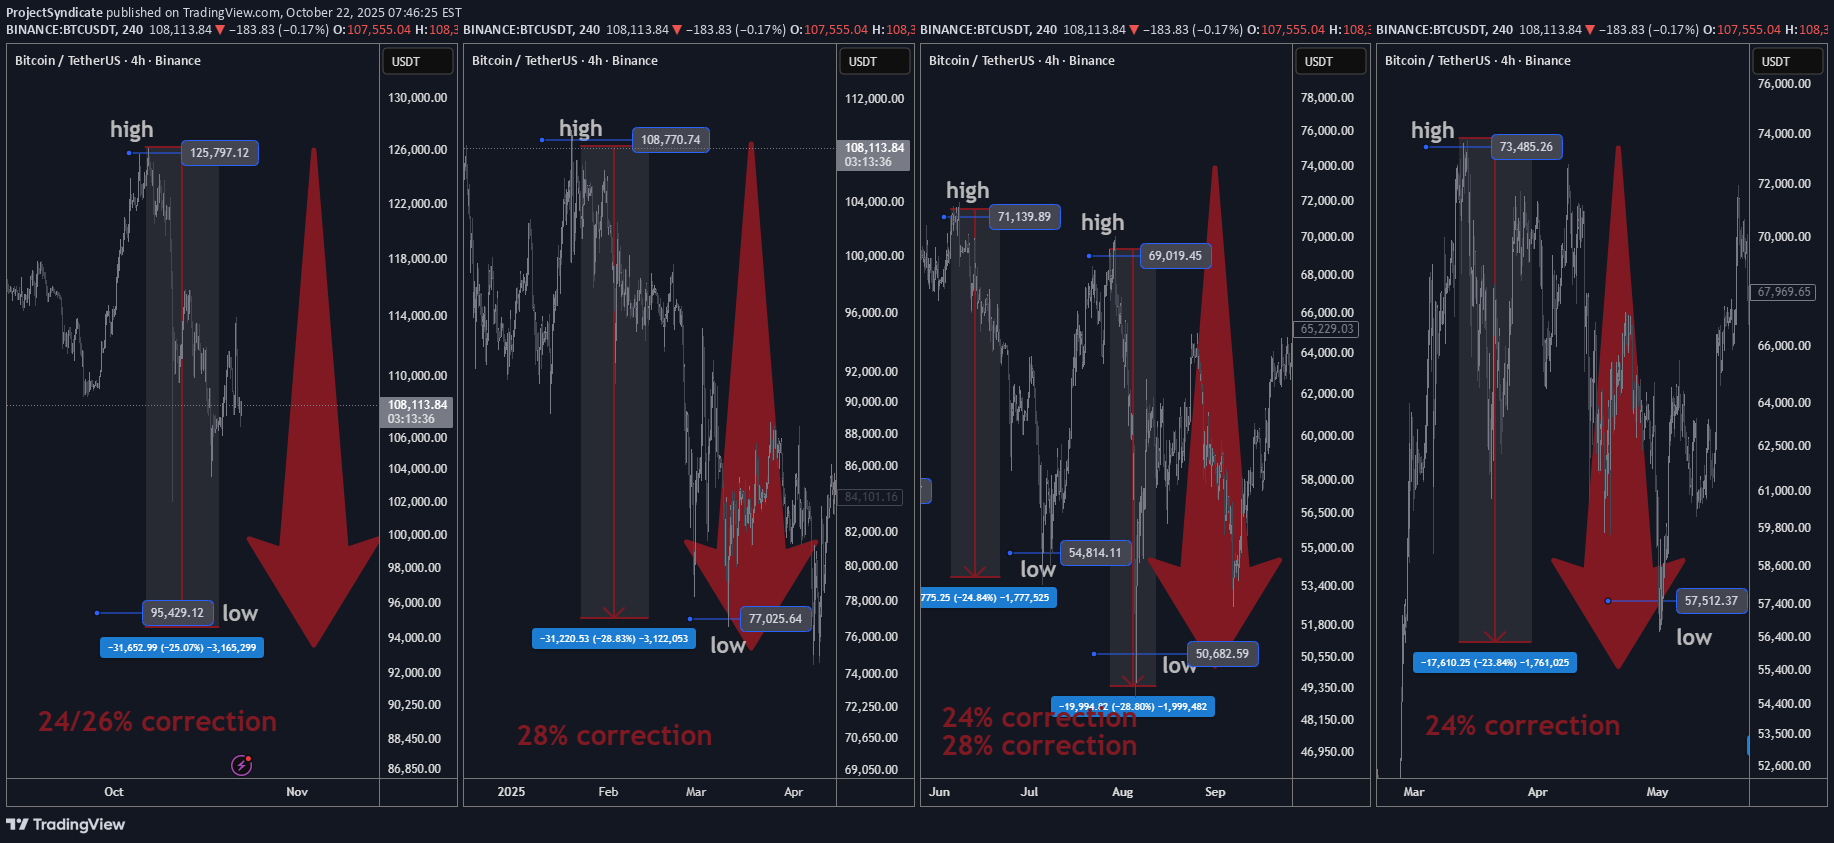
قام Bitcoin بتصحیح ما یقرب من منتصف 20% بشکل متکرر خلال آخر 12-24 شهرًا. باستخدام ملف تعریف السحب التجریبی هذا، فإن تصحیح الحالة الأساسیة بنسبة ~ 25٪ من أعلى مستوى حدیث قدره 126000 دولار یعنی انخفاض تصحیح محتمل ** بالقرب من 94500 دولار - 95000 دولار. هذا توقع ذو احتمالیة عالیة یعتمد على الریاضیات والإحصائیات الحقیقیة، ولیس العلم خیالی. لا توجد مثلثات متوسعة، وحسابات موجات إلیوت، وأنماط وولف وتنین. Bitcoin لا یتاجر بالکتاب المدرسی. هذا هو التحلیل الفنی فی العالم الحقیقی بواسطة متداول pro. وجهة النظر التکتیکیة: توقع تدفقًا نهائیًا نحو 95 ألف دولار تقریبًا، ثم انعکاس/ارتداد إذا تأکد هیکل السوق وظروف السیولة. الثقة: عالیة جدًا — اتساق الأنماط ملحوظ، لکن العملات المشفرة تظل حساسة للعناوین الرئیسیة والسیولة. استخدم ضوابط المخاطر المنضبطة. 🧠 2) التصحیحات الأخیرة (من 12 إلى 24 شهرًا الماضیة) #مرتفع → انخفاض٪ السحب 1$72,000 ← $54,00025% 2$108,000 ← $76,00028% 3$70,000 ← $50,00028% 4$74,000 ← $56,00024% المتوسط التجریبی للسحب: (25+28+28+24)÷4 = 26.25%. سنستخدم 25% کافتراض أساسی (محافظ مقابل المتوسط 26.25%). ✅ الإسقاط للتصحیح الحالی الرقم المرجعی المرتفع: 126,000 دولار الحالة الأساسیة (25%) منخفضة: 126,000 دولار × (1 - 0.25) = 94,500 دولار المتوسط التجریبی (26.25%) منخفض: 126,000 دولار × (1 - 0.2625) = 92,925 دولار منطقة الشراء المتوقعة: 92.9 ألف دولار – 95 ألف دولار، تتمرکز بالقرب من 95 ألف دولار. 🎯 اسمحوا لی أن أعرف أفکارکم حول ما ورد أعلاه فی قسم التعلیقات 🔥🏧🚀🎁یرجى الضغط على زر الإعجاب و 🎁اترک تعلیقًا لدعم فریقنا!ضخم Bitcoin الحوت یبدأ بمبلغ ضخم قدره 122,000,000 دولار BTC قصیر dailyhodl.com/2025/10/21/massive-bitcoin-whale-initiates-whopping-122000000-btc-short/No BTC لن ینعکس عند 100 ألف، لأن شخصًا ما أخبرک بذلک على X أو TikTok
إخلاء المسؤولية
أي محتوى ومواد مدرجة في موقع Sahmeto وقنوات الاتصال الرسمية هي عبارة عن تجميع للآراء والتحليلات الشخصية وغير ملزمة. لا تشكل أي توصية للشراء أو البيع أو الدخول أو الخروج من سوق الأوراق المالية وسوق العملات المشفرة. كما أن جميع الأخبار والتحليلات المدرجة في الموقع والقنوات هي مجرد معلومات منشورة من مصادر رسمية وغير رسمية محلية وأجنبية، ومن الواضح أن مستخدمي المحتوى المذكور مسؤولون عن متابعة وضمان أصالة ودقة المواد. لذلك، مع إخلاء المسؤولية، يُعلن أن المسؤولية عن أي اتخاذ قرار وإجراء وأي ربح وخسارة محتملة في سوق رأس المال وسوق العملات المشفرة تقع على عاتق المتداول.