
LupaCapital
@t_LupaCapital

ما هو الشيء الذي ننصحك بشراءه من المواد الغذائية؟
سابق في الشراء
پیام های تریدر
مرشح
LupaCapital
پیشبینی طلا (XAU/USD): ریزش اصلاحی در راه است؟ تحلیل موجی و سطوح کلیدی
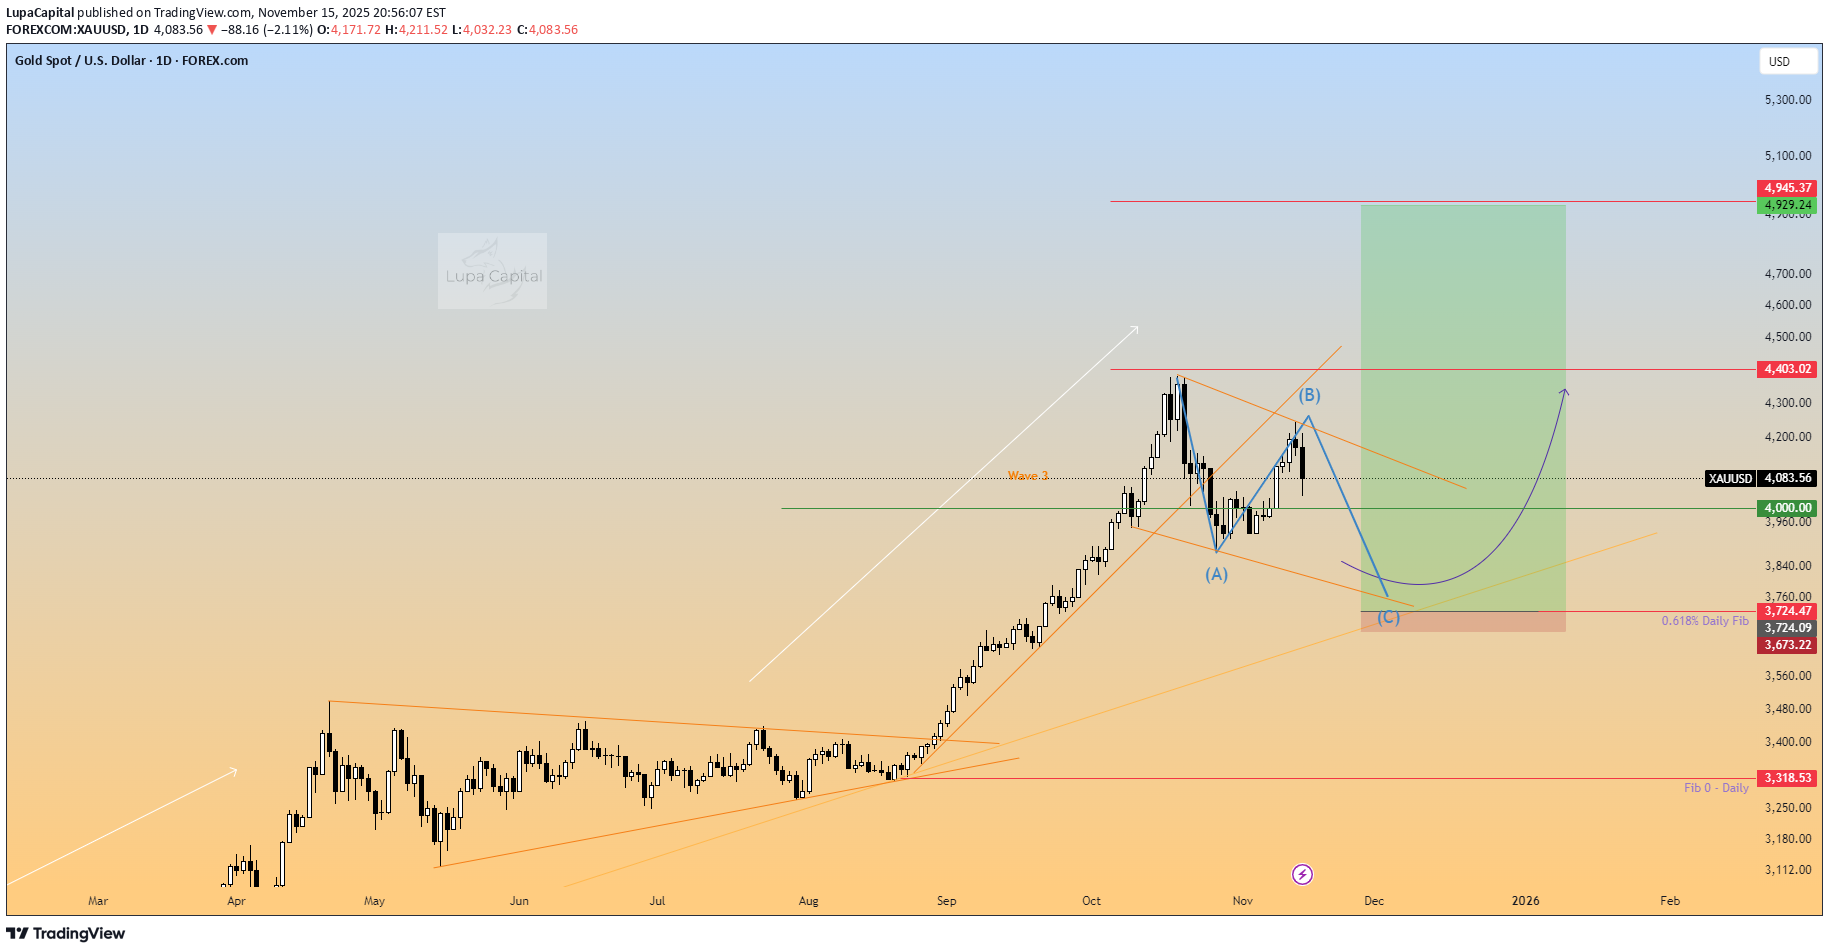
أنا أشیر إلى الرسم البیانی الیومی للسعر والتعدادات الرئیسیة تتماشى مع العد الموجی ومستویات التداول منحنى العرض والطلب على أساس فترات فجوة القیمة العادلة لجلسات التداول الأسبوعیة المرسومة على الرسم البیانی الیومی على فترات 60. الموجة الحالیة - 3 من 5 فی عدد موجات إلیوت. تجربة الهیکل التصحیحی ABC. تشکل الهیکل التصحیحی B الآن بشکل جید عند 4,232 دولارًا. XX وتم رفضه بشکل جید، مع تشکیل عرض جدید - استنادًا إلى نقطة هیکلیة ثابتة عند منطقة 4,372 دولارًا - 4,217 دولارًا داخل الشمعة الداخلیة. لقد اخترق السعر الفتیل بشکل جید وتم بیعه وفقًا لذلک. الآن ماذا یحدث؟ شیئین - 1. سینخفض السعر إلى 4000.00 دولار أمریکی وسیستخدم هذه المنطقة النفسیة وکتلة الأمر السابقة لإنشاء کتلة أمر لطیفة وmove للأعلى - مع الاحتفاظ بالتحکم فی الطلب. 2. یبدو أن هذا عبارة عن إعداد لمحاذاة فنیة للهبوط أو القاعدة أو الهبوط حیث تتشکل قناة السعر أو الموجة التصحیحیة من النقطة B - إلى النقطة C. تظهر الفجوة بین الهیکل الیومی الأیسر ما بین 3,850 دولارًا - 3,720 دولارًا أمریکیًا، وهی منطقة الاهتمام الحقیقیة التی سیشتق منها محرک الطلب. المفتاح الرئیسی للمناطق أسود = ثلاثة أشهر الأزرق = شهریا أرجوانی = أسبوعی الوردی = مثال على المربع الموحد (یومیًا) برتقالی = یومی White = موجة Red = الخطوط - فیبوناتشی، محاذاة الموجة. تحذیر من المخاطر إن تداول المنتجات ذات الرافعة المالیة مثل الفورکس والسلع والعقود مقابل الفروقات یحمل فی طیاته درجة عالیة من المخاطر وبالتالی قد لا یکون مناسبًا لکل مستثمر. قبل التداول فی سوق العملات الأجنبیة أو السلع أو عقود الفروقات، ضع فی اعتبارک أهدافک الاستثماریة ومستوى خبرتک ورغبتک فی المخاطرة. یجب ألا تخاطر أبدًا بأکثر مما یمکنک تحمل خسارته. إذا فشلت فی فهم المخاطر التی تنطوی علیها أو لم تکن متأکدًا منها، فیرجى طلب مشورة مستقلة وتذکر إجراء العنایة الواجبة نظرًا لأن المعاییر تختلف لتناسب الفرد. فیما یلی بعض المقتطفات من الفیدیو - یرجى الاستماع مرة أخرى فی حالة فقدان أی تفاصیل. هل تستمتع بالإعدادات؟ محلل محترف یتمتع بخبرة تزید عن 8 سنوات فی أسواق رأس المال الترکیز على المخرجات الفنیة ولیس الأساسیات رکز على الاستثمار فی التحرکات الموضعیة طویلة المدى قم بتوفیر التحدیثات عند الضرورة - مع أفکار محدثة جدیدة لتتبع التقدم. إذا أعجبتک الفکرة یرجى ترک إعجاب أو تعلیق. إلى جمیع المتابعین، أشکرکم على دعمکم المستمر. شکرا، LVPA MMXXIV
LupaCapital
پیشبینی طلای جهانی (XAUUSD): آیا موج اصلاحی ABC در راه است؟
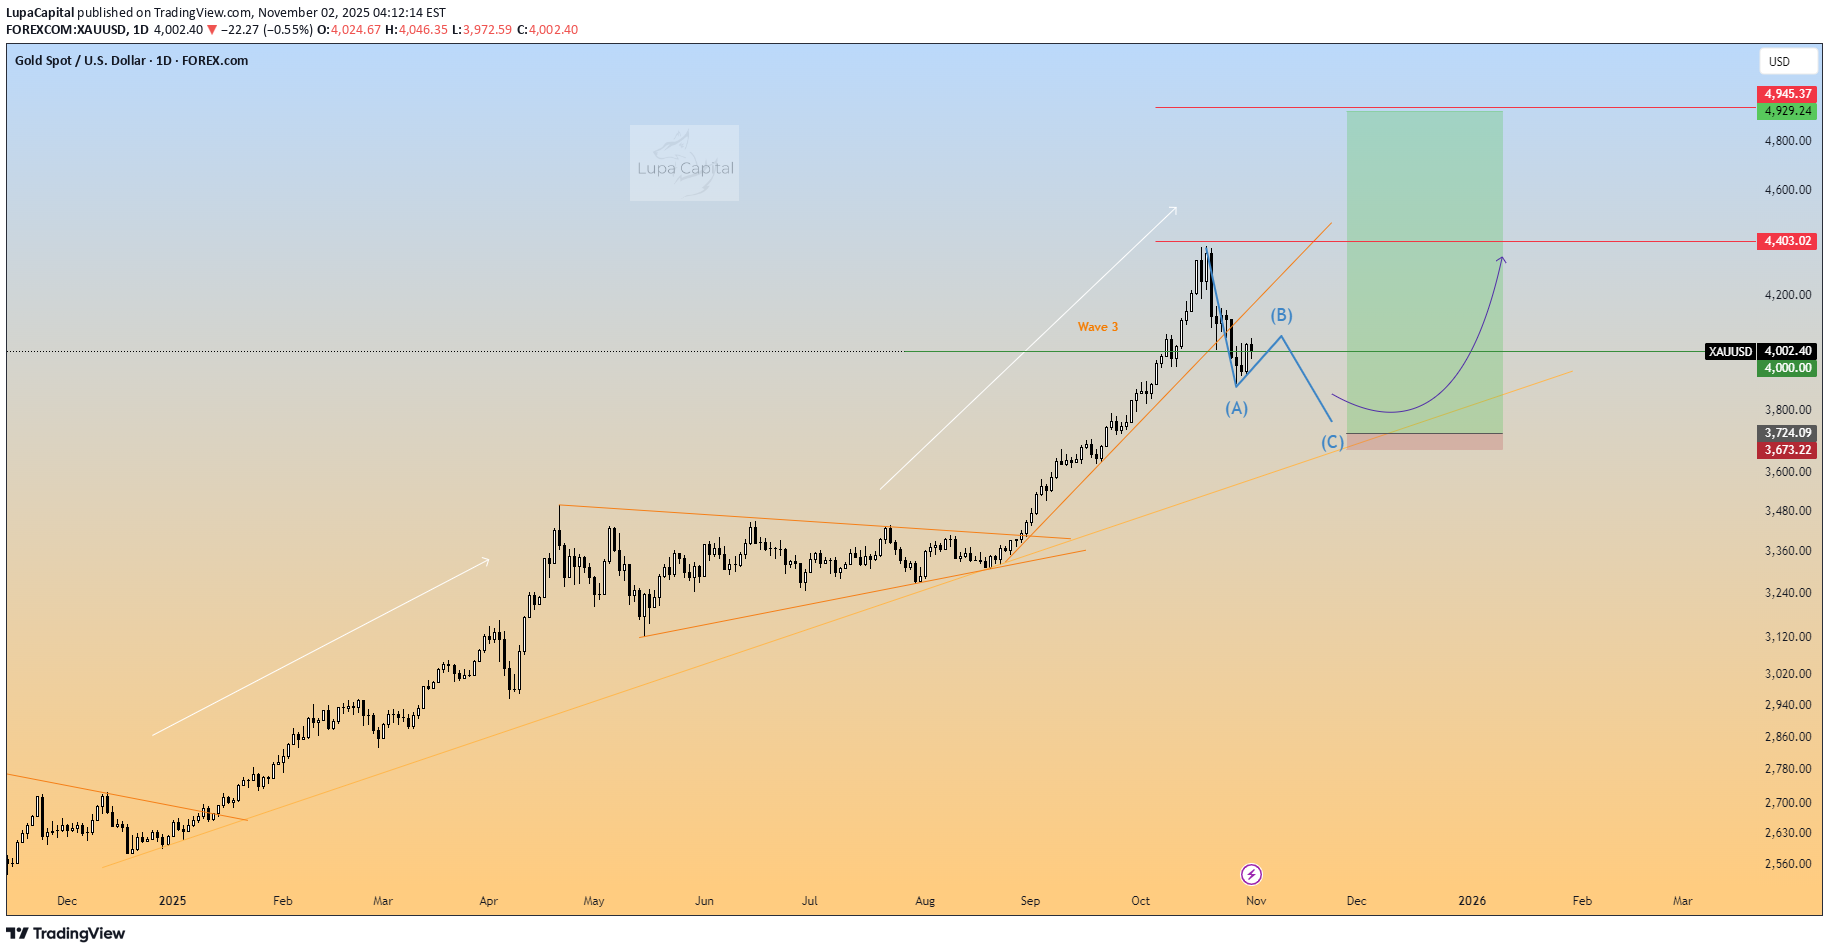
تحدیث للمنشور السابق. لا یزال هناک وقت طویل فی انتظار حدوث الهیکل التصحیحی - أولاً الاختراق والثبات تحت مستوى 4000 دولار (المستوى الرئیسی). القناة الهبوطیة - إلى 3800 دولار وهو مجال آخر مثیر للاهتمام - والسبب هو أنها تحتفظ بحجم کبیر عند نقطة هیکلیة أقل من 3800 دولار. لذا، فإننا نترقب ظهور النموذج التصحیحی واکتماله. تظهر صورة الرسم البیانی الیومی نمط تفکیری وفرصة أنتظر عودة السعر إلیها. أنا أشیر إلى الرسم البیانی الیومی للسعر والتعدادات الرئیسیة تتماشى مع العد الموجی ومستویات التداول منحنى العرض والطلب على أساس فترات فجوة القیمة العادلة لجلسات التداول الأسبوعیة المرسومة على الرسم البیانی الیومی على فترات 60. الموجة الحالیة - 3 من 5 فی عدد موجات إلیوت. تجربة الهیکل التصحیحی ABC. المفتاح الرئیسی للمناطق Red = ثلاثة أشهر الأزرق = شهریا أرجوانی = أسبوعی الوردی = مثال على المربع الموحد (یومیًا) برتقالی = یومی تحذیر من المخاطر إن تداول المنتجات ذات الرافعة المالیة مثل الفورکس والسلع والعقود مقابل الفروقات یحمل فی طیاته درجة عالیة من المخاطر وبالتالی قد لا یکون مناسبًا لکل مستثمر. قبل التداول فی سوق العملات الأجنبیة أو السلع أو عقود الفروقات، ضع فی اعتبارک أهدافک الاستثماریة ومستوى خبرتک ورغبتک فی المخاطرة. یجب ألا تخاطر أبدًا بأکثر مما یمکنک تحمل خسارته. إذا فشلت فی فهم المخاطر التی تنطوی علیها أو لم تکن متأکدًا منها، فیرجى طلب مشورة مستقلة وتذکر إجراء العنایة الواجبة نظرًا لأن المعاییر تختلف لتناسب الفرد. فیما یلی بعض المقتطفات من الفیدیو - یرجى الاستماع مرة أخرى فی حالة فقدان أی تفاصیل. هل تستمتع بالإعدادات؟ محلل محترف یتمتع بخبرة تزید عن 8 سنوات فی أسواق رأس المال الترکیز على المخرجات الفنیة ولیس الأساسیات رکز على الاستثمار فی التحرکات الموضعیة طویلة المدى قم بتوفیر التحدیثات عند الضرورة - مع أفکار محدثة جدیدة لتتبع التقدم. إذا أعجبتک الفکرة یرجى ترک إعجاب أو تعلیق. إلى جمیع المتابعین، أشکرکم على دعمکم المستمر. شکرا، LVPA MMXXIV
LupaCapital
پیشبینی انفجاری طلا در سال 2025: آیا 4000 دلار در انتظار است؟
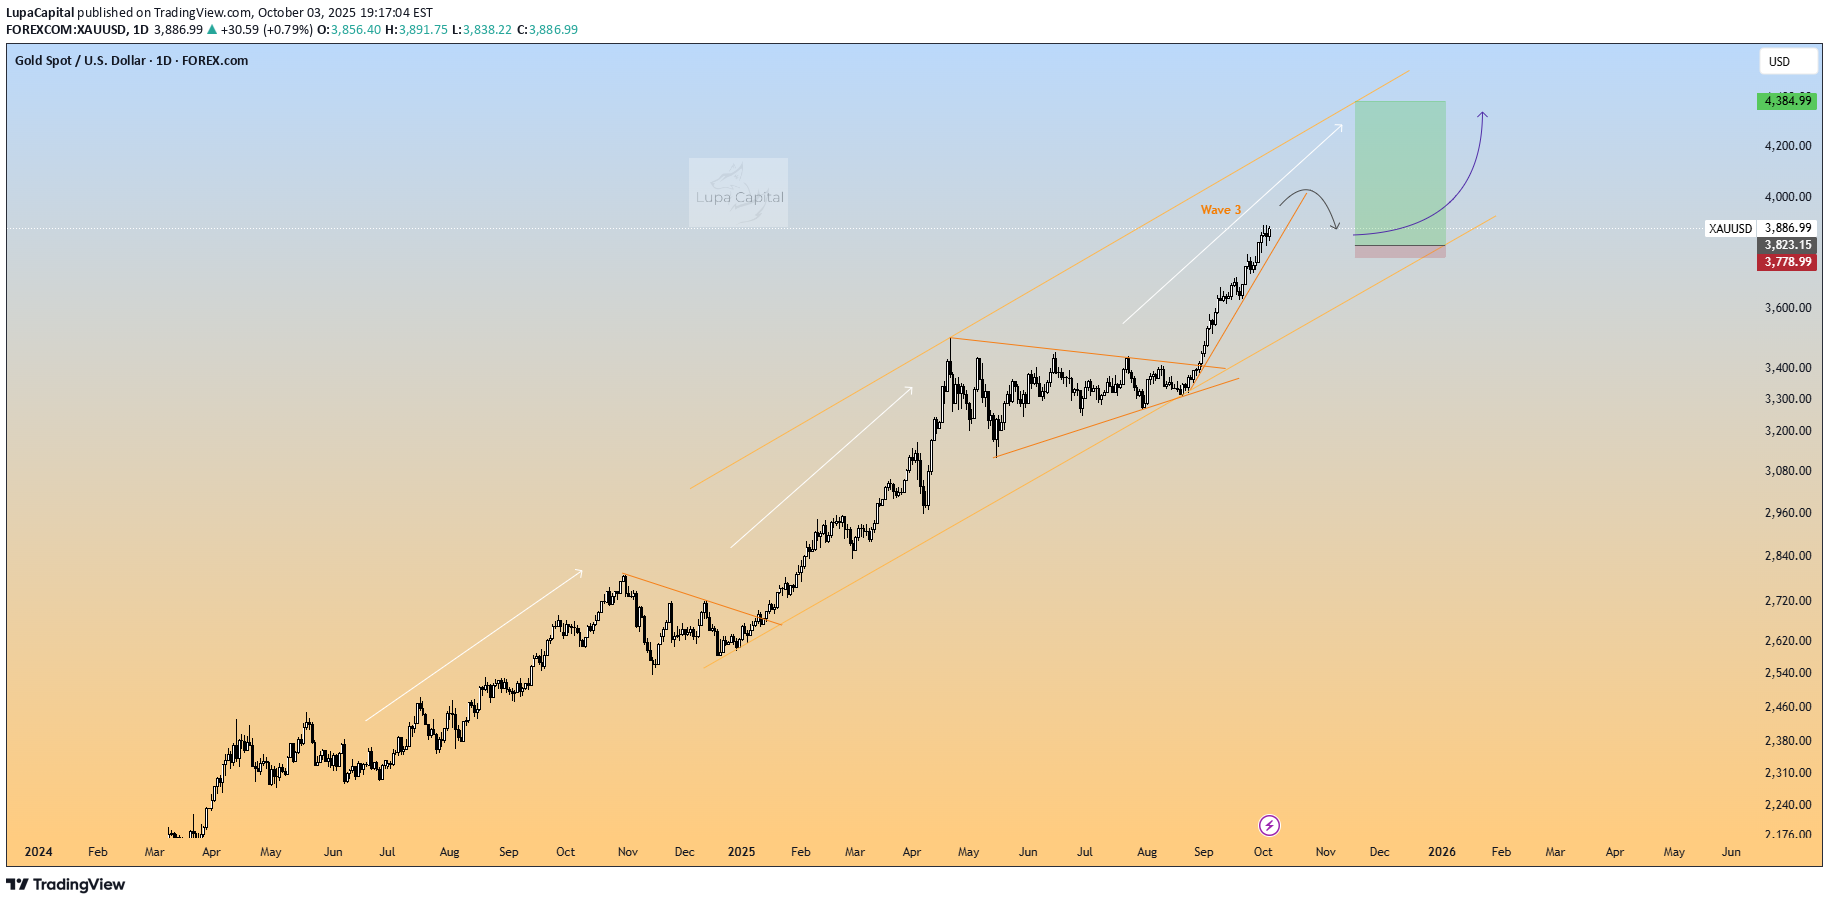
مرحبا ، لقد مر وقت. لقد کنت أعمل فی بناء کومة فی XAG ، Xau Scherspes. لقد عدت الآن ، لا یزال الذهب یعطی عائدًا هائلاً عند الطباعة والیمین (بمعنى النمو). لا أعرف إلى أین سینتهی هیکل السعر ، ومع ذلک فهی فرصة محتملة للغایة ، سنصل إلى 4000 دولار أمریکی لکل أوقیة ، ونواصل رفعها. تُظهر صورة الرسم البیانی الیومی نمط تفکیری وفرصة فی انتظار عودة السعر إلیها. أنا أشیر إلى مخطط السعر الیومی والتهم الرئیسیة تتماشى مع مستویات تداول منحنى العد والطلب على الموجة بناءً على فترات فجوة القیمة العادلة فی جلسات التداول الأسبوعیة المرسومة إلى مخطط یومی على فترات 60. الموجة الحالیة - 3 من 5 فی عدد الموجة Elliott. مفتاح رئیسی للمناطق Red = ثلاثة أشهر الأزرق = شهری الأرجوانی = أسبوعی Pink = مثال مربع توحد (یومیًا) برتقالی = یومیًا تحذیر المخاطر تنقل منتجات التداول المربوطة مثل الفورکس والسلع و CFD ، معها مستوى عالٍ من المخاطر ، وبالتالی قد لا تکون مناسبة لکل مستثمر. قبل تداول الصرف الأجنبی أو سوق السلع أو CFD ، فکر فی أهداف الاستثمار الخاصة بک ومستوى الخبرة والشهیة المخاطرة. یجب ألا تخاطر أبدًا أکثر مما یمکنک أن تخسره. إذا فشلت فی فهم أو عدم الیقین من المخاطر التی تنطوی علیها ، فیرجى طلب نصیحة مستقلة وتذکر إجراء العنایة الواجبة حیث تختلف المعاییر لتناسب الفرد. فیما یلی بعض من Aways Aways من الفیدیو - یرجى الاستماع مرة أخرى فی حالة تفویت أی تفاصیل. هل تستمتع بالإعدادات؟ محلل محترف یتمتع بخبرة 8 سنوات فی أسواق رأس المال الترکیز على الإخراج الفنی ولیس الأساسیات الترکیز على الاستثمار من أجل التحرکات الموضعیة طویلة الأجل قدم التحدیثات عند الضرورة - مع الأفکار المحدثة الجدیدة التی تتبع التقدم. إذا کنت تحب الفکرة ، فیرجى ترک مثل أو التعلیق. لجمیع المتابعین ، شکرًا لک على دعمک المستمر. شکرًا، LVPA MMXXIV
LupaCapital
BTC USD - Technical regression & Imbalances

G'Day ، هذا هو أول تحمیل تحلیل الفیدیو ، وبالتالی فإن الطول هو شیء أود أن أقدمه أن أکون أکثر إیجازًا فی المستقبل ، ولکن من أجل جذب السوق الأوسع ، یجب تبسیط التقنیات. ملاحظة قبل القراءة - هذا هو تحلیل التنبؤ - استنادًا إلى استراتیجیة تداول طویلة الأجل تبحث عن مناطق الطلب/التورید الطازجة. تم وضع علامة محایدة على الطلب الشهری الإجمالی فی السیطرة ، حتى یتم حدوث فرصة رفض PCP أو فرصة طویلة من استراحة وإعادة اختبار هذا الاتجاه. بشکل عام ، حیث یتم تشکیل اختلال التوازن وینبئ البائعون تغییر الأیدی بسبب شراء المزید من الزیادات فی البائعین الشاملین. حتى یتم استیفاء هذه المعاییر - لا یتم اتخاذ أی تجارة حتى یتم تأکید التفاعل أو الکسر أو المنحنى. ستبحث استراتیجیة الاستثمار على المدى الطویل عن عملیات الشراء کجزء من الدورة التالیة. هذا استثمار ولیس خطوة سریعة استنادًا إلى الأطر الزمنیة المنخفضة. مفتاح Master for Zonesred = Three Monthblue = MonthlyPurple = WeeklyPink = Three ، Four Dayorange = Dailyrisk warningtrading منتجات الاستفادة من الفورکس والسلع و CFDs ، وحملها ، قد لا تکون مناسبة للمخاطر. قبل تداول الصرف الأجنبی أو سوق السلع أو CFD ، فکر فی أهداف الاستثمار الخاصة بک ومستوى الخبرة والشهیة المخاطرة. یجب ألا تخاطر أبدًا أکثر مما یمکنک أن تخسره. إذا فشلت فی فهم أو عدم الیقین من المخاطر التی تنطوی علیها ، فیرجى طلب نصیحة مستقلة وتذکر إجراء العنایة الواجبة. التحرک المحتملة المحتملة - الاستراحة الصعودیة على المدى القصیر وإعادة تحمیل منطقة PCP تشکیل کلایس کلایلونج ، النتیجة المحتملة المحتملة للمعادلة للمسار القادم. تعرف على أفکارک وتحلیلاتک. کل رأی صالح عند إجراء البحوث. هل تستمتع بالإعدادات؟ محلل محترف یتمتع بخبرة تزید عن 5 سنوات فی MarketSfocus على الإخراج الفنی ولیس الأساسیات فی الاستثمار فی تحدیثات MovesProvide على المدى الطویل عند الضرورة - مع وجود أفکار جدیدة محدثة تتبع التقدم.
LupaCapital
Dash USD - Buy and hold for 2022

Hello Traders and Analysts,Welcome to 2022. This year, less posting, but more closer measurement analysing a smaller group of pairs.This refines analysis and provides clearer insights, while the principles of investment are still covered in detail.Breakdown:1. Note2. Contents3. Research breakdown4. Education recap5. Information on Lupa.A Note before reading - this is a forecast analysis - based upon our trading strategy. This is tagged long, due to purchasing further increments upon imbalances.Please do not take this as face value and conduct the relevant investment strategy to successfully trade the probabilities.Note* this analysis is a positional accumulation using a cost average upon positional aggregation. Short term losses incurred will not be realised, instead buying opportunities will be added. For CFD purposes, positions can be added with wider stop losses but minimal risk lost. Risk WarningTrading leveraged products such as Forex, commodities and CFDs, carries with it a high level of risk and so may not be suitable for every investor. Prior to trading the foreign exchange, commodity or CFD market, consider your investment objectives, level of experience and risk appetite. You should never risk more than you can afford to lose. If you fail to understand or are uncertain of the risks involved, please seek independent advice and remember to conduct due diligence.Master Key for zonesRed = Three MonthBlue = MonthlyPurple = weeklyScarlet [Red] - Four dayOrange = DailyGreen = 8 HourGrey = 4hourPink = 1 hourMonthly Imbalance for buyingThe main criteria for longs Strong wicks showing that the zone has failed to close within the imbalance. Net close out of the imbalance using August 20 - this coincides with the new monthly wicks proceeding creating higher highs. We have an inside bar which essentially on the monthly provides a bear trap - look down below for the weekly to see the change of hands closer. Looking left, the monthly candlesticks have created moves to establish supply imbalances. Adding supply imbalance as targetsStructure understandingUsing the Fibonacci from price formations - this has established zone for profit targets and change of hands zones which is a logical positional play in technical analysis. Things which are critical to understand here The swing low of the Fibonacci starts at "1", whereby price has established a strong imbalance candle The other established area is the retracement from the high, which >90% confidence within back testing scenarios across 11 crypto pairs, the established supply imbalance from the "0" or top of the swing - (which also aligns with a previous wick close). Price will look to a weekly pivot point. Price will extend to -0.618 or 1.1618 Fibonacci, which will provide a zone where price will enter a profit taking zone and subsequently a over buying imbalance and now create a selling imbalance. Not the previous top wick closes in line with the bearish open price.Weekly ImbalancesDaily Fibonacci Sequence completedPrice now has to break the following levels.I'm aware on the weekly a short opportunity is still present as the monthly zone can still be tested to buy at $108-100 zone, but the monthly also shows a positional change of hands from supply to demand imbalances.If the scenario where a rejection of either -0.27 [$150] and or -0.618 [$123.63] is present, then sell positions can be added to hedge or await buying due to the nature of a bear trap in smaller timescales.Let's view the Fibonacci chartThe swing high and swing low can be applied, measured sells between $245-$222 would have been a high probability of a selling imbalance, this is due to the gearing of daily candle sticks forming a basis of structure which on the three day chart [see 1.1] shows the netting off, where the imbalance meets the close out.1.1Here is the three day chart, which shows the selling imbalance where the netting had occurred. (note, on the weekly the wick created a half weekly high within the imbalance zone).What now?Well, two scenarios will occur for the bullish curve1. being the likelihood of a buying position from a breakout of the buy where price will climb after being squeezed but creates lower highs on the daily and three day chart.2. The second scenario, is based on the imbalance being retested on a deeper correction whereby the -0.618 [daily is tested] or on a higher timeframe, Monthly* - the correction will be based on the wick low (looking left).So long as the chart pushes up and to the right, longs are activated.Buying zones - daily, removedCrypto dominancePossibilities Since it is impossible to predict paths understand scenario analysis I have concluded these two scenarios to create two pathways, there are opportunities to buy accumulate positions here.Orange - follows closer to a daily timeframeWeekly - downside can still occur, but will tail off due to additional volume, cash conversion to buying, profit taking from sellers to buying inputs.Do you enjoy the setups?Professional analyst with 5+ years experience in the capital marketsFocus on technical output not fundamentalsPosition and swing tradesProvide updates where necessary - with new updated ideas tracking the progress.If you like the idea, please leave a like or comment.To all the followers, thank you for your continued support.Thanks,LVPA MMXXII
LupaCapital
Shiba INU - We are in the zone of interest (be patient)

مرحبًا بالتجار والمحللین، ملاحظة قبل القراءة - هذا تحلیل توقعات - بناءً على استراتیجیة التداول الخاصة بنا. تم تصنیف هذا التحلیل على أنه محاید على المدى القصیر. طویل الأمد، صعودی، بسبب شراء المزید من الزیادات على الاختلالات. یرجى عدم اعتبار هذا کقیمة اسمیة وإجراء استراتیجیة الاستثمار ذات الصلة للتداول بنجاح على الاحتمالات. ملاحظة: لمشاهدة المزید من المعلومات - راجع الأفکار المرتبطة لمزید من العملات المشفرة ومن خلال روابط التحلیل التی توفر تفسیرات لمزید من الموارد. أیضًا للإضافة - فیما یتعلق بالطریقة المبسطة لنموذج حرق Shib، سیتوفر نموذج مفصل کامل - یرجى الاتصال بی لمزید من المعلومات. ** مفتاح رئیسی للمناطق * أزرق = شهری * أرجوانی = أسبوعی * أحمر = 4 أیام * أصفر = 16 ساعة * برتقالی = یومی * أخضر غامق = 8 ساعات * رمادی = 4 ساعات * وردی = ساعة واحدة راجع التحلیل الکامل أدناه؛ التصحیح الأسبوعی قریب جدًا؛ الاختلال الشهری حتى الآن لا یوجد وفرة من Data المقدمة من الوسطاء والمنصات - ستصبح الاختلالات الأخرى أکثر وضوحًا، ولکن مع تحلیل data - تم بیع السعر فورًا عند الإدراج. إنشاء مستوى منخفض فوری عند 0.0000569. التشکیل القابل للتحدید هو الکأس والمقبض والذی یمکن أن یکون أکثر وضوحًا على الرسم البیانی الأسبوعی والأربعة أیام. ومع ذلک، مع تقدیم المزید من ترسیخ الجذب من المسرحیات الأساسیة حیث تحدث قوائم جدیدة، یمکن للسعر تبنی توحید ثابت. لذا فإن الوافدین الجدد إلى السوق الذین بدأوا حرکة السعر الفوریة على أساس شهری یبدأون فی تغییر فوری للأیدی بإضافة المشترین إلى سوق البیع منذ البدایة. وقد أدى هذا الآن إلى إنشاء نطاق تداول على الأشهر الأربعة التالیة المدرجة حیث تکون 0.0000471 هی النقطة المنخفضة الثابتة التی تشکل الخلل الشهری بالإضافة إلى النطاق العلوی للخلل الذی یصل إلى 0.00000979. تحدیث الخلل الأسبوعی یتم تقدیم سبب خلل نصف الشمعة هنا لسببین؛ 1. کونه تکوین فیبوناتشی المنخفض بنسبة 50٪ من الذروة 1.00 عند تقدیم شیبا إینو إلى السوق. 2. السبب الثانی لعدم توازن الشمعة بنسبة 50% - یرجع إلى استخدام الربع العلوی بنسبة 50% لاحتمالیة السعر لإعادة اختبار جسم الشمعة لأهداف الشراء. لقد تغیر السعر من سوق بیع من خلال إنشاء ثلاثة قیعان أعلى متتالیة على الإطار الزمنی الأسبوعی، مما یوفر احتمالیة >50% لقوة الشراء والمواقف الطویلة التی سیتم اتخاذها. مرة أخرى باستخدام دعم أساسی مع مزید من التبنی من قبل المستخدمین والمزید من تطویر المشروع لیصبح رمزًا صالحًا للاستخدام، والتطویر من خلال استخدام Leash وBone. - العودة أدناه إلى ما هو Leash وBone. تحدیث الرسم البیانی الیومی التحلیل السابق؛ نقاط الحدیث الیومیة ray الیومی سلیم مع 3 مناطق لرفض الاتجاه تُظهر أن المشترین فی وضع اللعب. یُظهر الإغلاق الیومی للتصحیح أن 50% و0.000047X هی قیمة نفسیة قویة تعتمد على منطقة اختلال توازن یومیة وأسبوعیة. بالإضافة إلى ذلک - نتوقع نمط تصحیحی عمیق إلى 61.8٪ أو 70.5٪ حیث یتمتع السعر بثقة <90٪ فی اختبار السعر عند افتتاحه [أو بالأحرى عند تقدیمه إلى السوق]. لقد عرضت الارتفاعات المنخفضة التی تم إنشاؤها من الفتائل من خلال النظر إلى الیسار إغلاق الصفقات القصیرة وإعادة اختبارها مع عدم قدرة البائعین على توفیر أدنى مستویات منخفضة فی السوق. هذه علامة على أن الاتجاه ینعکس بالنسبة لمتداولی الدعم والمقاومة. یرجى العلم أنه أثناء تحلیل ETH و BTC و XRP، ADA - غالبًا ما اختبرت اختلالات الانعکاس 70.5٪، لذا توقع تراجعًا إلى المنطقة الأسبوعیة کما هو موضح أدناه. لمشاهدة المزید من الدراسات حول هذا - راجع تحلیلی الآخر. ما الذی قد یقدمه تصحیح التشکیل العلوی فی سیناریو محتمل للغایة؟ یتحدث الرسم البیانی عن نفسه فیما یتعلق بما حدث. هل تستمتع بالإعدادات؟ *محلل محترف یتمتع بخبرة تزید عن 5 سنوات *الترکیز على الناتج الفنی ولیس الأساسیات *التداول فی المراکز والتأرجحات *تقدیم التحدیثات عند الضرورة - مع أفکار جدیدة محدثة تتبع التقدم. إذا أعجبتک الفکرة، فیرجى ترک إعجاب أو تعلیق. إلى جمیع المتابعین، شکرًا لکم على دعمکم المستمر. شکرًا،LVPA MMXXI
LupaCapital
Shiba Inu - Daily ray rejection

مرحبًا بالتجار والمحللین، ملاحظة قبل القراءة - هذا تحلیل توقعات - بناءً على استراتیجیة التداول الخاصة بنا. تم تصنیف هذا التحلیل على أنه محاید على المدى القصیر. طویل الأمد، صعودی، بسبب شراء زیادات إضافیة عند حدوث اختلالات. یُرجى عدم اعتبار هذا کقیمة اسمیة وإجراء استراتیجیة الاستثمار ذات الصلة للتداول بنجاح على الاحتمالات. ملاحظة: للاطلاع على مزید من المعلومات - راجع الأفکار المرتبطة لمزید من العملات المشفرة ومن خلال روابط التحلیل التی توفر تفسیرات لمزید من الموارد. أیضًا للإضافة - فیما یتعلق بالطریقة المبسطة لنموذج حرق Shib، سیتوفر نموذج مفصل کامل - یرجى الاتصال بی لمزید من المعلومات.** مفتاح رئیسی للمناطق * أزرق = شهری * أرجوانی = أسبوعی * أحمر = 4 أیام * أصفر = 16 ساعة * برتقالی = یومی * أخضر غامق = 8 ساعات * رمادی = 4 ساعات * وردی = ساعة واحدة راجع التحلیل الکامل أدناه؛ اختلال التوازن الشهری حتى الآن لا یوجد وفرة من Data المقدمة من الوسطاء والمنصات - ستصبح اختلالات التوازن الأخرى أکثر وضوحًا، ومع ذلک مع تحلیل data - تم بیع السعر فورًا عند الإدراج. مما أدى إلى إنشاء مستوى منخفض فوری عند 0.0000569. التشکیل الذی یمکن التعرف علیه هو الکأس والمقبض والذی یمکن أن یکون أکثر وضوحًا على الرسم البیانی الأسبوعی والأربعة أیام. ومع ذلک، مع تقدیم المزید من ترسیخ الجذب من المسرحیات الأساسیة حیث تحدث قوائم جدیدة، یمکن للسعر تبنی توحید ثابت. لذا فإن الوافدین الجدد إلى السوق الذین بدأوا حرکة السعر الفوریة على أساس شهری یبدأون فی تغییر فوری للأیدی بإضافة المشترین إلى سوق البیع منذ البدایة. وقد أدى هذا الآن إلى إنشاء نطاق تداول على الأشهر الأربعة التالیة المدرجة حیث تکون 0.0000471 هی النقطة المنخفضة الثابتة التی تشکل الخلل الشهری بالإضافة إلى النطاق العلوی للخلل الذی یصل إلى 0.00000979. الخلل الأسبوعی یتم تقدیم سبب خلل نصف الشمعة هنا لسببین؛ 1. کونه تکوین فیبوناتشی المنخفض بنسبة 50٪ من الذروة 1.00 عند تقدیم شیبا إینو إلى السوق. 2. السبب الثانی لعدم توازن الشموع بنسبة 50% - یرجع إلى استخدام الربع العلوی بنسبة 50% لاحتمالیة إعادة اختبار السعر لجسم الشمعة لأهداف الشراء. لقد تغیر السعر من سوق بیع من خلال إنشاء ثلاثة مستویات منخفضة أعلى متتالیة على الإطار الزمنی الأسبوعی، مما یوفر احتمالیة >50% لقوة الشراء والمواقف الطویلة. مرة أخرى باستخدام دعم أساسی مع مزید من التبنی من قبل المستخدمین والمزید من تطویر المشروع لیصبح رمزًا صالحًا للاستخدام، التطویر من خلال استخدام Leash وBone. - العودة أدناه إلى ما هو Leash و Bone. تشکیل 8 ساعات؛ هناک ترکیبة حیث یکون خط القناة التصحیحیة السفلی الرمادی عبارة عن خط 4 ساعات، ولکن هذا کما هو موضح فی لقطة الشاشة یظهر رؤیة واضحة لمدة 8 ساعات تشمل أیضًا القناة التصحیحیة. قدمت القناة حرکة سعریة للتحرک نحو الحد العلوی للقناة والذی سیلعب الآن دورًا مهمًا فی الکسر وإعادة الاختبار أو الرفض للشراء حیث تشکل الخلل الآن عند احتمالیة عالیة بنسبة 50٪ لرفض منطقة المحور. نقاط الحدیث الیومیة ray الیومیة سلیمة مع 3 مناطق لرفض الاتجاه تُظهر أن الشراء فی وضعیة اللعب. یُظهر الإغلاق الیومی للتصحیح أن 50٪ و 0.000047X هی قیمة نفسیة قویة ترتکز على منطقة خلل یومیة وأسبوعیة. قدمت الارتفاعات المنخفضة التی تم إنشاؤها من الفتائل من خلال النظر إلى الیسار إغلاقًا قصیرًا وإعادة اختباره مع عدم قدرة البائعین على توفیر أدنى مستویات منخفضة فی السوق. هذه علامة على أن الاتجاه ینعکس بالنسبة لمتداولی الدعم والمقاومة. یرجى العلم أنه أثناء تحلیل ETH وBTC وXRP، ADA - غالبًا ما اختبرت اختلالات الانعکاس 70.5٪، لذا توقع تراجعًا إلى المنطقة الأسبوعیة کما هو موضح أدناه. لمشاهدة المزید من الدراسات حول هذا الأمر - راجع تحلیلاتی الأخرى. ما الذی قد یقدمه تصحیح التشکیل العلوی فی سیناریو محتمل للغایة؟ یتحدث الرسم البیانی عن نفسه فیما یتعلق بما حدث. هل تستمتع بالإعدادات؟ * محلل محترف لدیه خبرة تزید عن 5 سنوات * الترکیز على الناتج الفنی ولیس الأساسیات * الصفقات المتأرجحة والمرکزیة * تقدیم التحدیثات عند الضرورة - مع أفکار جدیدة محدثة تتبع التقدم. إذا أعجبتک الفکرة، فیرجى ترک إعجاب أو تعلیق. إلى جمیع المتابعین، شکرًا لکم على دعمکم المستمر. شکرًا، LVPA MMXXI
LupaCapital
Shiba Inu - A full technical analysis

Hello Traders and Analysts,A Note before reading - this is a forecast analysis - based upon our trading strategy. This is tagged Neutral for the short term. Long term, bullish, due to purchasing further increments upon imbalances.Please do not take this as face value and conduct the relevant investment strategy to successfully trade the probabilities. Excuse the delay on this, I began writing this on the 24th October. Note:To see more information - review the linked ideas for more crypto and through the analysis links which provide explanation's for further resources.Also to add - regarding the simplified method of the Shib Burning model, a full detailed model will be available - please contact me for further information.** Master Key for zones*Blue = Monthly*Purple = weekly*Red = 4 Days*Yellow = 16 Hours*Orange = Daily*Dark Green = 8 Hour*Grey = 4hour*Pink = 1 hourWhat is Shiba Inu Token?The First look at the Shiba Inu token came in August of 2020, when its developers took live with the creation to the market, along with an anonymous creator known as “Ryoshi” with an initial supply of one quadrillion tokens, of which was to send 50% of all the tokens on Uniswap and threw away the key (effectively render useless). The remaining 50% were then gifted away, or “burned”, to the Ethereum creator Vitalik Buterin.Risk WarningTrading leveraged products such as Forex, commodities and CFDs, carries with it a high level of risk and so may not be suitable for every investor. Prior to trading the foreign exchange, commodity or CFD market, consider your investment objectives, level of experience and risk appetite. You should never risk more than you can afford to lose. If you fail to understand or are uncertain of the risks involved, please seek independent advice and remember to conduct due diligence.Market dominanceUnderstanding the Market Capitalisation of the coins history.The privatised tracking will be found at the bottom - to view click the link.Attached to the chart is Shiba Inu Dominance tracking - where a positive correlation relating to added userbase, volume of transactions using the 26-27th trading activity for reference24-hour trading volume of $10,2B USD which adds overall long position sentiment.What must happen now to the supply of ERC-20 tokens?Well in order to reduce the supply will of course boost the price having a fixed circulation of tokens available will to those who hold will incur investors to gain.The supply Total is 1,000,000,000,000,000 or 1Quadrillion coins;where the following calcs have been removed;Burn Wallet = -410,253,870,302,595Uniswap = - 94,183,555,893India Covid Relied = -10,139,544,347,612Vitalik Buterin = -46,000,000,201,480 (0xab58)Review the etherscan here for the transactionshttps://etherscan.io/token/0x95ad61b0a150d79219dcf64e1e6cc01f0b64c4ce?a=0xab5801a7d398351b8be11c439e05c5b3259aec9bEst circulating supply retained497,730,966,630,395 or 497Trillion coinsWith Supply Burn Triggers - let's do the maths.so using every listing 25K shib and leash - burn implements.Use 1,000 listings for 25K = 25million burned [simplified] Using a burn rate of 3%, and based on 100m coins and an annual 30% YOY gain in price with a supply of 497T coins. Based on price at a current price 0.00005660The formula [simple] would look like so.=current price*(1+Annual increase YOY)+(Coin supply-new supply after burn)/New net total coin supplyOther variables to consider will be;** Refer to model noteImplied Crypto market cap, Implied ship market cap, implied Price & Burning factorsRefer to BTC chart below or to track the Crypto Dominance vs Total market cap - refer to the link belowhttps://www.tradingview.com/chart/TOTAL/HGxUUyI6-Crypto-Dominance-vs-Total-Market-Cap/Doge Vs Shiba Inu against relative market Dominances.Attached is the private tracking of the two coins and the represented inverse correlation between the two Coins. The negative correlation of the Dogecoin price as well as the dominance is taking effect with the rise of the inverse correlation coin Shiba, whereby the addition of trade volume and ecosystems on which the crypto's are built on are now beginning to take effect. With Doge having a peak of 4% of the market and a market cap of $89.5-7BN, the coins price is now on a market decline as it is now established, but has not yet reached the desired imbalance nor %Dominance which comes with it. A possible coin fluctuation price can be highly probable between the purple imbalance [1][1] Doge Imbalance upon the monthly and weekly combined8 Hour chartWhat is the 8 hour chart showing?Well firstly, a great formation of a correctional symmetrical triangle using the 8hour session candles. This chart pattern has formed through the formation of either a declining lower highs and or an increasing lower lows. Two lines are drawn upon the line squeezes which moves towards an Apex. Depending on inclining higher lows and higher highs within the structure squeeze, then the pattern will produce a bullish continuation upon the Apex breakout.Chart pattern - Symmetrical triangle Bearish example using Shiba INUMonthly ImbalanceThus far there is not an abundance of Data provided from brokers and platforms - further imbalances will become clearer, however with data analysed - price had immediately sold off upon listing. Creating an immediate low of 0.0000569. The identifiable formation is a cup and handle which can be more visible on the weekly and four day chart. However with an introduction of further establishment of the traction from fundamental plays where new listings occur price can adopt an established consolidation. So new entrants to the market who began immediate price action on the monthly basis begin an immediate change of hands adding buyers to a selling market from the inception. This has now created a trading rang on the following four months listed whereby 0.0000471 is the established low point forming the monthly imbalance as well as the upper range of the imbalance reaching 0.00000979.The weekly ImbalanceThe reason here for the half candle imbalance is provided for two reasons;1. Being the Formation of the 50% low Fibonacci from the peak 1.00 at the introduction of Shiba Inu to the market.2. The second reason for the 50% candle imbalance - is due to the upper 50% quartile using probability for price to retest the body of the candle for buying targets.Price did change hands from a selling market by creating three consecutive higher lows on the weekly timeframe, offering a >50% probability for buying power and long positions to be taken. Again using a fundamental backing with further adoption of users and further development of the project to become a useable token, the development through to the usage of Leash and Bone. - revert below to what is Leash & Bone.Four Day chartWhy here?The pull back on the four day chart had resulted in the building block which had perfectly placed itself upon the Fibonacci pivot zones upon the 38.2-50% - this formed the block to gain pivotal long additions as a double tweezer bottom occurred as well as a bearish candle which pulled back, this creates to most shorter time frame traders being daily time frame and below, a correctional move to instate a block which closes on the half body of the introductory candle from the top wick. This failed to break the weekly imbalance and has shown a high probability for added long positions. Market Capitalisation of ShibaINU:Refer to Coinmarket cap for further information regarding supplies, analytics and the ever changing landscape of the Volume, market cap of the top Crypto's.https://coinmarketcap.com/Four Hour chartThe four hour has shown two areas of key interest for adding longs, one key market structure offers the consolidation where price broke out of the triangle apex and engulfed, but came to a high, of which needed a move to look for a Fibonacci pivot based on the structure newly formed which showed a pivot point between 50-61.8% but provided tweezer bottom which is perfect rejection candles to see when analysing the candlesticks.The rejection upon the 50% again has provided the extension pattern to complete at a 1.618 Extension and further, but ofcourse first the hurdle is to retest the Supply imbalance based upon the Fibonacci "0"* and the introduction of the all time high. (See below)A smaller scale imbalance which has just been used at the time of writing has shown the netting of, the selling pressure has netted of the wick - therefore closing out at a [net zero] showing the zone is valid as an equal low has incurred and buying change of hands has occurred again upon counter-traders and profit takers.*FiboShiba Inu Ecosystem:What is Leash and Bone?LEASH tokens are staked or buried, the one staking the coins receives a reward in the form of x LEASH tokens, effectively the holders of x Leash holders are part of the liquidity pool, where a new block is created holders receive a proportional value to share of the pool. The digger of the of token receives a share of Leash ETH SSLP [Super simple ledger protocol]*Boneburying BONE tokens, the user receives tBONE. This entitles the holder the right to be part of a pool that provides the members 1% of all the BONE per block. And digging, in this case, is similar to the function for the LEASH tokens. The person digging or providing liquidity receives a share of the Bon -ETH SSLP*What is Shibaswap?This is a decentralized exchange created for the Shiba Inu community. The community gathers around three main coins: SHIB (the foundational currency of the Shiba Inu, II - LEASH (incentivised on ShibaSwap), and BONE (ShibaSwap’s governance token). The exchange/Swap allows buyers, sellers of the ERC-20 token to be supported by the Shibaswap exchange.BuryStaking (also known as BURY): staking pools for the ecosystem’s tokens (SHIB, BONE, LEASH). It allows you to earn token rewards while staking the tokens. Each pool has different time-locking intervals as well as APYs. Rewards are in the 3 figures percentages and are paid in BONE.Further fundamental news which assist the price increasesNFT token - 10,000 digitalized “lovable creatures” sold out in minutes, Shiba Inu NFTs were available only on the protocol’s DEX – ShibaSwap, buying and trading will be “completely free (except for the gas fee)." - which uses ETH from 0.1ETH +Shiba INU token burns - through transactions Bigger Entertainment - 20Shib tokens burned per song while listening to a playlist of 397 songs.Robinhood listing* - creating further opportunities to further userbase now having access to the crypto to trade.Do you enjoy the setups?*Professional analyst with 5+ years experience*Focus on technical output not fundamentals*Position and swing trades*Provide updates where necessary - with new updated ideas tracking the progress.If you like the idea, please leave a like or comment.To all the followers, thank you for your continued support.Thanks,LVPA MMXXIFurther increments of buys to be added upon the weekly zone if a correctional move occurs.4hour squeeze - looking to build up a consolidation zone above the previous introductory high.
LupaCapital
Cardano long position vs market dominance

Hello Traders and Analysts,Breakdown:1. Note2. Contents3. Research breakdown4. Education recap5. Information on Lupa.A Note before reading - this is a forecast analysis - based upon our trading strategy. This is tagged Long, due to purchasing further increments upon imbalances.Please do not take this as face value and conduct the relevant investment strategy to successfully trade the probabilities.Master Key for zonesRed = Three MonthBlue = MonthlyPurple = weeklyScarlet [Red] - Four dayOrange = DailyGreen = 8 Hour, 16hourGrey = 4hourPink = 1 hourSee dominance chart belowUnderstanding the Market Capitalisation of the coins history.The privatised tracking will be found at the bottom - to view click the link.Here is the Bitcoin market imbalances cap - monthly chartWeekly Bitcoin Market CapNotice the equal lows which have formed the famous double bottom formation. The weekly trendline whilst steep has now seen a sell off, but now can establish a take back being the dominant coin.Daily Market Cap with BTC priceNotice the daily imbalance on the market cap and the price chart equate to the same position opportunity.BTC - candle sticksETH - purpleBNB - Rose pinkXRP - OrangeADA - GreenTracking the major coins as of 6th October 2021BTC - 44.69% ETH - 18.51%BNB - 3.19%ADA - 3.11%USDT - 2.95* XRP - 2.22%* based on a fictional USD stable coin derived from Fiat.Source: https://coinmarketcap.com/Cardano Write upMonthly structureThe market is presenting an interesting scenario;Whereby price has tested the 0.236% Fibonacci - and rejected. However, price can still revert to this level. I.// Where price retests, and rejects further - look to a buy probability with the imbalance closing out with the equal wick to the previous month, assessing the low reactive point.II.// If price indicates a reactive level break, add a net sell position to hedge long positions creating an absolute return positive.WeeklyWeekly Impulse, correction, Impulse waves?Notice, that price has reverted back upon the first Fibonacci sequence wave from the established "0" to 0.705 upon the structure.Using the price wave theory as a basic concept - price has made the consolidation one since the initial tail off from the peak back in 2018. Price has provided a gearing process where the imbalance can be closed out in creating the next sequence high using imbalances, and Fibonacci targets for extension targets.The reversion pivot points are 61-70.5% creating the imbalance confirmation - where price will look to as a position of interest to change hands of sellers to buyers if required.Weekly Market capitalisation of CardanoThe trendline is being respected, however also take into account the pathway in which the % of dominance for ADA shows an opportunity for longs as the overall picture is an uptrend swing based off previous % dominance. Refer to the chart below.Taking the theory and applying said wave; shows the possible predictive pathway - reason being, price has a volume increase, propelling a multitude of in-flow into the market capitalisation.looking to Marketcap: - we have seen that Cardano currently amounts to 77.3B in market cap, with a market share of 3.6% as of September 15th 2021. Updated to October, whereby the marketcap is now 2.86%, meaning that there is now a proportional move to the growth of the market capitalisation in general - meaning if, BTC dominance ideally flows back towards previous dominant percentages, [refer to idea below]. The target percentage of 60% for example will grow the price of BTC and the entire market cap, the relationship of inflows to ADA, ETH and other cois will all provide valuable growth too, as will a correlative price with it. Hence the bullish sentiment. and the model assumptions taken from the base case and conservative targets, overall - the buyers are ever present, looking at the current supply of 71% of tokens circulating, this enables us to understand where price will move in the future as the supply ever reaches full circulation.** If you are interested in the model of the market cap - please send a message via Tradingview.The Daily correction, has provided a solid basis for additional opportunities.The pathwayWhilst BTC and ETH have market dominance, note the importance of the price fluctuations upon these cryptocurrencies, whereby large imbalance moves positive and negative will have a correlative but not a causative response.The idea of having the imbalance at the previous is historical, based upon market structure and explained above.Using the market CapitalisationSee the weekly chart below in reference to the following;BTC - WhiteETH - PurpleADA - Light BlueThe correlation upon the three largest crypto's all have a relativity and looking over the charts all have similar imbalances [as expected], Bitcoin being the most dominant, offers the shift in change first, followed by a lag time for ETH and ADA as the chart shows.Though the products follow different develops within their own space, please note - from a technical aspect the chart still shows a strong factor for clear opportunities to buy, sell based upon price reactive levels - which correlate to the market Cap.If you like the idea, please leave a like or comment.To all the followers, thank you for your continued support.Thanks,LVPA MMXXI
LupaCapital
BTC vs Bitcoin Dominance

مرحبًا بالتجار والمحللین، ملاحظة قبل القراءة - هذا تحلیل توقعات - بناءً على استراتیجیة التداول الخاصة بنا. تم تصنیف هذا على أنه محاید على المدى القصیر. على المدى الطویل، صعودی، بسبب زیادة الشراء عند حدوث اختلالات. یرجى عدم اعتبار هذا على أنه قیمة اسمیة وإجراء استراتیجیة الاستثمار ذات الصلة للتداول بنجاح على الاحتمالات. ملاحظة: کنت مخطئًا فی التخطیط لاختلال التوازن لإعادتنا إلى 20 ألفًا أو أقل، والسبب فی ذلک هو عودة الاختلالات إلى الاختلال الأصلی. مع Crpyto، یبدو أن النسبة الذهبیة واحتمالیة عالیة لمنطقة تصحیح عمیقة بنسبة 0.786٪. المفتاح الرئیسی للمناطق *الأزرق = شهری *الأرجوانی = أسبوعی *الأحمر = 4 أیام *الأصفر = 16 ساعة *البرتقالی = یومی *الأخضر الداکن = 8 ساعات *الرمادی = 4 ساعات *الوردی = ساعة واحدة یرجى الاطلاع على فکرة الرسم البیانی السابقة لفهم اتجاه السعرملاحظة مثیرة للاهتمام: بناءً على مفهوم النمذجة باستخدام حالة أساسیة حیث یصل سوق العملات المشفرة إلى حجم سوق الذهب ویظل Bitcoin عند حوالی 50٪ هیمنة السوق و / أو یصل إلى 60٪ + حیث احتفظ السوق سابقًا بهیمنة٪. یمکن أن یصل سعر BTC إلى ارتفاعات وفقًا لعامل الضرب فی النموذج. ملاحظة: باستخدام وقت النموذج، یبلغ سوق الذهب 11.03 تریلیون. القیمة السوقیة الضمنیة البالغة 6،781.80 تریلیون عند 60٪ تعطی سعرًا ضمنیًا لکل BTC عند 360،734.04 دولارًا لکل BTC. ستوفر هیمنة السوق بنسبة 50% سعرًا ضمنیًا لکل BTC عند 300،611.70 دولارًا لکل BTC. لمعرفة المزید عن النموذج، یرجى مراسلتی فی التعلیقات أو بشکل خاص لمزید من المعلومات. الاختلالات الشهریة فیما یلی أحدث الاختلالات فی عملة البیتکوین، حیث قدمت نقطة الاهتمام إغلاق شمعة أسبوعی من أعلى مستوى عند 64،823.XX دولارًا إلى 51،997.XX دولارًا. هذا اختلال کبیر حیث عرض السعر تغییرًا کبیرًا للأیدی إلى عدم کفاءة سعریة حرجة. البائعون الآن هم المسیطرون وخلقوا مستوى منخفضًا مع انخفاض کبیر حیث یُظهر الأسبوعی البیع السریع. یرجع هذا إلى اختلال التوازن فی الشراء الذی یتغیر الآن لتوفیر الکفاءة بناءً على نقطة المحور. الرسم البیانی الشهری منطقة البیع الأسبوعیة من 64 ألف أعلى مستوى على الإطلاق (حالیًا). أعادنا فیبوناتشی إلى المنطقة الأسبوعیة [التی تتوافق مع شهریًا] - راجع الرسم البیانی الأسبوعی [1] [1] - الرسم البیانی الأسبوعی یغلق فیبوناتشی بنجاح عند -0.618٪. فهم القیمة السوقیة لتاریخ العملات المعدنیة. سیتم العثور على التتبع المخصخص فی الأسفل - لعرض انقر فوق link. إلیک Bitcoin اختلالات السوق الحد الأقصى - الرسم البیانی الشهری القیمة السوقیة الأسبوعیة Bitcoin لاحظ الانخفاضات المتساویة التی شکلت تشکیل القاع المزدوج الشهیر. خط الاتجاه الأسبوعی على الرغم من انحداره، فقد شهد الآن عملیات بیع، ولکن الآن یمکنه إثبات استعادة کونه العملة المهیمنة. القیمة السوقیة الیومیة بسعر BTC لاحظ الخلل الیومی فی القیمة السوقیة ومخطط الأسعار یعادل نفس فرصة الموقف. BTC - شموع ETH - أرجوانی BNB - وردی وردی XRP - برتقالی ADA - أخضر تتبع العملات الرئیسیة اعتبارًا من 6 أکتوبر 2021 BTC - 44.69٪ ETH - 18.51٪ BNB - 3.19٪ ADA - 3.11٪ USDT - 2.95 * XRP - 2.22٪ * بناءً على عملة مستقرة وهمیة بالدولار الأمریکی مستمدة من فیات. المصدر: https://coinmarketcap.com/ هذا هو الیومی، منذ التحلیل السابق - یرجى التأکد من القراءة لفهم سبب اتخاذ هذا. هل تستمتع بالإعدادات؟ * محلل محترف لدیه خبرة تزید عن 5 سنوات فی أسواق رأس المال * الترکیز على الناتج الفنی ولیس *الأساسیات*الصفقات المتأرجحة*تقدیم التحدیثات عند الضرورة - مع أفکار جدیدة محدثة تتبع التقدم.إذا أعجبتک الفکرة، یرجى ترک إعجاب أو تعلیق.إلى جمیع المتابعین، شکرًا لکم على دعمکم المستمر.شکرًا،LVPA MMXXI
إخلاء المسؤولية
أي محتوى ومواد مدرجة في موقع Sahmeto وقنوات الاتصال الرسمية هي عبارة عن تجميع للآراء والتحليلات الشخصية وغير ملزمة. لا تشكل أي توصية للشراء أو البيع أو الدخول أو الخروج من سوق الأوراق المالية وسوق العملات المشفرة. كما أن جميع الأخبار والتحليلات المدرجة في الموقع والقنوات هي مجرد معلومات منشورة من مصادر رسمية وغير رسمية محلية وأجنبية، ومن الواضح أن مستخدمي المحتوى المذكور مسؤولون عن متابعة وضمان أصالة ودقة المواد. لذلك، مع إخلاء المسؤولية، يُعلن أن المسؤولية عن أي اتخاذ قرار وإجراء وأي ربح وخسارة محتملة في سوق رأس المال وسوق العملات المشفرة تقع على عاتق المتداول.