
CRYPTOMOJO_TA
@t_CRYPTOMOJO_TA

ما هو الشيء الذي ننصحك بشراءه من المواد الغذائية؟
سابق في الشراء
پیام های تریدر
مرشح
CRYPTOMOJO_TA
CRV شکست خط روند نزولی: آیا زمان پرواز فرا رسیده است؟

CRV فقط کسر الاتجاه الهبوطی. هذه هی الطریقة التی تبدأ بها التحرکات الکبیرة عادة. 👀 إذا استمر الاختراق، فإننا نطیر. 🚀
CRYPTOMOJO_TA
شکست خط روند FET: آیا قیمت به ۰.۴۰ دلار میرسد؟

FET وأخیرا کسر خط الاتجاه. 🚀 لقد قلبنا مستوى الدعم، وتحول المتوسط المتحرک الأسی إلى الأعلى، وعاد المشترون إلى الداخل. وطالما ظل السعر فوق هذا الاختراق، فإن الاتجاه الصعودی نحو 0.35 دولارًا - 0.40 دولارًا مطروحًا على الطاولة. الزخم یتزاید. 👀
CRYPTOMOJO_TA
دوج کوین ترکید! آیا این روند صعودی جدید است؟ (هدف بعدی ۰.۱۵ دلار)

#DOGE اندلعت للتو. 🚀 انتهى الاتجاه الهبوطی أخیرًا وبدأ الزخم فی الاتجاه الصعودی. وطالما ظل السعر فوق الاختراق، فإن 0.15 دولار هو الهدف التالی. تبدو قویة. 👀
CRYPTOMOJO_TA
نقطه عطف حیاتی SUI: آیا اوج میگیرد یا سقوط میکند؟
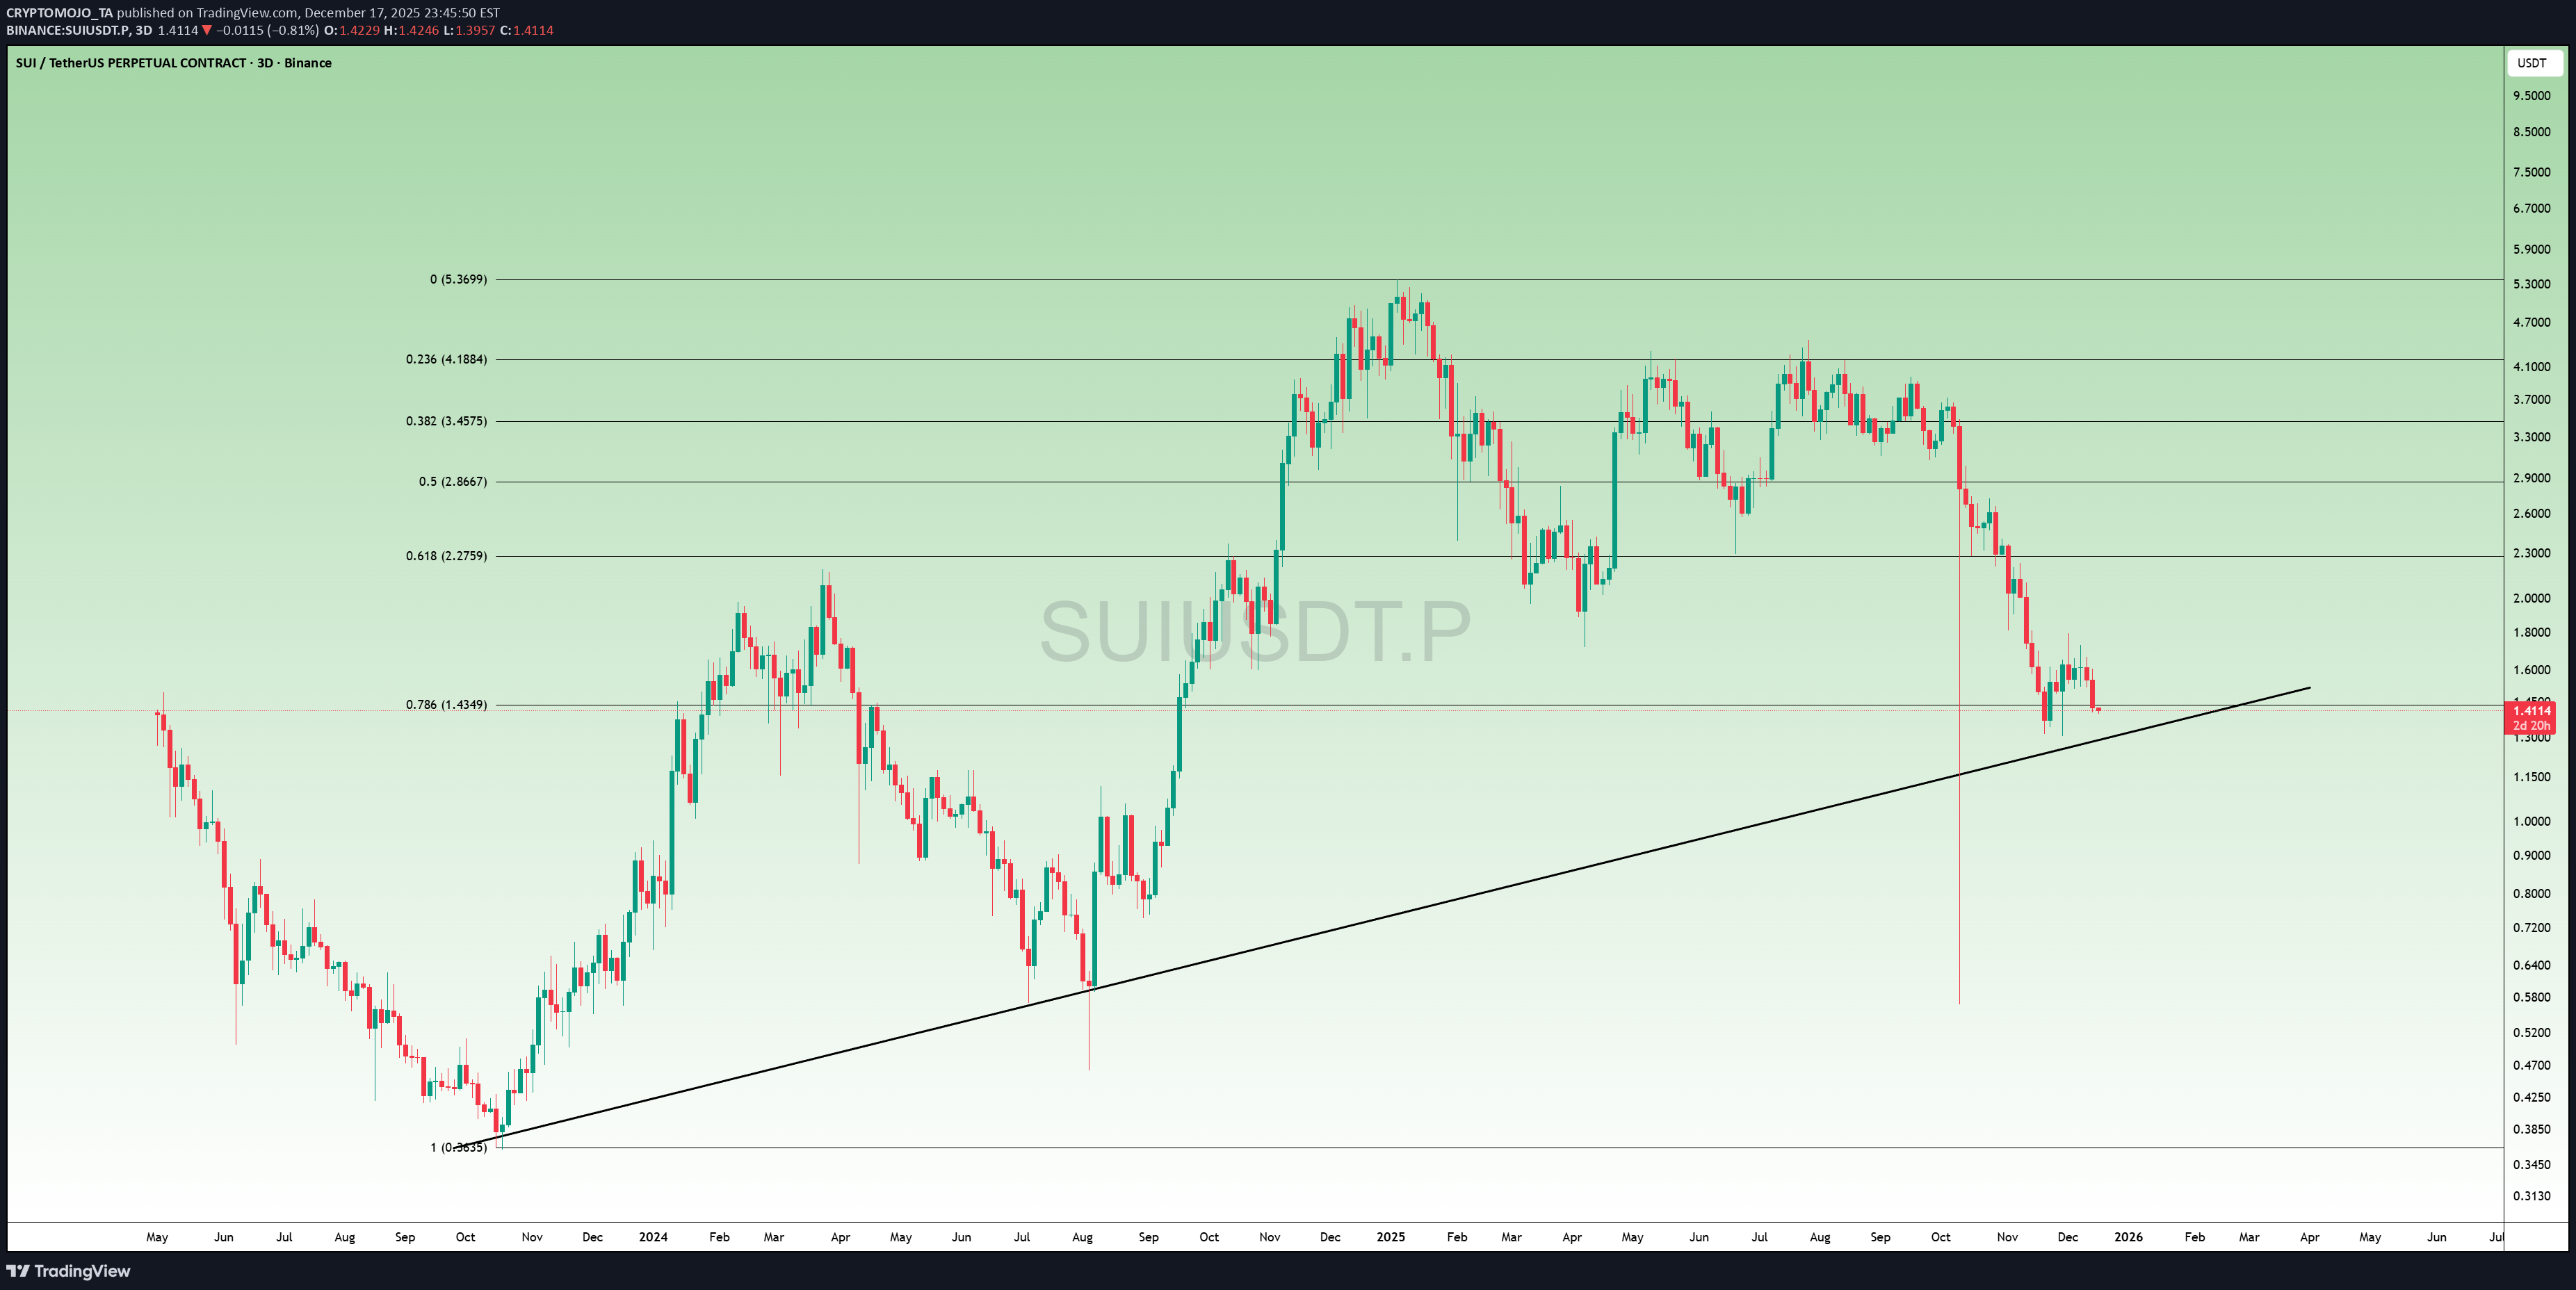
یقع #SUI الآن على خط اتجاه طویل المدى major وهو المستوى الذی ظل ثابتًا منذ إطلاقه. 👀 فی کل مرة یلامس فیها السعر خط الاتجاه هذا، یبدأ SUI فی الارتفاع بقوة move. لقد عدنا إلى هنا مرة أخرى... مباشرة عند الدعم + بالقرب من منطقة فیبوناتشی 0.786. إذا تدخل المشترون، فإن الارتداد نحو 2.2 دولار → 2.8 دولار هو الهدف الرئیسی التالی. إذا اخترق هذا المستوى، عندها فقط سنبدو أقل. لحظة عظیمة لـ SUI. البقاء فی حالة تأهب. #التشفیر
CRYPTOMOJO_TA
CRYPTOMOJO_TA
QNT's Big Move Is Coming!
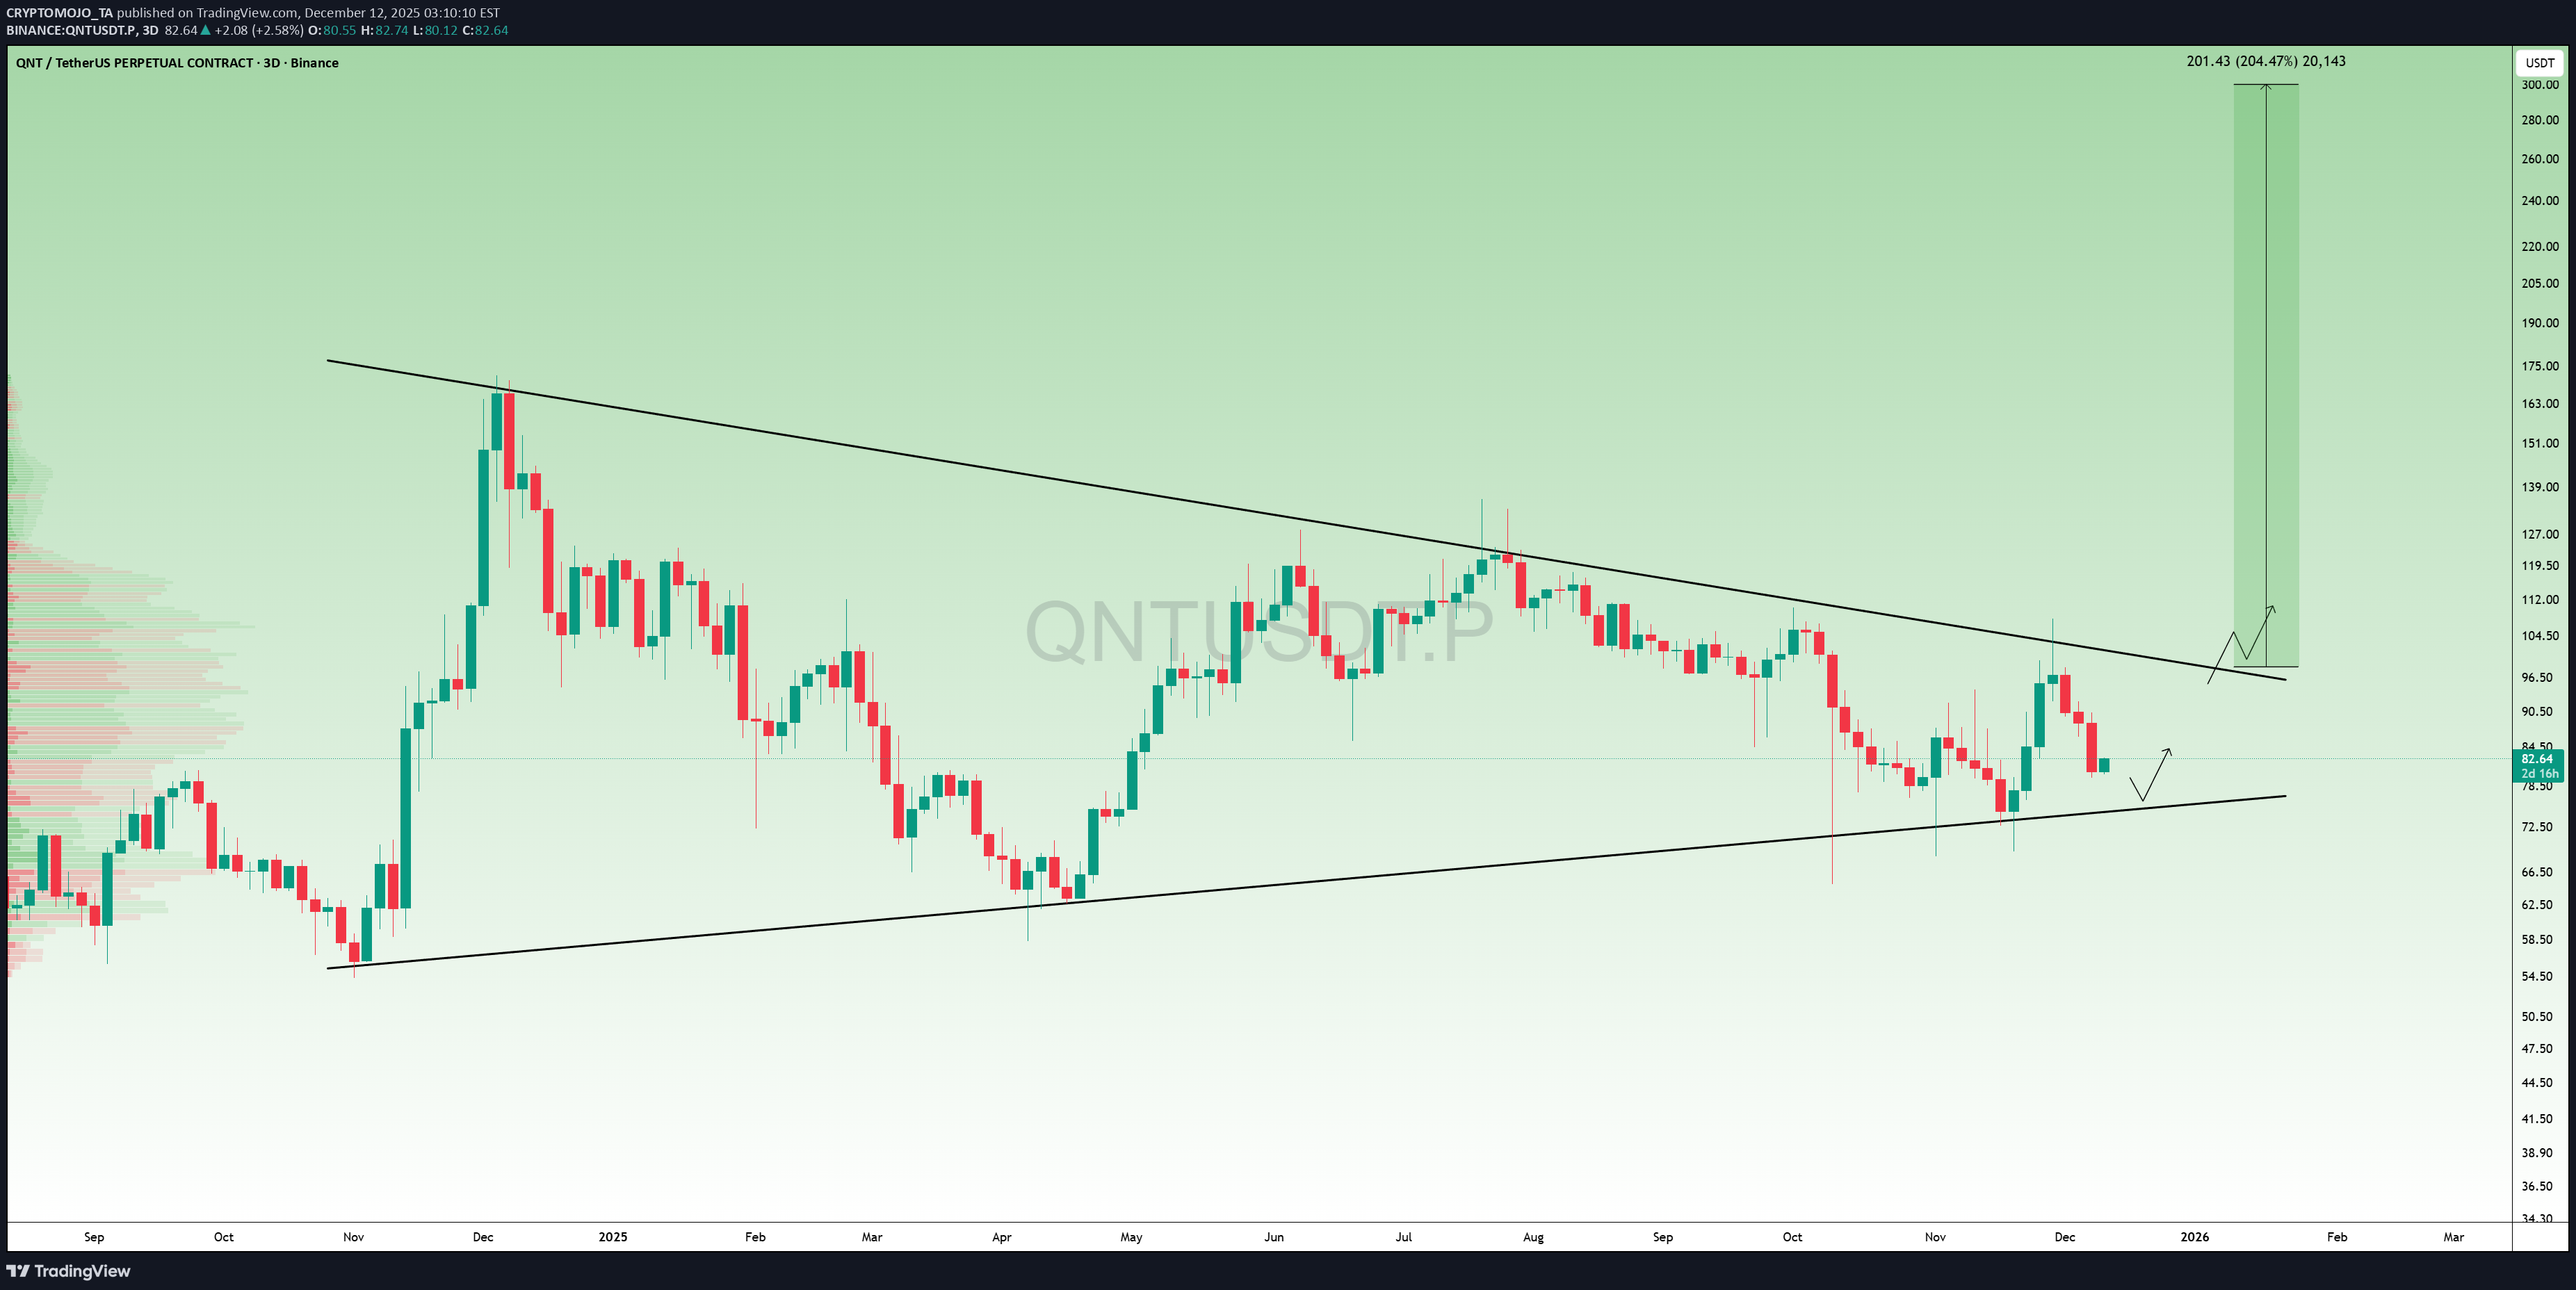
QNT یشکل بهدوء أحد أنظف الأنماط الکلیة فی السوق. ظل السعر یضغط داخل هذا الإسفین الهابط الضخم لأکثر من عام ... وفی کل مرة یلامس QNT خط الاتجاه السفلی، یرتد hard. الآن نحن نقترب من منطقة الاختراق. ویشیر الاختراق من هنا إلى مستوى 200% move باتجاه نطاق 250-300 دولار. لیست نصیحة مالیة فقط احترام الرسم البیانی. هذا قد یفاجئ الکثیر من الناس.
CRYPTOMOJO_TA
LINK at Critical Bounce Point, Historically Where Rallies Begin
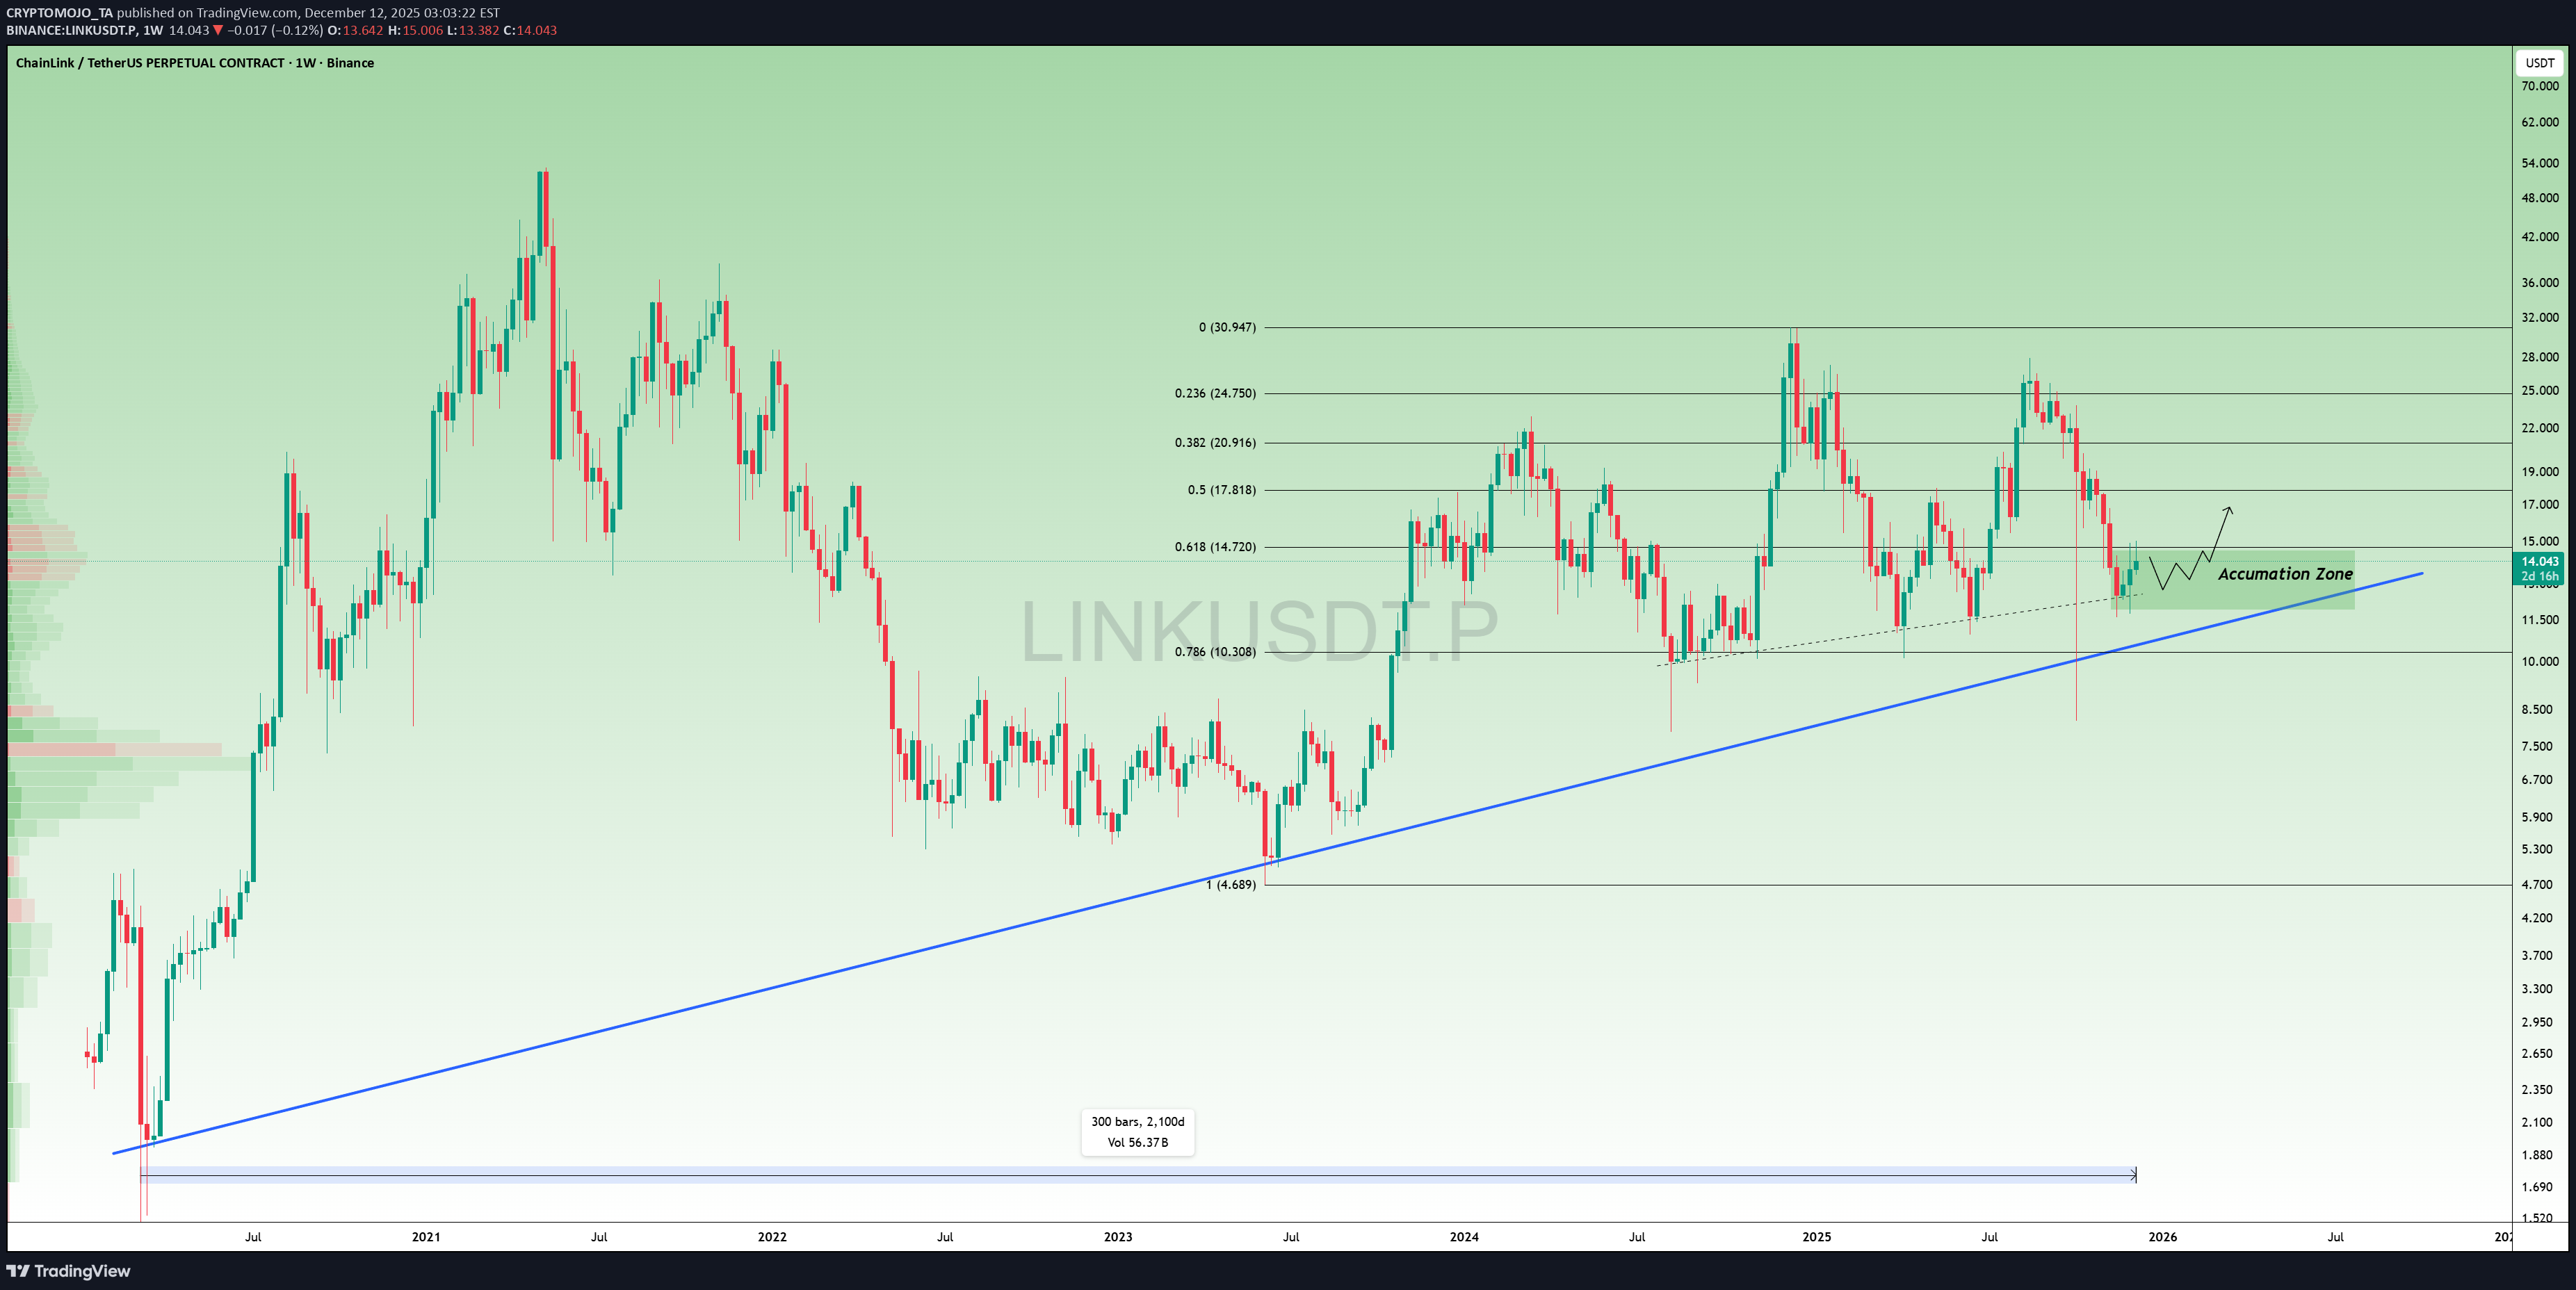
LINK عاد السعر إلى إحدى أقوى مناطق التراکم على الرسم البیانی. صمد خط الاتجاه هذا لمدة 5 سنوات تقریبًا، وکل لمسة أدت إلى ارتفاع بمقدار major move. یقع السعر الآن مباشرة عند الدعم ومستویات فیبوناتشی 0.618/0.786 هی المنطقة التی عادة ما یتم تحمیل الأموال الذکیة فیها. إذا ظل LINK هنا، فإن التراجع نحو 17 دولارًا - 21 دولارًا سیکون مطروحًا على الطاولة. هذه هی المنطقة التی تبدأ فیها التحرکات الکبیرة غالبًا.
CRYPTOMOJO_TA
CRYPTOMOJO_TA
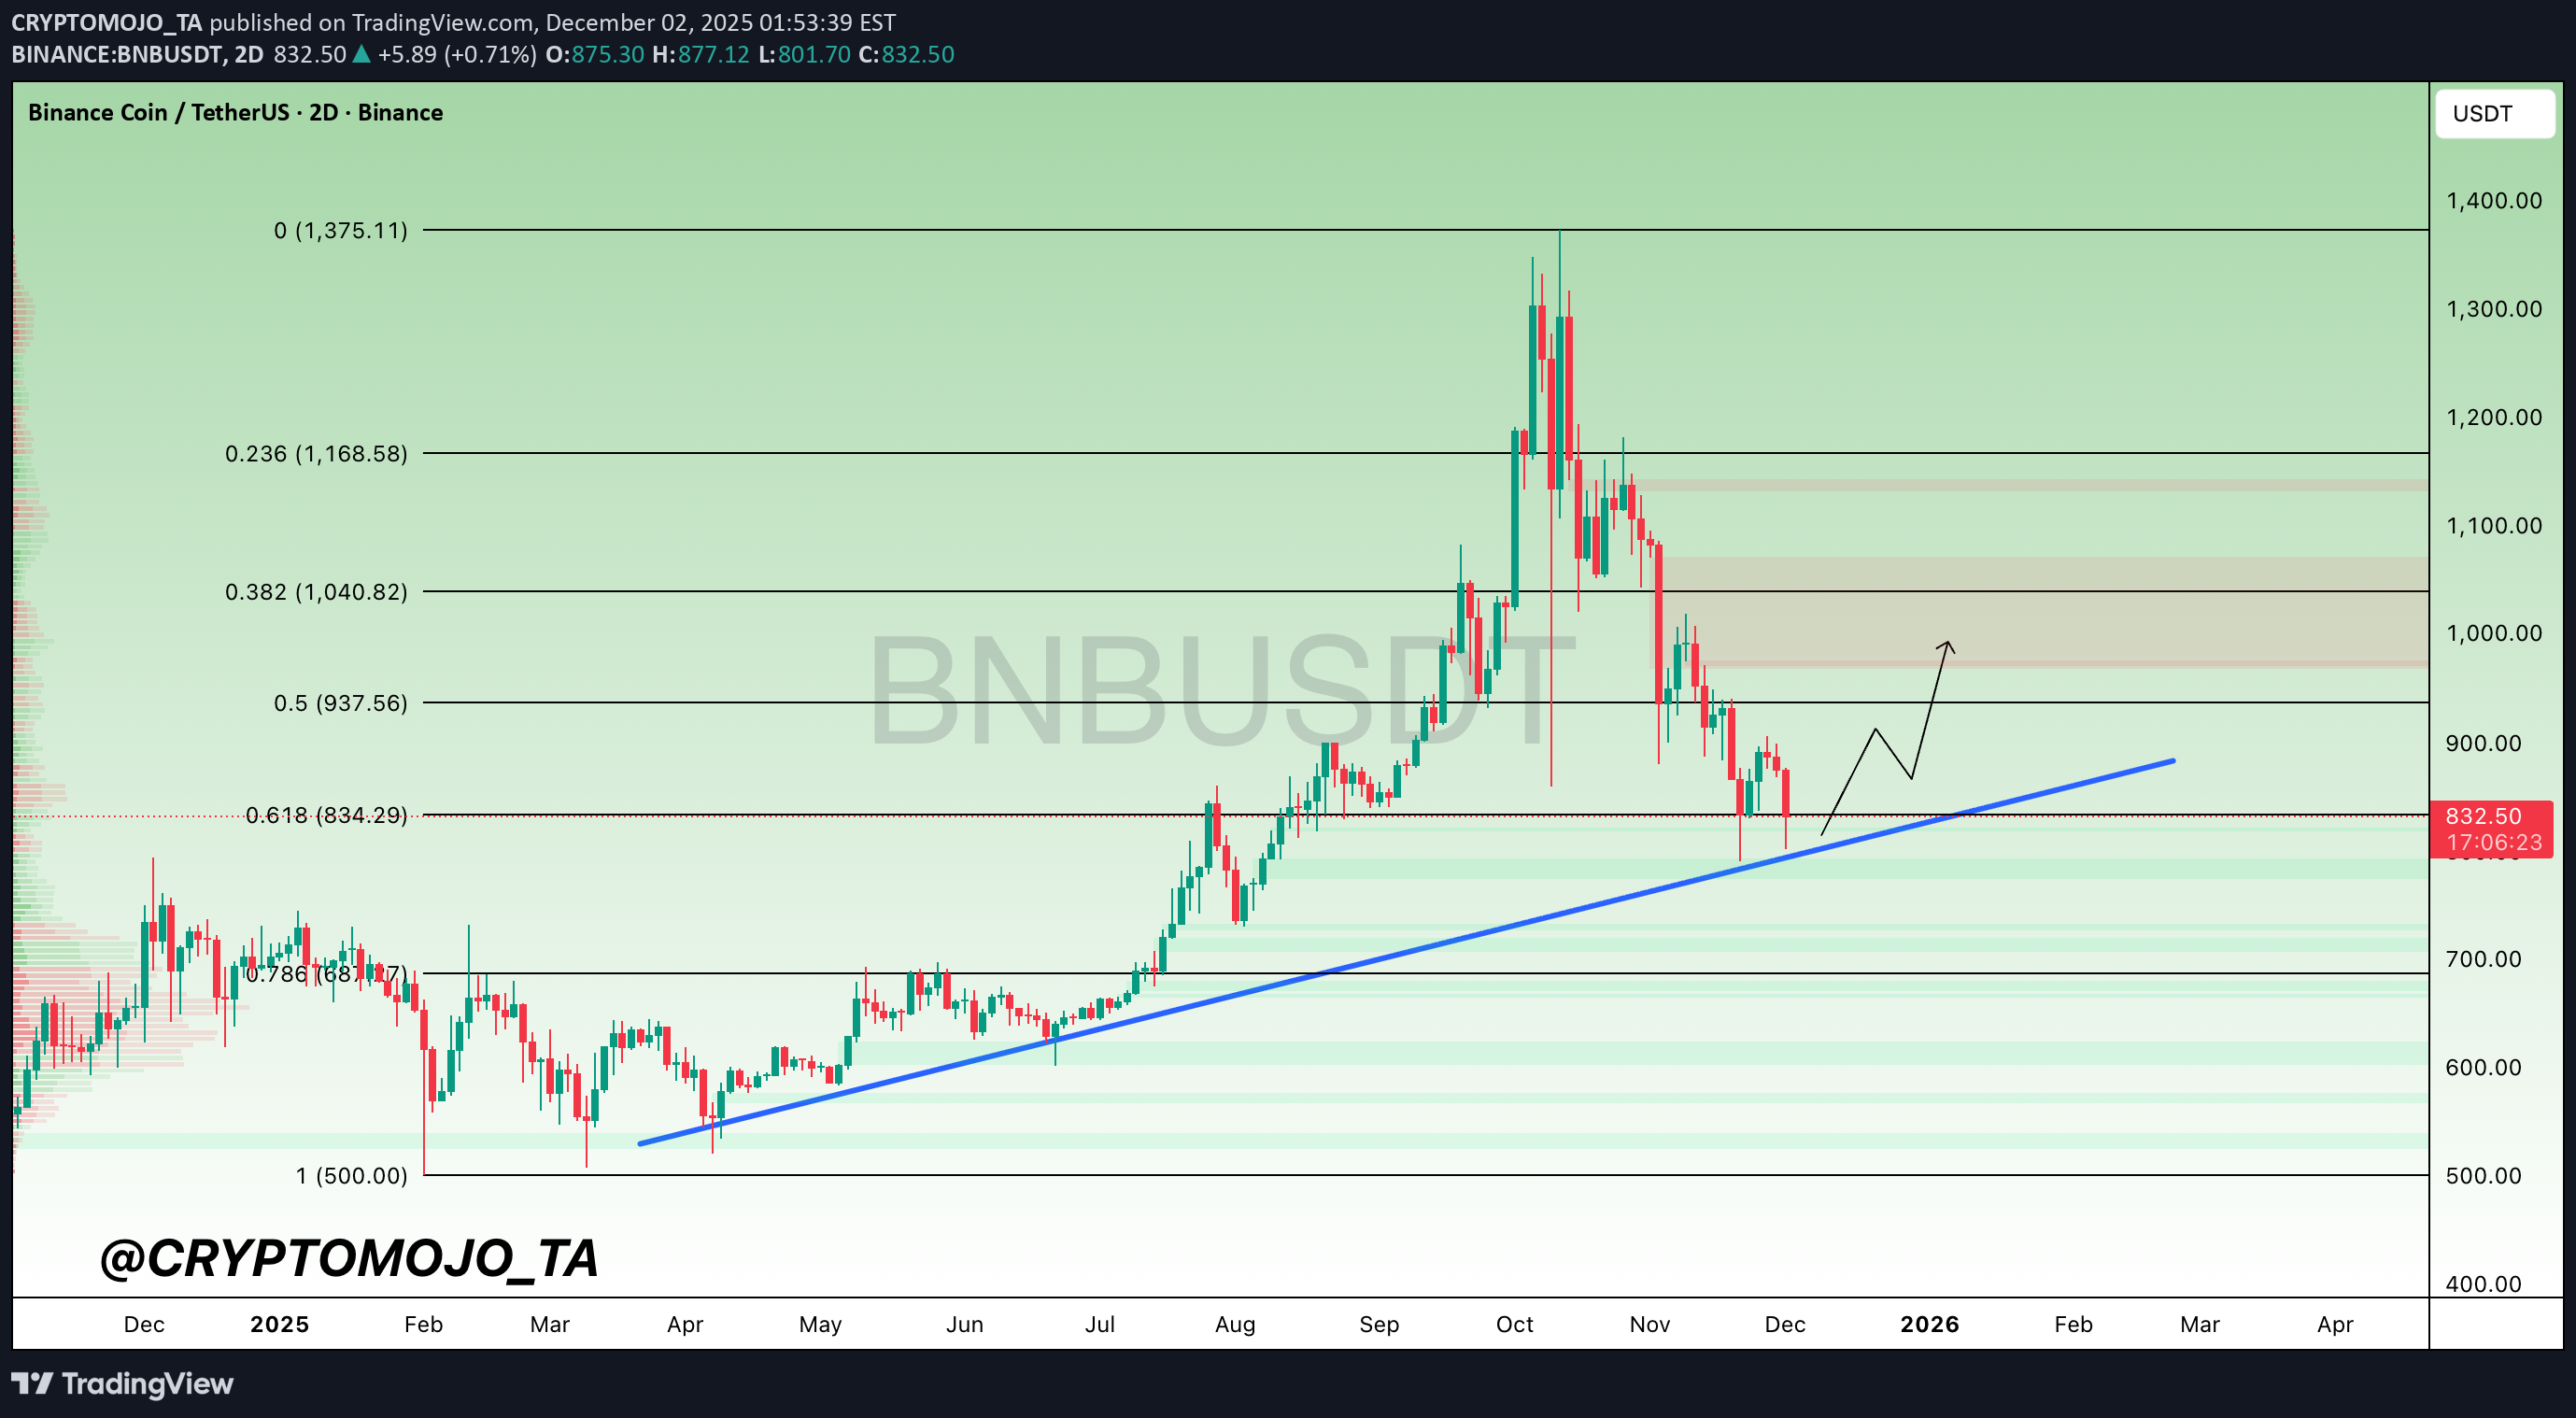
خط قرمز سرنوشتساز بیتکوین (BNB): آیا حمایت تاریخی میشکند یا به قله جدید میرسد؟
CRYPTOMOJO_TA
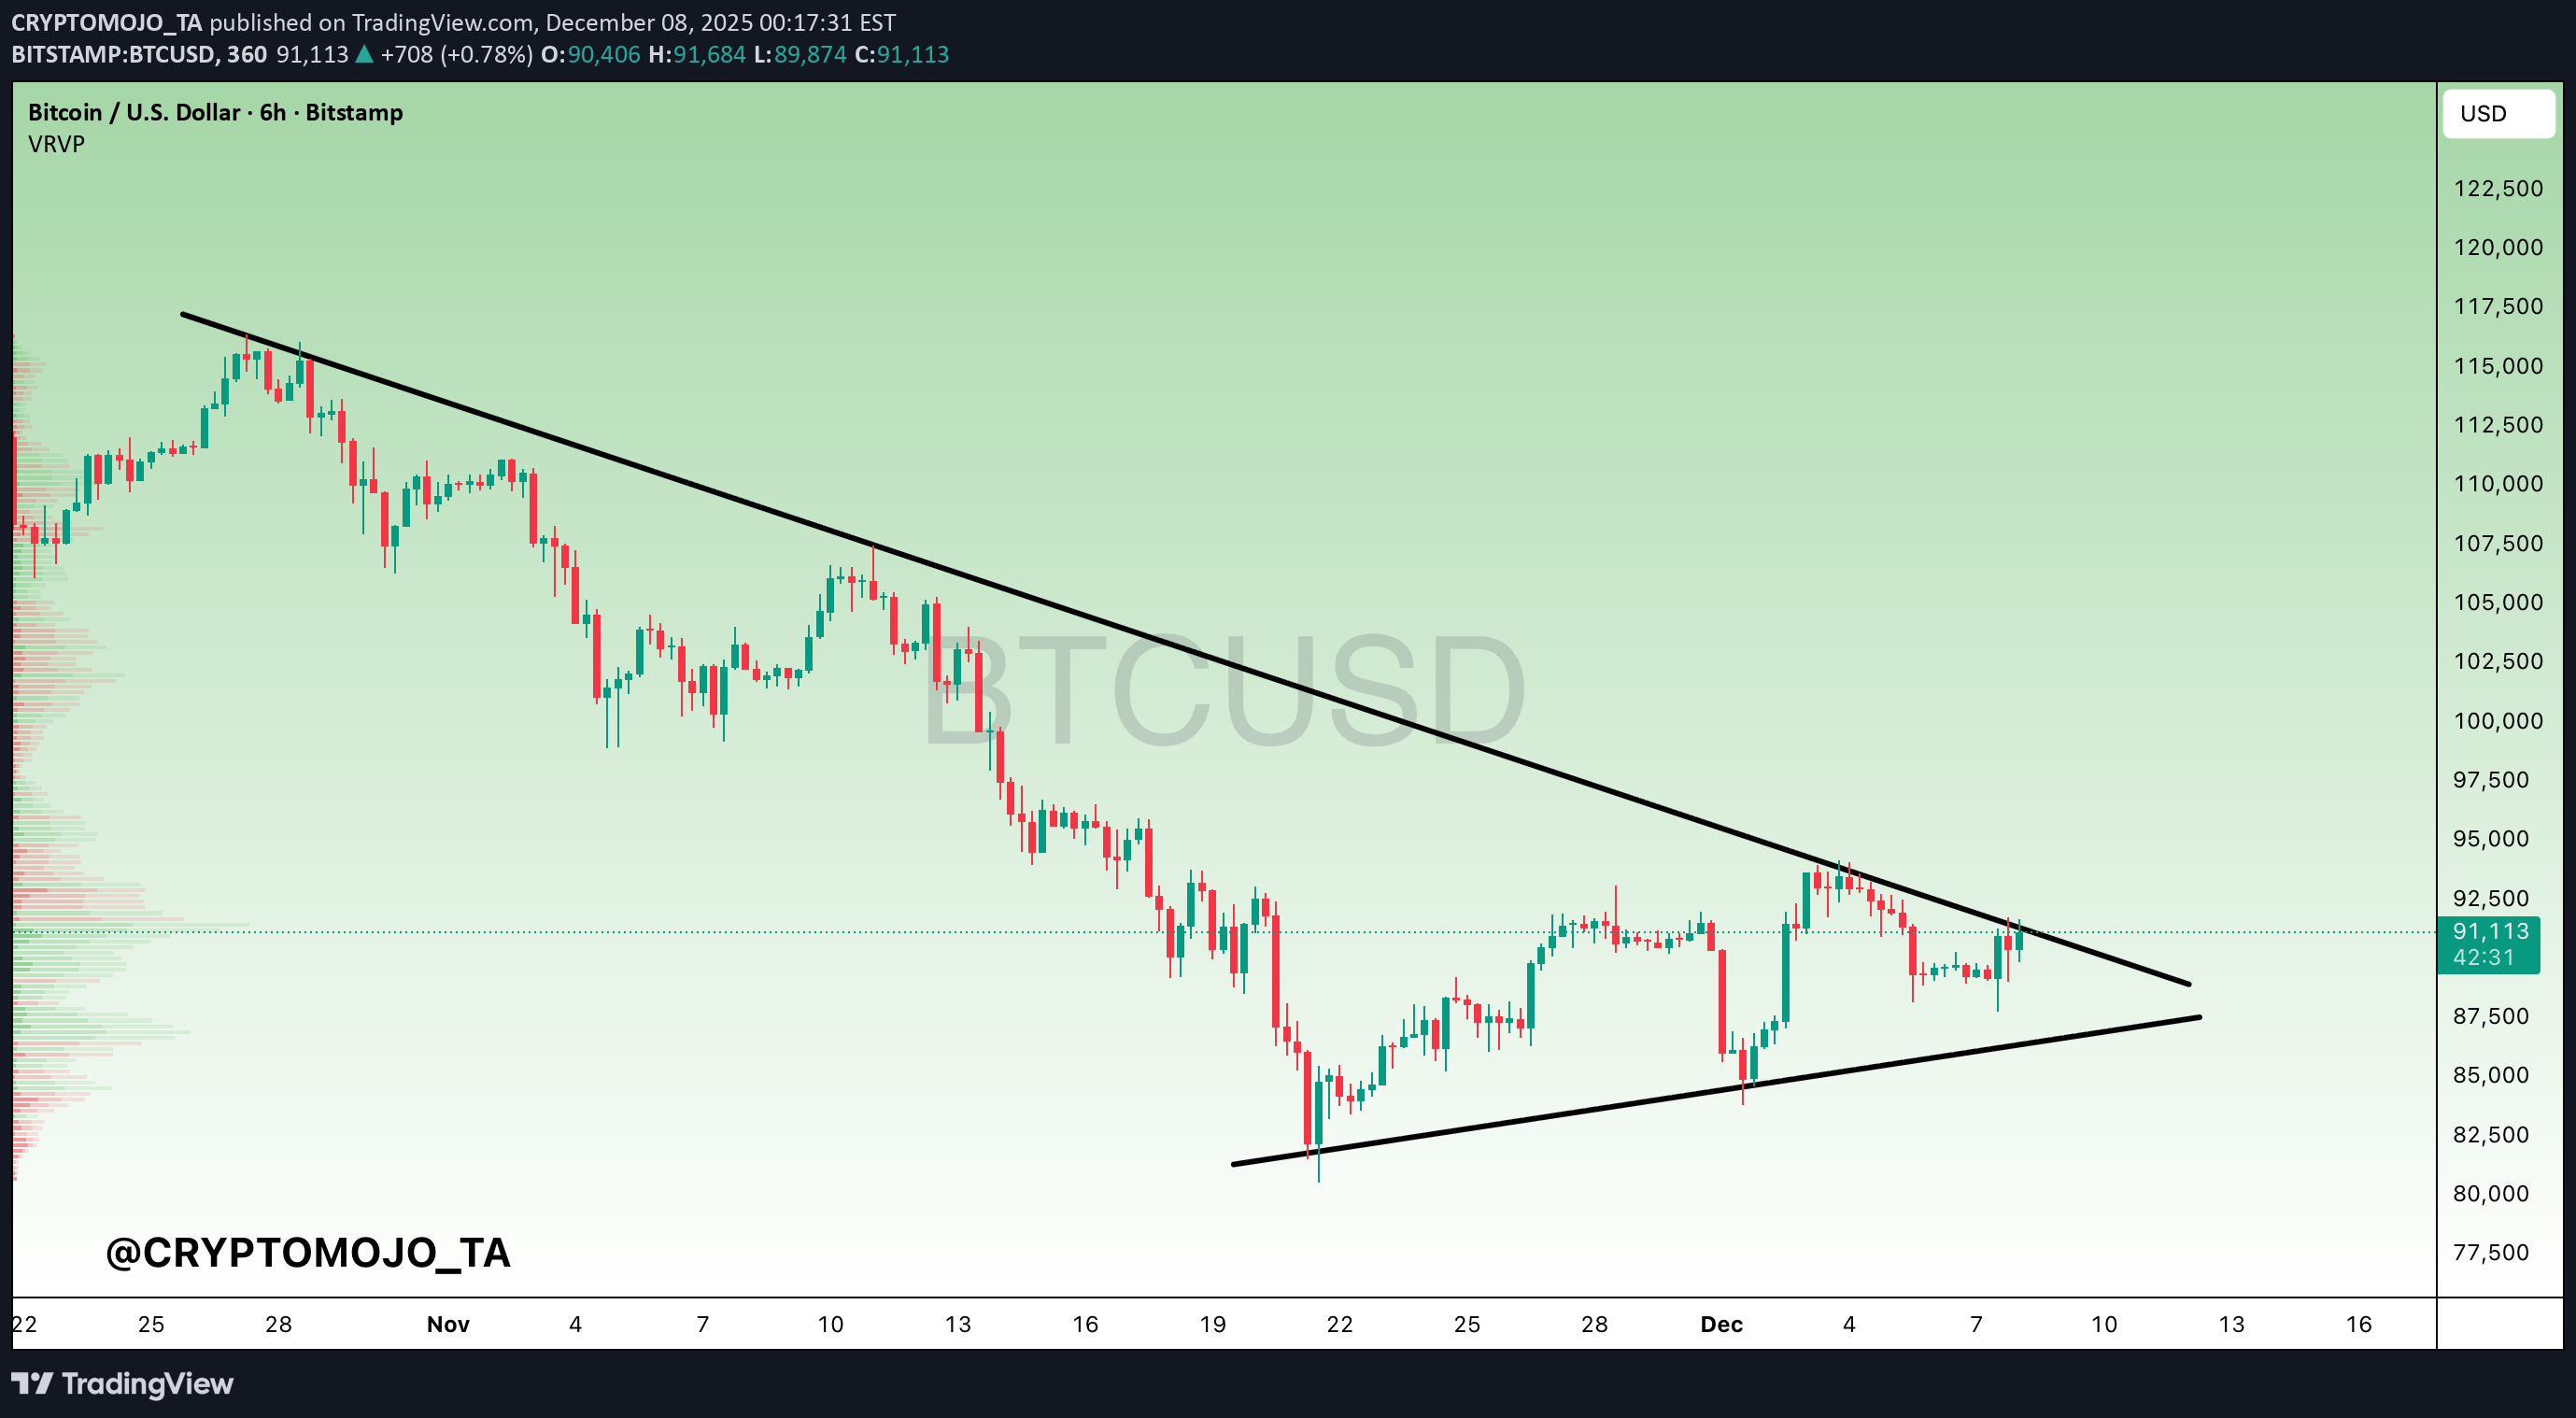
شکست خط روند بیت کوین: آیا سقوط به ۹۳ هزار یا ۸۵ هزار قطعی است؟
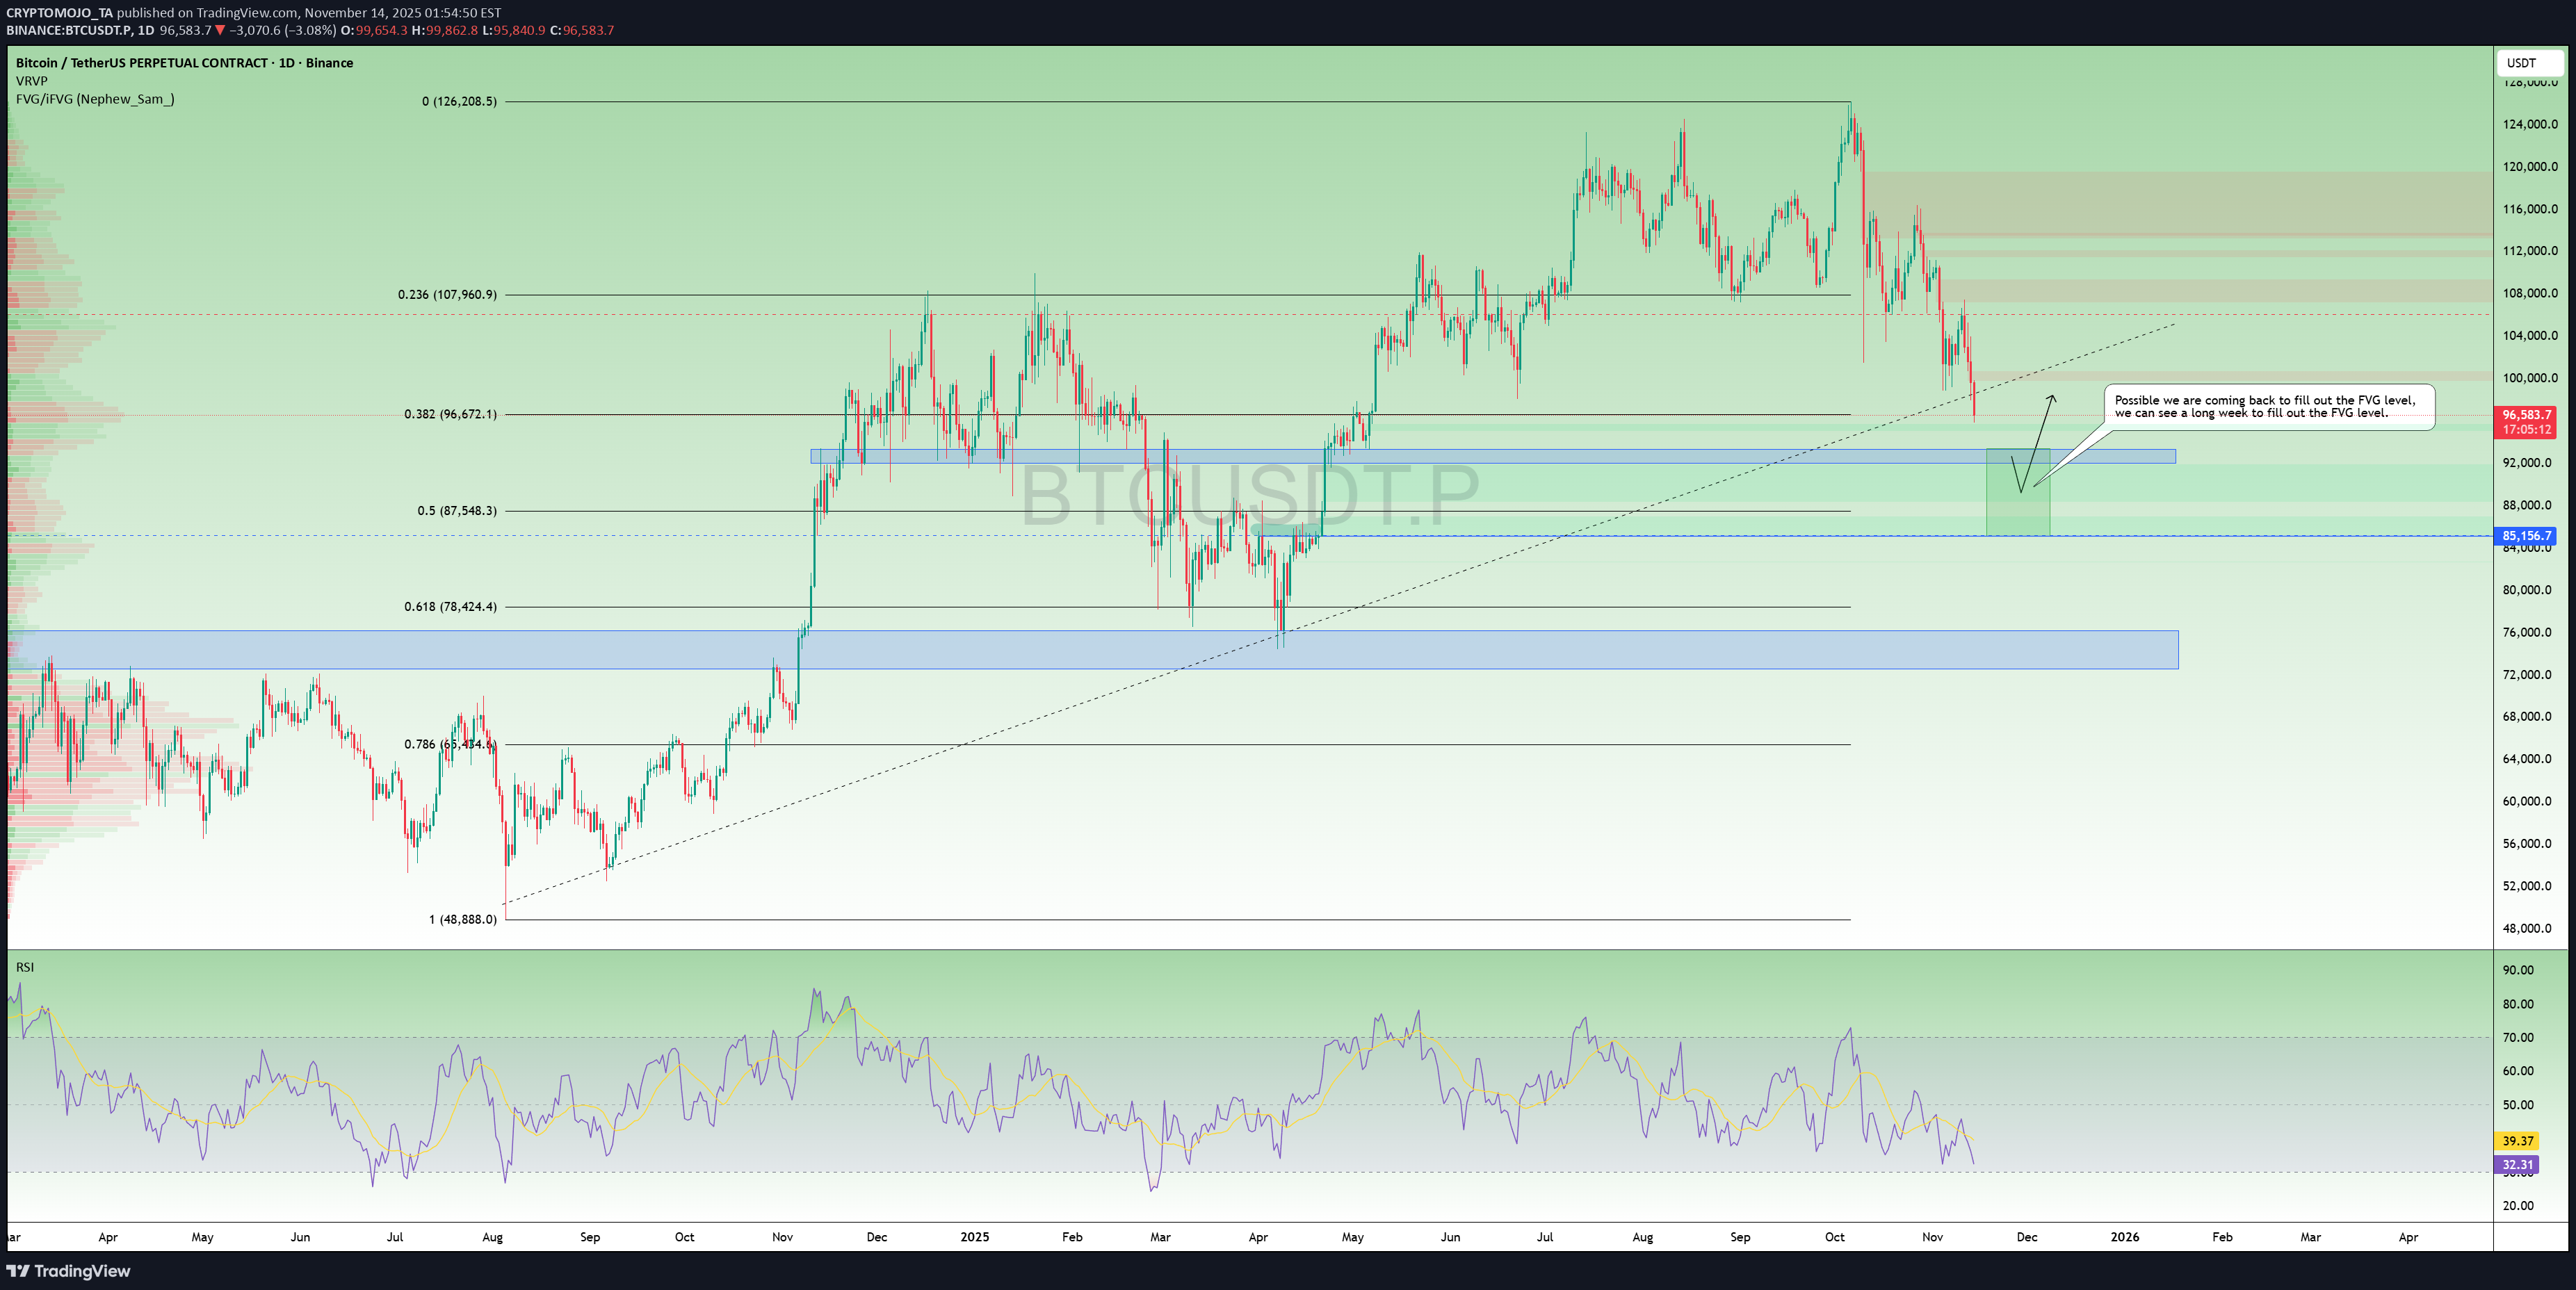
BTC التحدیث الیومی للهیکل - فقدان خط الاتجاه، والأعین على دعم یتراوح بین 92 و93 ألفًا! کسر Bitcoin رسمیًا مستوى دعم خط الاتجاه الیومی، مما یؤکد التحول نحو المزید من الضعف فی هیکل السوق الحالی. یزید هذا الانهیار من احتمالیة الوصول إلى مستویات تصحیح أعمق قبل أی ارتداد ذی معنى. 🔹 المستویات الرئیسیة للمشاهدة ▪️ منطقة دعم 92K – 93K یتجه السعر حالیًا نحو منطقة الدعم الأولى major. تتوافق هذه المنطقة مع الطلب السابق ویمکن أن تقدم رد فعل قصیر المدى. ▪️ 0.5 مستوى فیبوناتشی (≈87.5K) إذا فشل 92K-93K فی الصمود، فإن المغناطیس التالی هو منطقة تصحیح 0.5 FIB. تاریخیًا، یحترم BTC مستوى الارتداد 0.5 خلال تصحیحات منتصف الدورة، لذا فإن هذه المنطقة مهمة. ▪️ فجوة القیمة العادلة (FVG) – تستهدف 85 ألفًا یوجد FVG مرئی فی الأسفل، ویقترح الهیکل الآن عودة محتملة لملئه. الفتیل الطویل إلى 85 ألف موجود تمامًا على الطاولة إذا استمر الزخم فی الانخفاض. قم بالتعلیق على آرائک وتابع لمزید من التحدیثات.
إخلاء المسؤولية
أي محتوى ومواد مدرجة في موقع Sahmeto وقنوات الاتصال الرسمية هي عبارة عن تجميع للآراء والتحليلات الشخصية وغير ملزمة. لا تشكل أي توصية للشراء أو البيع أو الدخول أو الخروج من سوق الأوراق المالية وسوق العملات المشفرة. كما أن جميع الأخبار والتحليلات المدرجة في الموقع والقنوات هي مجرد معلومات منشورة من مصادر رسمية وغير رسمية محلية وأجنبية، ومن الواضح أن مستخدمي المحتوى المذكور مسؤولون عن متابعة وضمان أصالة ودقة المواد. لذلك، مع إخلاء المسؤولية، يُعلن أن المسؤولية عن أي اتخاذ قرار وإجراء وأي ربح وخسارة محتملة في سوق رأس المال وسوق العملات المشفرة تقع على عاتق المتداول.