
niclaxfx
@t_niclaxfx

Ne tavsiye etmek istersiniz?
önceki makale
پیام های تریدر
filtre
niclaxfx
بیت کوین به ۲۵۰ هزار دلار میرسد؟ مسیر بازیابی و پیشبینی هفتههای آینده
Merhaba arkadaşlar bu videoda piyasanın güncel durumu hakkında düşüncelerimi paylaştım. BTCUSD Boğa piyasasının neden henüz bitmediğine inanıyorum ve önümüzdeki haftalarda neler beklenebilir? Bu içeriği faydalı buluyorsanız beğenin, paylaşın, takip edin ve en önemlisi görüşlerime katılıyorsanız veya katılmıyorsanız düşüncelerinizi aşağıdaki yorumda paylaşın. Birbirimize yardım edelim. Şerefe.💚
niclaxfx
بیت کوین در آستانه جهش بزرگ: راز الگوی "کف دوقلو" فاش شد!
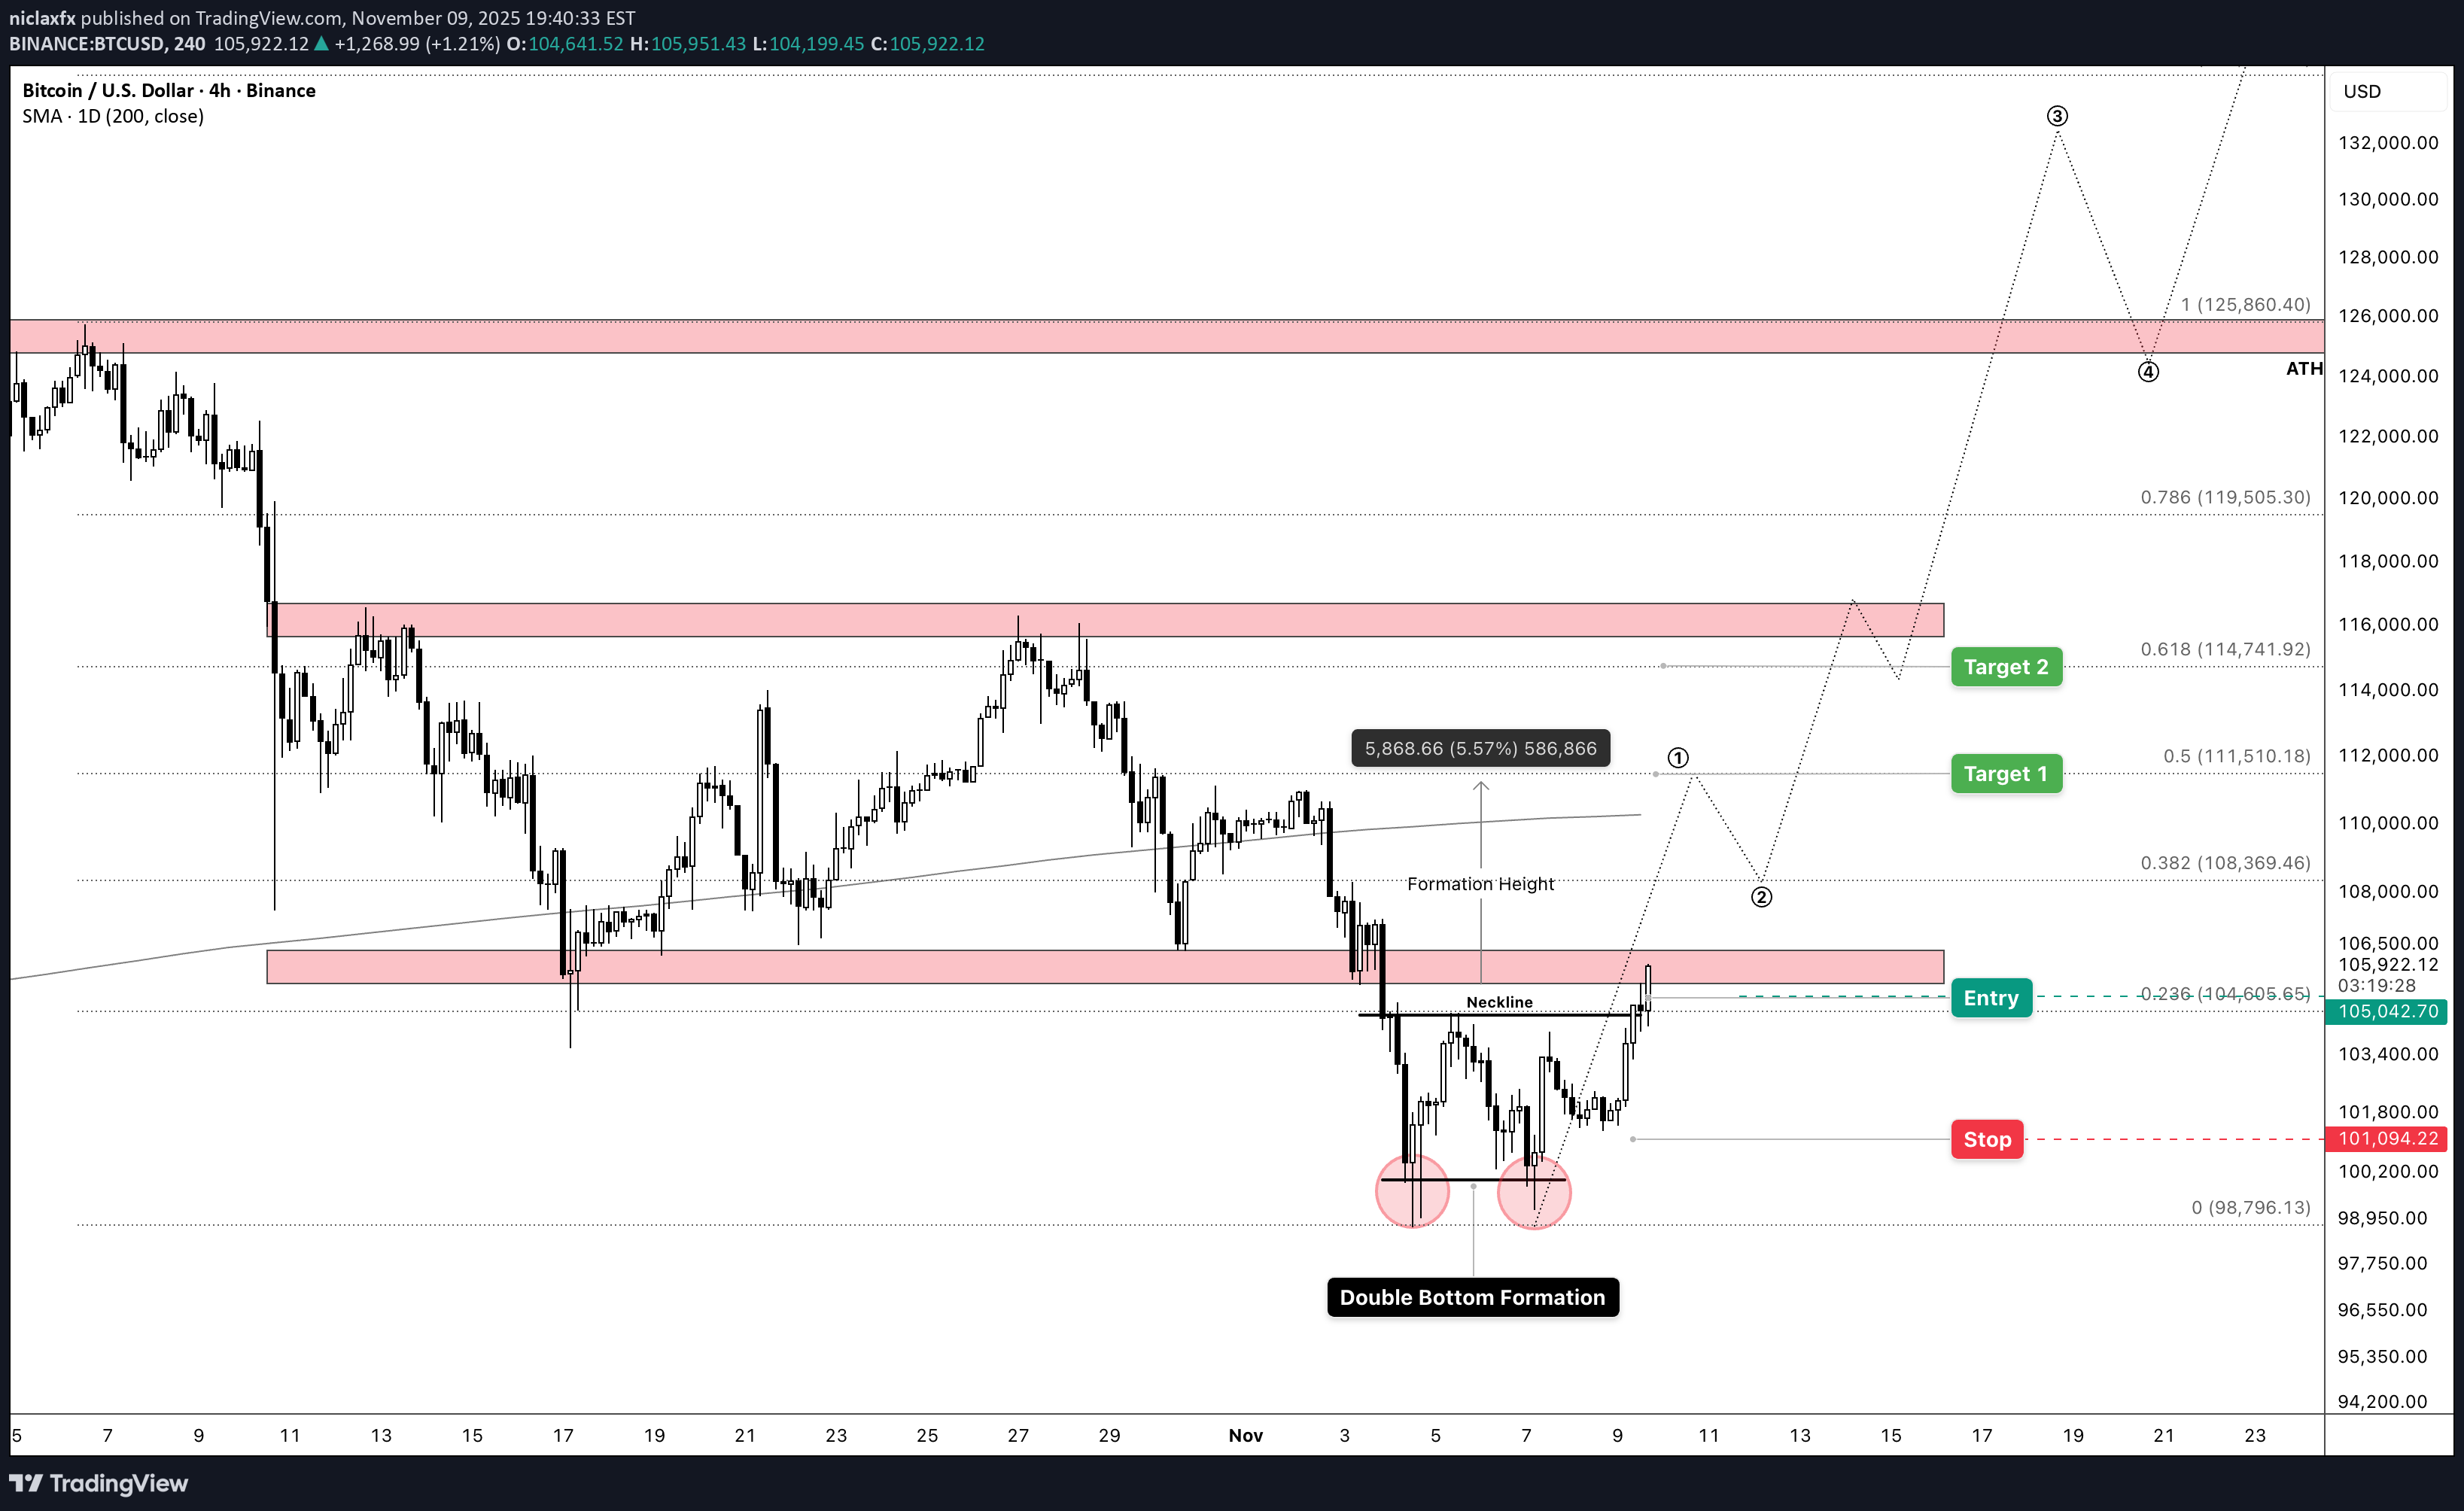
Haftalarca süren konsolidasyondan ve zayıf elleri sarsan keskin bir düşüşten sonra, BITCOIN bir sonraki major ayağı için hazırlık yapıyor gibi görünüyor. 4 saatlik grafik, genellikle bir düzeltmenin sonunu ve yeni bir yükseliş trendinin başlangıcını işaret eden bir model olan çift dip oluşumunu ortaya koyuyor. Kurulum Bitcoin'in Kasım ayı başında 126 bin dolar bölgesinden reddedilmesinin ardından, 98 bin dolar ile 100 bin dolar seviyesinin yakınında destek bulan ölçülü bir geri çekilmeye tanık olduk. Bu önemli destek bölgesi şimdi iki kez test edildi ve çift dip formasyonumuzun temelini oluşturan iki ayrı düşük seviye oluşturuldu. 104,6 bin dolar civarında bulunan boyun çizgisinin ciddi bir şekilde ihlal edilmesi, alıcıların kontrolü yeniden ele geçirdiğini gösteriyor. Bu kurulumu özellikle ilgi çekici kılan, ölçülen move hedefidir. Formasyon yüksekliğini kırılma seviyesinden tahmin ederek, 0,618 Fibonacci geri çekilme seviyesine uygun bir şekilde hizalanmış 111,5 bin dolar civarında bir ilk hedefe ulaşıyoruz. Bu birleşme yükseliş tezine ağırlık katıyor. Buradaki risk-ödül caziptir. Zararı durdur, son salınım düşük seviyesi olan 101 bin doların hemen altında konumlanıyor; bu da kabaca 3:1'lik bir ödül/risk oranına denk geliyor. İleriye Giden Yol Eğer BITCOIN Boyun çizgisinin üzerindeki desteği ve mevcut fiyat hareketini korurken, en az direncin yolu yukarı doğru görünüyor. Ölçülen move projeksiyonu, önümüzdeki seanslarda 108 bin dolar ile 111 bin dolar aralığında yapılandırılmış bir ilerleme görebileceğimizi gösteriyor. Anlık hedefin ötesinde, grafik daha da iddialı seviyelere işaret ediyor; ivme devam ederse tüm zamanların en yüksek seviyesi olan 126 bin dolar yeniden odak noktasına gelecek. elbette, BITCOIN move düz çizgiler halinde değildir. Destek olarak konsolidasyon aşamalarını ve boyun çizgisinin potansiyel yeniden testlerini bekleyin. Önemli olan, alıcıların herhangi bir geri çekilme durumunda 104 bin dolar ile 105 bin dolar bölgesini savunmaya devam edip etmeyeceğidir. 📝TL;DR Bitcoin, 98 bin dolar ile 100 bin dolar desteğini iki kez test ettikten sonra çift dip formasyonu oluşturdu. 104,6 bin dolarlık boyun çizgisi kırılması 111,5 bin doları hedefliyor ve çekici bir risk-ödül kurulumu sunuyor. Geçersiz kılma 101 bin doların altında gerçekleşir. --- Geçersiz kılma: Sürekli bir kırılma ve 4 saatlik kapanışın 101 bin doların altında olması, yükseliş yapısını geçersiz kılacak ve düzeltmenin 98 bin dolarlık destek bölgesine doğru daha aşağılara doğru uzayabileceğini öne sürecek. --- *Not: Bu analiz eğitim amaçlıdır. Her zaman kendi araştırmanızı yapın ve riski uygun şekilde yönetin.*
niclaxfx
نبرد روانی طلا و بیت کوین: کدام دارایی واقعاً به اوج رسید؟
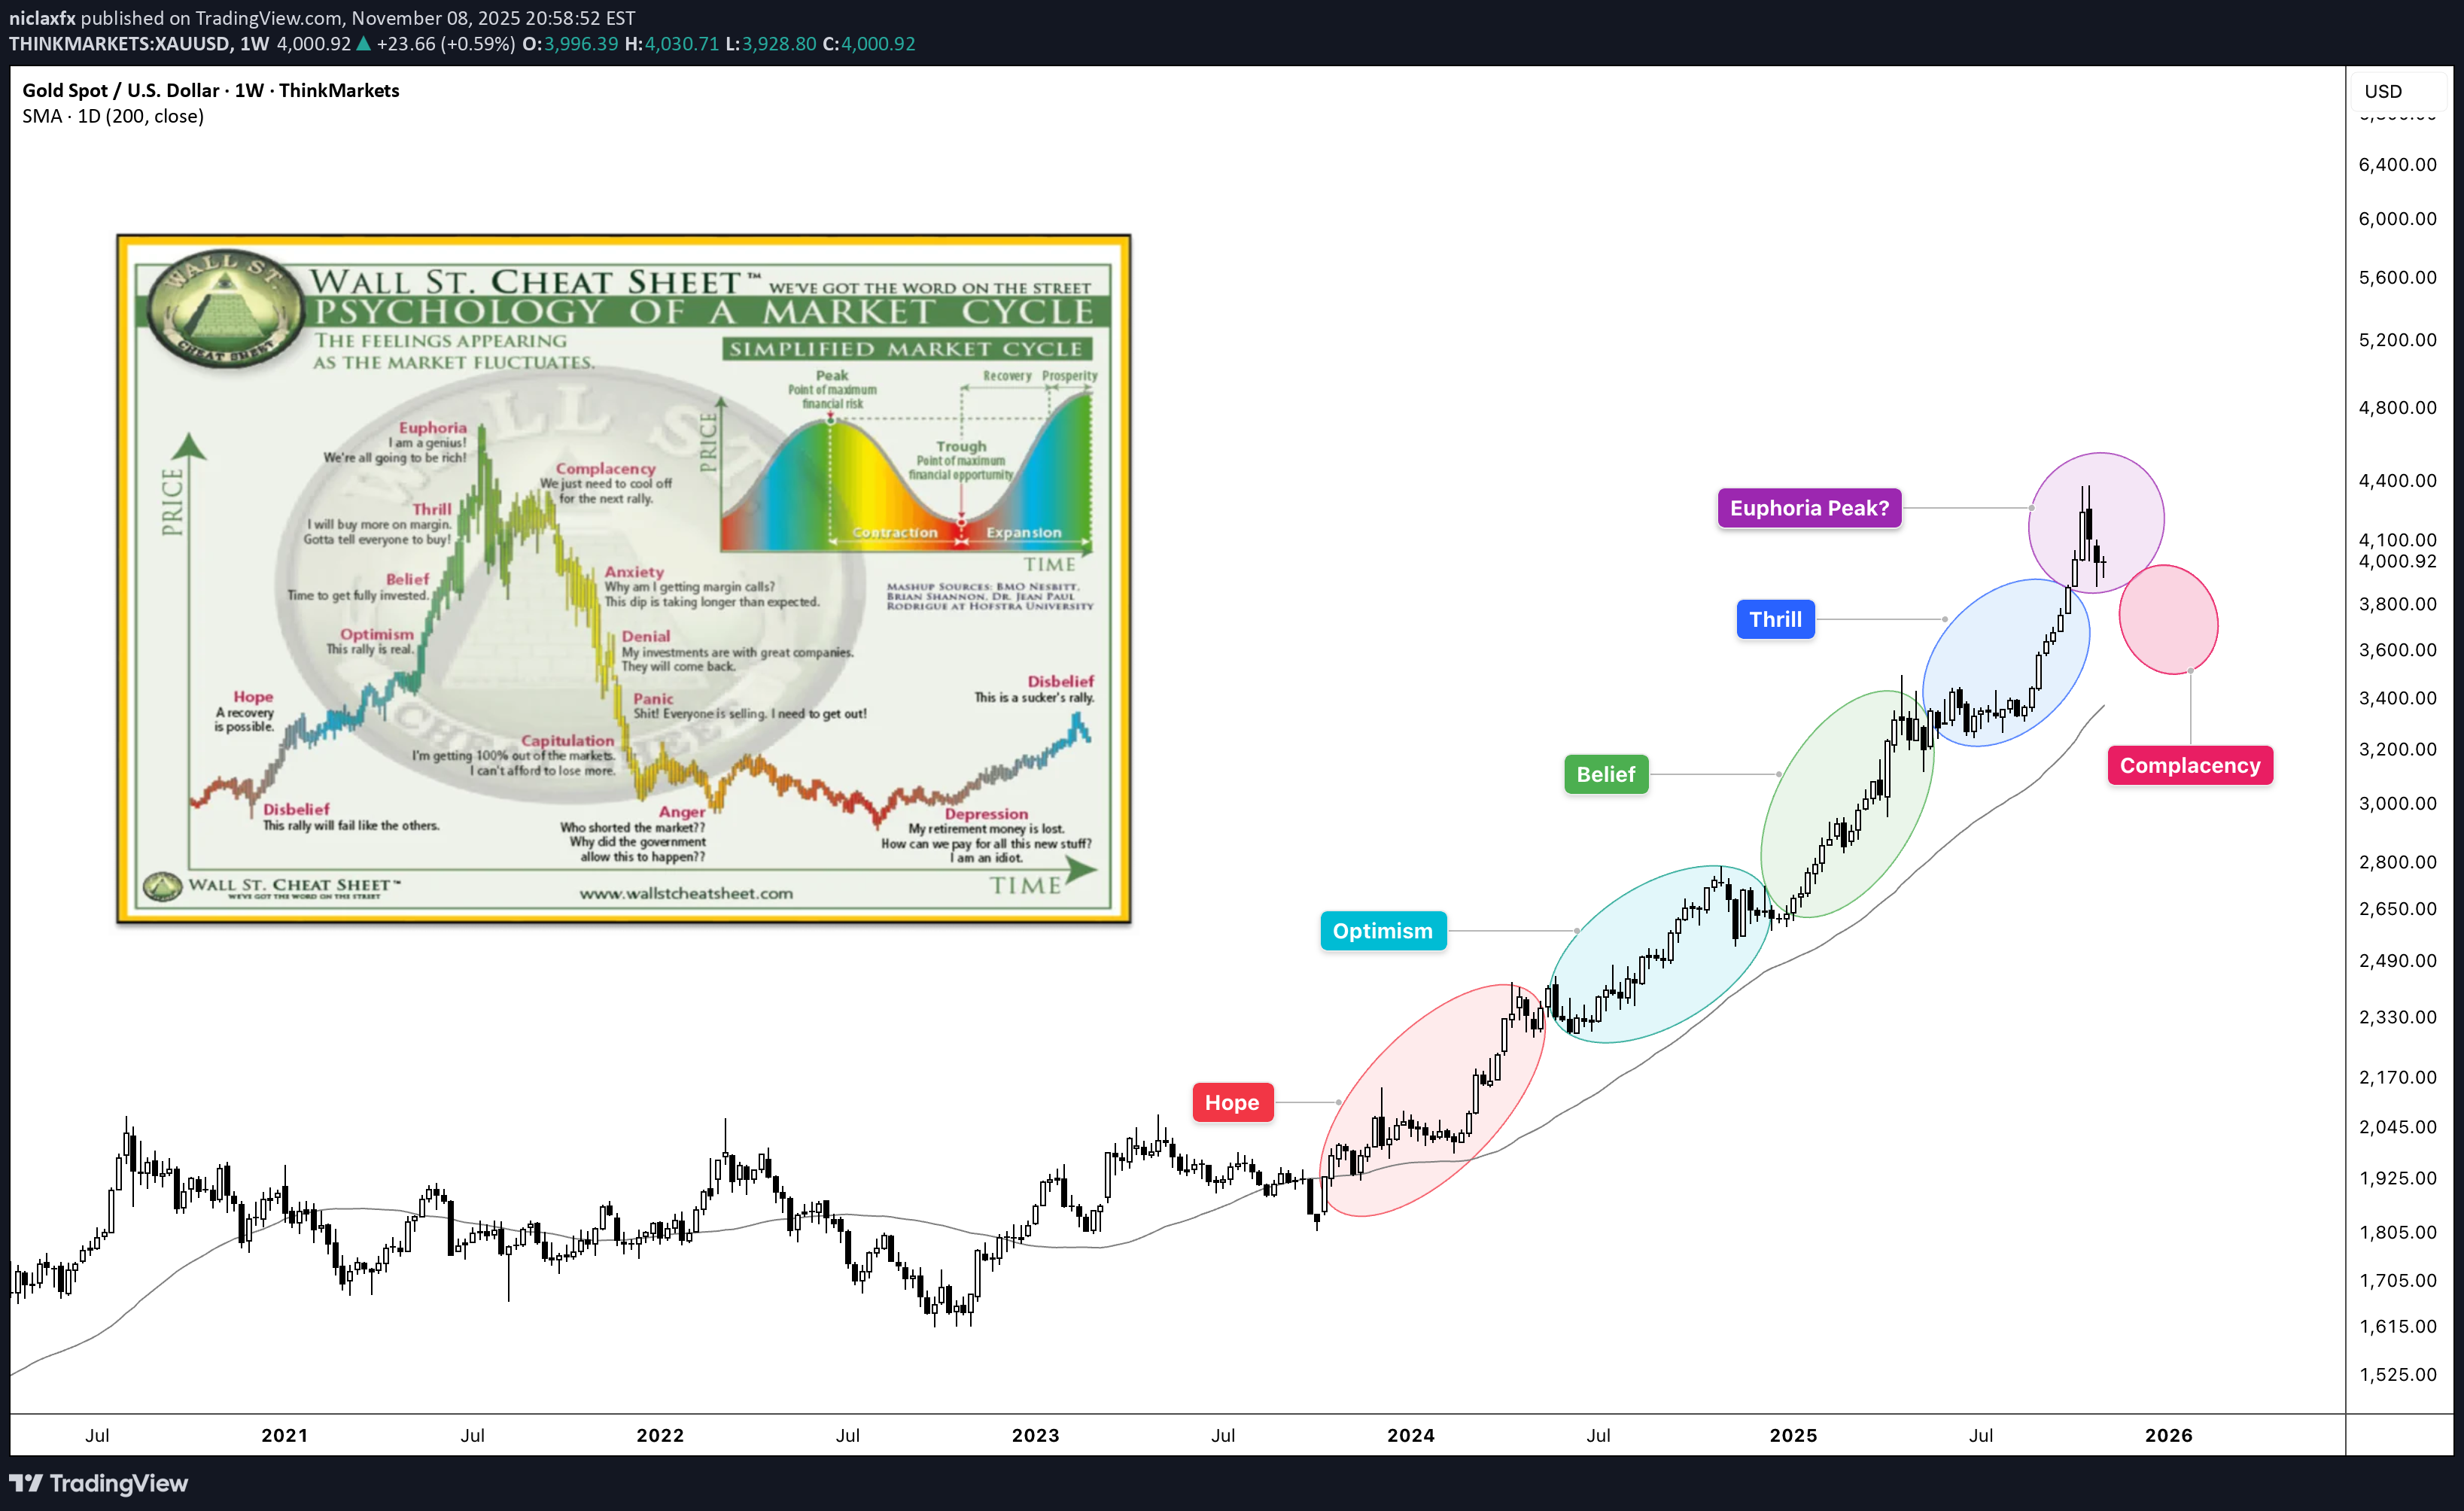
🧠 The Psychology Test That Changes Everything Here's a simple test that will tell you everything about where GOLD and BITCOIN is in its cycle: Look at these two charts. Which one screams "bull market euphoria"? ──────────────────────────────────── Chart One 🥇 GOLD : A Textbook Bull Market Current Price: $4,000.92 Peak Price: $4,390 (Recently hit) RSI: 69.15 Phase: EUPHORIA → COMPLACENCY (Post-peak pullback) What the Psychology Chart Shows: Looking at XAUUSD price action overlaid with the Wall Street Cheat Sheet: ✅ Clean parabolic structure - No ambiguity ✅ Multiple phases completed - Hope → Optimism → Belief → Thrill → Euphoria ✅ Peak already hit at $4,390 - The pink Euphoria circle was touched ✅ Now pulling back from peak - Classic post-euphoria behavior ✅ RSI cooling from overbought - Down from 85+ to 69.15 ✅ Volume still elevated as reality sets in This is what a COMPLETED bull market looks like. When you see this chart, you don't second-guess. You don't wonder "is this a bull market?" You KNOW it is. ──────────────────────────────────── Chart Two ₿ BITCOIN : Still in Early Stages Current Price: $101,802.2 RSI: 44.61 Phase: OPTIMISM (not even Belief yet) What the Psychology Chart Shows: Looking at BTCUSD price action overlaid with the Wall Street Cheat Sheet: ⚠️ "We are here" marker - Sitting in the OPTIMISM phase ⚠️ Haven't reached Belief yet - The green zone is still ahead ⚠️ Thrill phase - Blue circle far above current price ⚠️ Euphoria phase - Pink circle even further away ⚠️ RSI at 44.61 - Not even close to overbought ⚠️ Fourth Halving marker - April 22, 2024 clearly noted This is what mid-cycle consolidation looks like. ──────────────────────────────────── 🔍 The Critical Difference Let me use an analogy: Think of market cycles like a marathon. GOLD (Chart 1): Mile 26 - Just crossed finish line - Race is over, starting to cool down Runners are slowing down after sprint (Post-euphoria) Crowd peaked, now dispersing (Volume still high but declining) Everyone saw the finish (Peak at $4,390) Now wondering if they should have sprinted harder BTC (Chart 2): Mile 8 of 26 - Still early in the race Runners are fresh and steady (Optimism) Crowd is watching but not cheering wildly yet Most people aren't even at the venue yet Many spectators think the race might be cancelled ──────────────────────────────────── 📊 Side-by-Side Psychology Comparison ──────────────────────────────────── 🎯 What This Tells Us About BITCOIN If BTCUSD were truly at a cycle top, it would look like GOLD : ❌ Parabolic vertical moves ❌ RSI pinned above 75 for weeks ❌ Volume exploding ❌ Everyone saying "Bitcoin to $500K" ❌ Taxi drivers asking about crypto ❌ Magazine covers everywhere ❌ No doubt whatsoever about the trend But BTCUSD looks nothing like that: ✅ Choppy consolidation ✅ RSI in neutral zone (44.61) ✅ Volume moderate ✅ Everyone asking "Is the bull market over?" ✅ Retail despair and fear ✅ Zero mainstream coverage ✅ Maximum doubt about the trend ──────────────────────────────────── 💡 The Psychology Principle Here's the key insight from behavioral finance: **"If you have to ask whether you're in a bubble, you're not in a bubble."** GOLD : No one is asking if GOLD is in a bull market. It's obvious. BITCOIN : Everyone is asking if BITCOIN is in a bull market. That's your answer. ──────────────────────────────────── 🧩 Where Each Asset Really Is GOLD - Post-Peak Bear Market Transition: Completed Phases: ✅ Hope (Oct '23 - May '24) ✅ Optimism (May '24 - Dec '24) ✅ Belief (Dec '24 - May '25) ✅ Thrill (May '25 - Sep '25) ✅ EUPHORIA - PEAKED at $4,390 (Oct '2025) Current Phase: 🔶 COMPLACENCY - "It'll come back to $4,390" Price: $4,000.92 (down ~9% from peak) Classic post-euphoria denial behavior What's Next: Anxiety → Denial → Panic → Capitulation (2026+) Time Remaining: Bull market is OVER - bear phase beginning ──────────────────────────────────── BTCUSD - Early-Mid Bull Market: Completed Phases: ✅ Hope (2023 - Post-FTX recovery) 🟡 OPTIMISM (Current - 2024-2025) Phases Still Ahead: ⬜ Belief ⬜ Thrill ⬜ Euphoria What's Next: Break into Belief phase → Thrill → Euphoria Time Remaining: Given BTC high volatile nature - 2-6 months of upside potential ──────────────────────────────────── 🎨 The Visual Test (Do This Right Now) Step 1: Look at the GOLD chart Does it look like a bull market? YES Could you be wrong? NO Is there any doubt? ZERO Step 2: Look at the BITCOIN chart Does it look like a bull market? MAYBE? Could you be wrong? POSSIBLY Is there any doubt? TONS Step 3: Ask yourself **"Would a cycle TOP have this much doubt and fear?"** The answer is NO. ──────────────────────────────────── 📈 What the RSI Divergence Tells Us GOLD RSI Pattern: Peaked above 85 during euphoria Currently cooling at 69.15 Rolling over from overbought Classic post-peak behavior This is bear market transition BITCOIN RSI Pattern: Sitting at 44.61 Plenty of room to run Not even approaching overbought Recent "Bear" signals flushing out This is early-cycle behavior Think of it like a gas tank: GOLD : Hit redline at $4,390, now coasting down on fumes BITCOIN : 45% full, tons of room to run ──────────────────────────────────── 🔥 The Contrarian Insight What the majority thinks: " GOLD is in a bubble, BITCOIN topped" What the charts actually show: GOLD is in a mature bull market (near end) BITCOIN is in early-mid bull market (tons of runway) The irony: Everyone trusts GOLD rally (late stage) Everyone doubts BITCOIN rally (early stage) This is exactly backwards. ──────────────────────────────────── 🎭 The Emotional State Comparison GOLD Holders Right Now: 😰 Starting to feel anxious (down from $4,390) 🤔 "It'll bounce back, right?" 📉 Checking price hoping for recovery 🙃 "I should have sold at $4,390" 😬 "This is just a healthy correction" This is COMPLACENCY - the denial phase after euphoria. BITCOIN Holders Right Now: 😰 Anxious and doubtful 🤐 Not talking about their positions 😔 Wondering if they should sell 📉 Feeling defeated 💀 "Maybe the cycle is over" Which emotional state typically marks: Post-cycle tops? → GOLD current state (Complacency/Denial after Euphoria peak) Cycle middles? → BITCOIN current state (Doubt during Optimism) ──────────────────────────────────── 💎 The Bottom Line Using the Wall Street Cheat Sheet as our guide: GOLD : Phase: Thrill → Euphoria Completion: ~95% through cycle Risk/Reward: High risk, limited reward Action: Take profits soon BITCOIN : Phase: Optimism (just finished Hope) Completion: ~30% through cycle Risk/Reward: Moderate risk, massive reward Action: Accumulate aggressively ──────────────────────────────────── 🧠 The Psychology Lesson The market is designed to make you feel wrong at exactly the wrong time: When GOLD peaked at $4,390 (Euphoria) → You felt confident, " GOLD to $5K!" Now GOLD is pulling back (Complacency) → You feel like "it's just a correction" When BITCOIN is cheap and poised (Optimism) → You feel scared to buy This is why most people: Miss selling tops (felt too good at $4,390) Hold through corrections (denial and complacency) Sell bottoms during fear (Optimism feels scary) To win, you must: Trust the structure over the sentiment Buy when it feels uncomfortable (Optimism/Belief) Sell when it feels amazing (Euphoria/Peak) ──────────────────────────────────── 📍 Where We Actually Are HOPE → OPTIMISM( BITCOIN ) → BELIEF → THRILL → EUPHORIA ( GOLD $4390 Peak) → COMPLACENCY → ( GOLD Current) BITCOIN is 3-4 phases behind GOLD . GOLD already peaked. BITCOIN hasn't even started its parabolic phase yet. ──────────────────────────────────── 🎯 What This Means for Your Portfolio If you're holding GOLD at $4,000: You missed the peak at $4,390 You're in post-euphoria complacency "It'll bounce back" is denial Risk/reward is terrible now Exit strategy needed YESTERDAY If you're doubting BITCOIN at $102K: You're sitting in Optimism You're early to the party Peak is 3-4 phases away Risk/reward is excellent Accumulation strategy needed NOW ──────────────────────────────────── 🔚 Final Thought The next time someone tells you " BITCOIN topped," show them these two charts side by side. Ask them: "Which one actually topped?" The answer is clear: GOLD peaked at $4,390 and is now in complacency denial. BITCOIN is still in optimism. GOLD finished its race. BITCOIN is just finishing Act 1. The Golden Bull Run isn't over—it's barely begun. ──────────────────────────────────── This is educational content comparing market psychology across asset classes. Not financial advice. Always do your own research and manage risk appropriately. ────────────────────────────────────
niclaxfx
سقوط بیت کوین توهم بود؟ چرا رالی طلایی واقعی تازه شروع نشده است!
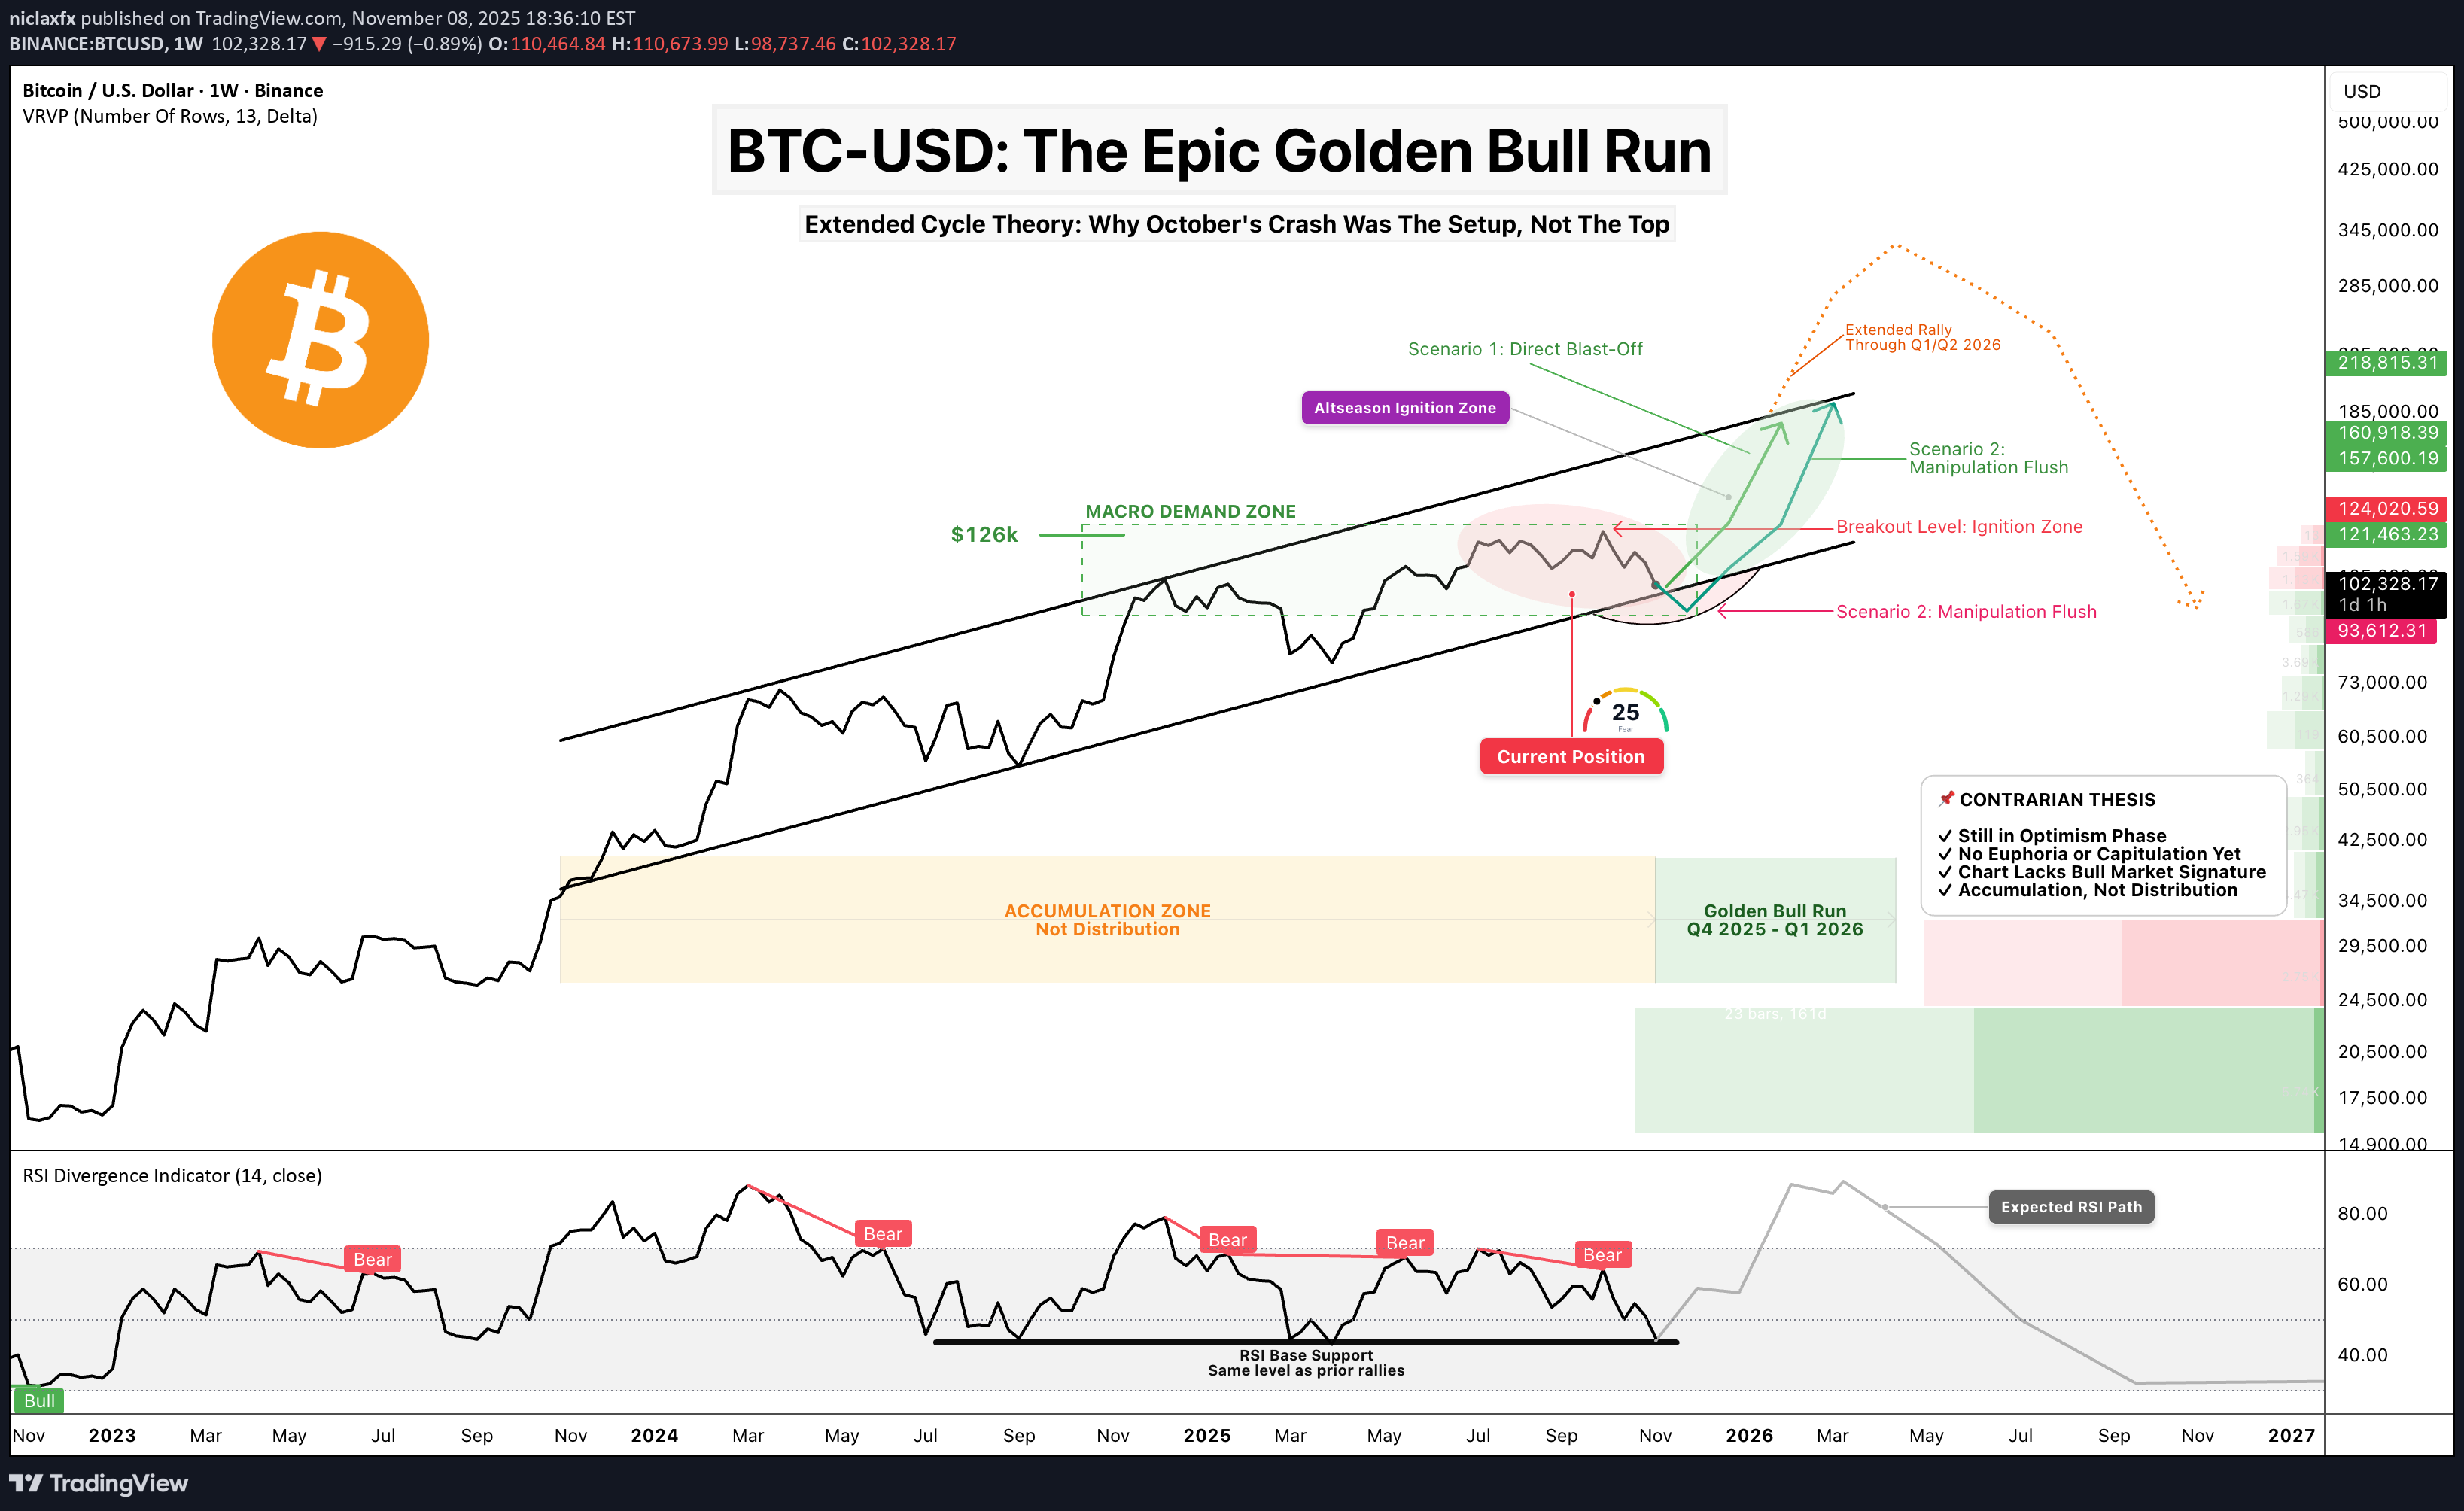
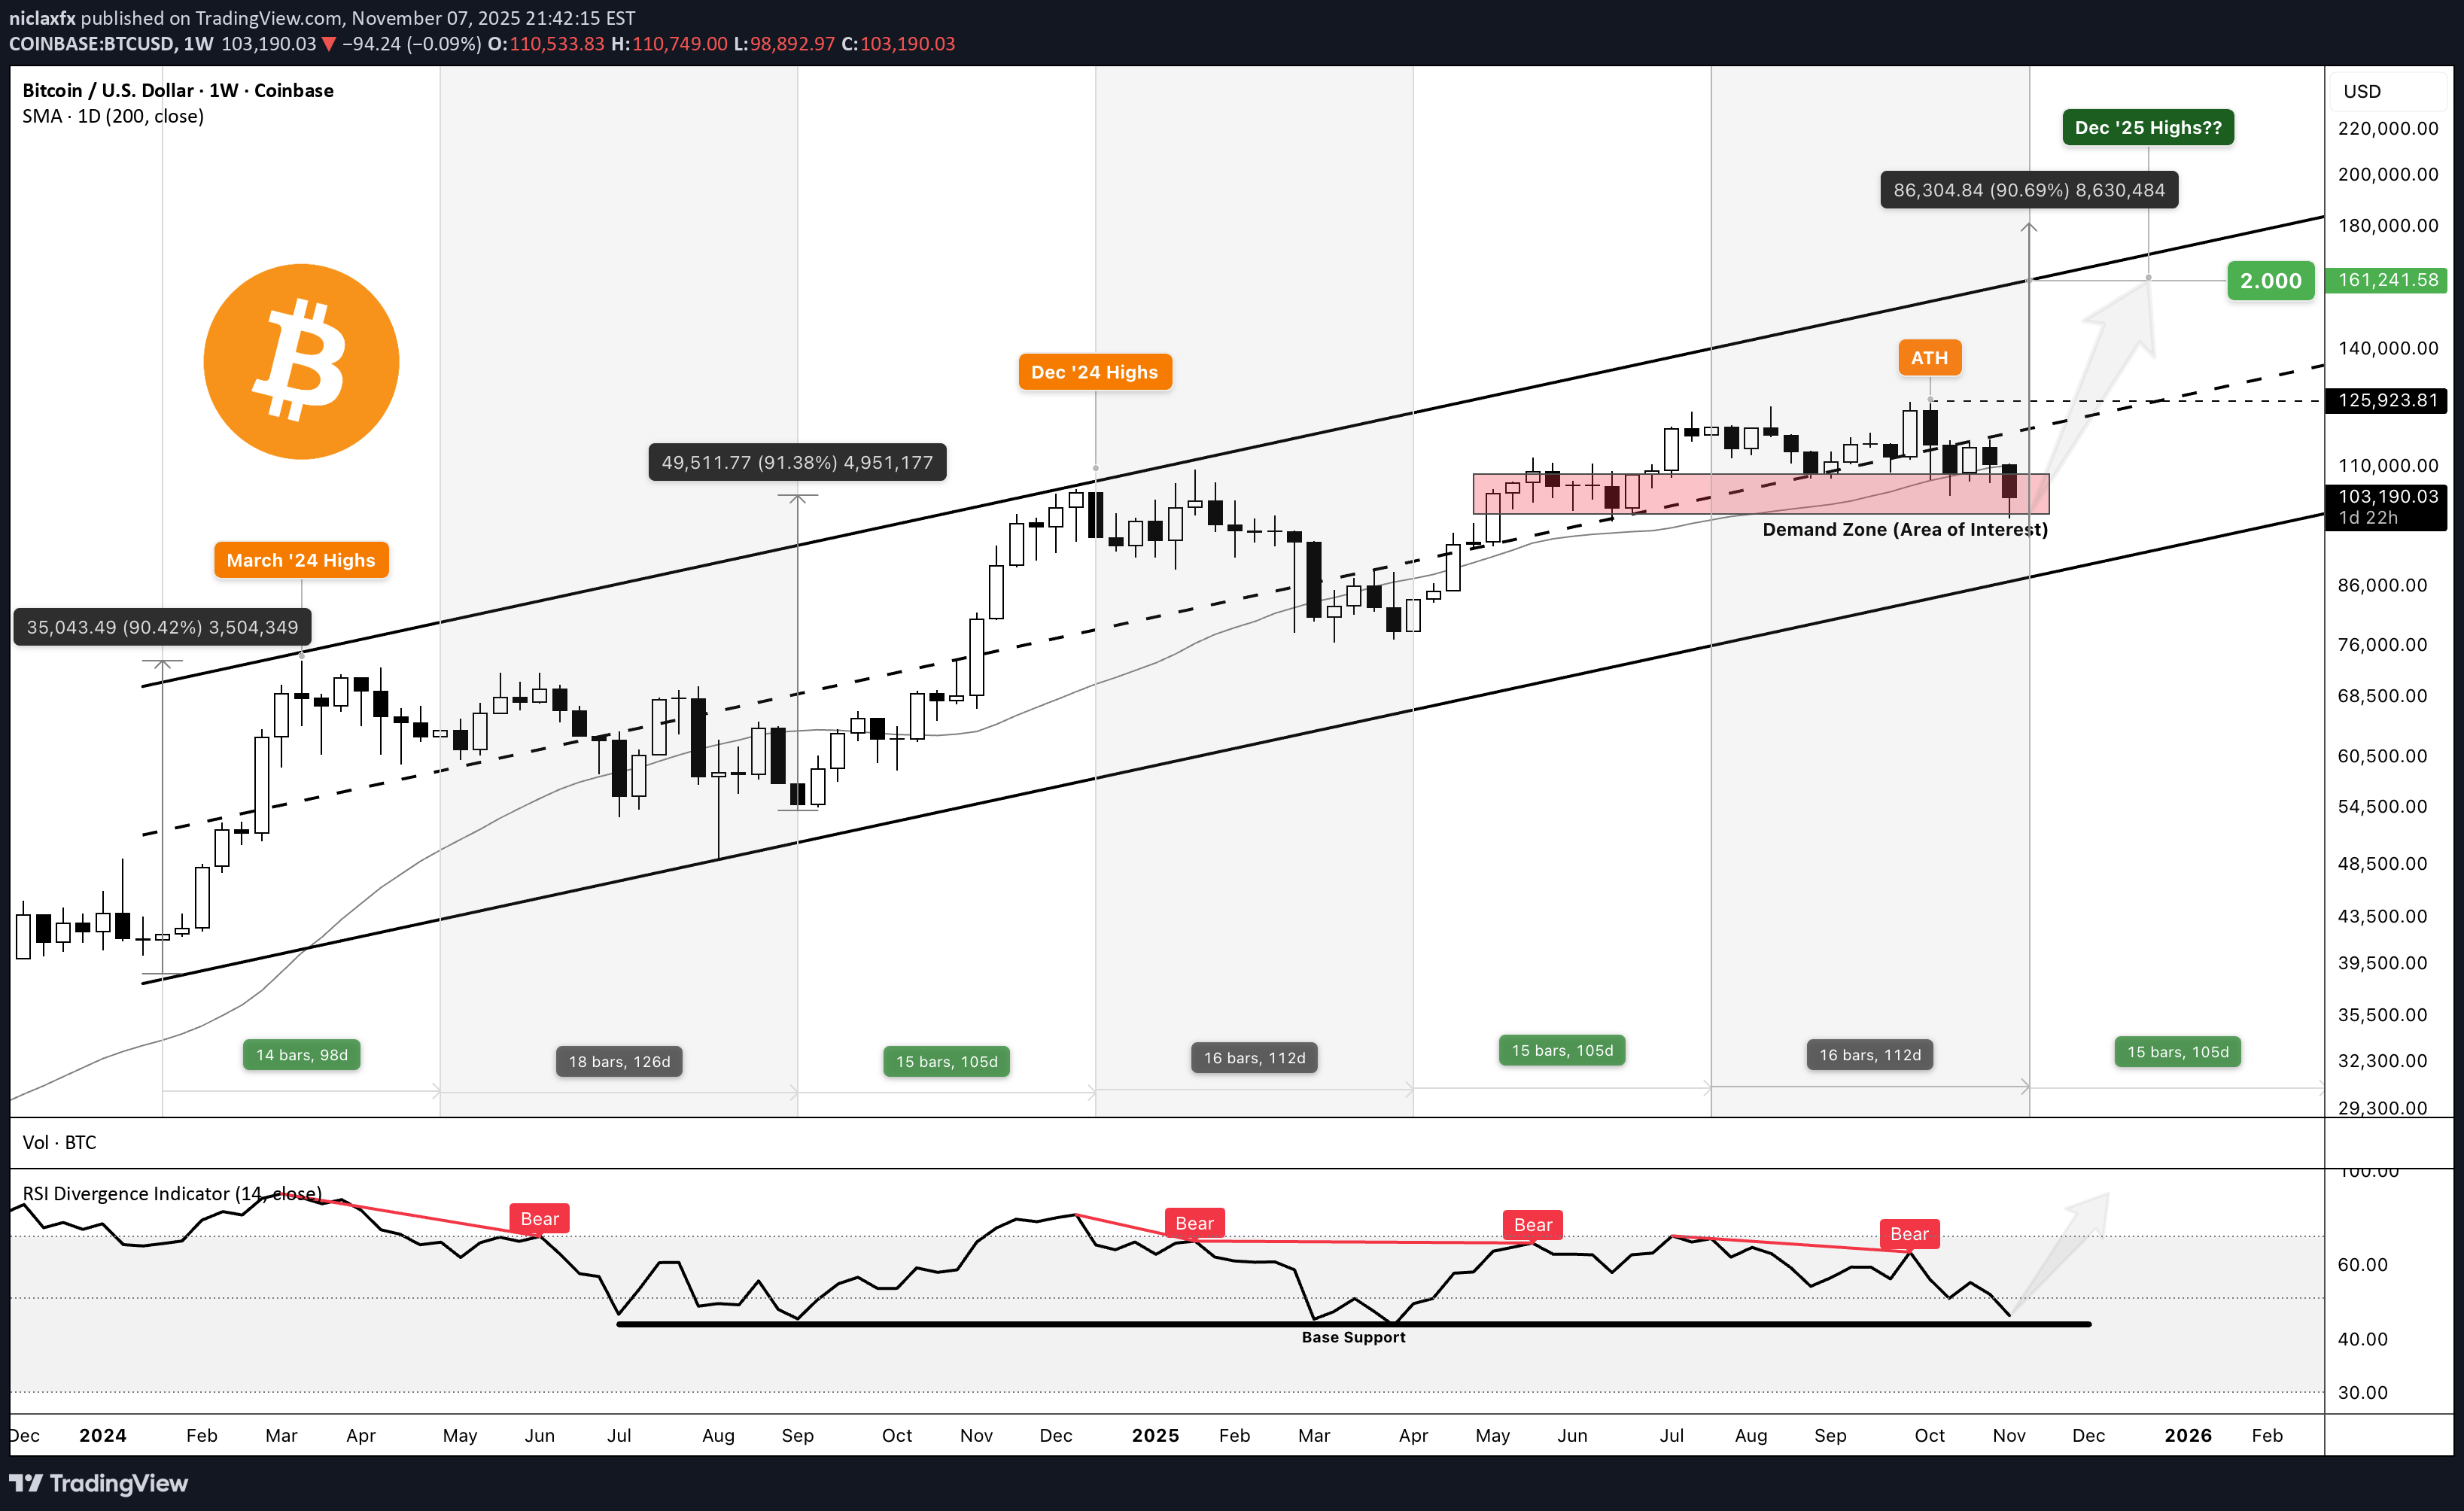
Yes, I get it. Everyone thinks we're already in a bear market. Hope is lost. Life-changing money evaporated. The October crash saw $19 billion in forced liquidations —the largest in crypto history. Some tragically took their own lives. No one wants false hope right now. But I don't think the bull market is over. And here's why—backed by data, not hopium. ──────────────────────────────────── ⚠️ DISCLAIMER This post is strictly my personal beliefs and thoughts, and should NOT be construed as financial advice, nor does it mean the market must go this way. This will be a long read but would be worth the time. Sit tight and grab a beer 🍻 ──────────────────────────────────── Context: Where I Stood in September First, I want to share that as of the last week of September, I gave a detailed breakdown of the market and shared why I thought the bull market was over, which I tagged "The Great Convergence." Read below if you missed that:👉 In that post, I worked with the BITCOIN halving cycle theory (along with SPX and GOLD ), which for over a decade has been the most efficient, accurate, and proven method for timing BITCOIN rallies, tops, and bottoms. By halving theory, the bull market should have ended by August/September 2025. What Actually Happened: Early October : BITCOIN briefly touched a new ATH near $126,296 October 1st : US government shutdown begins, draining $700B+ from markets via TGA October 10th : Trump's 100% China tariff threat triggers $19.13B liquidation cascade in 24 hours BITCOIN crashed from $126K to below $104K—an 18% drop in days October became the first "red October" since 2018 1.6 million traders liquidated—20x larger than COVID crash, 12x larger than FTX November 8th (Today) : Market hovering around $100-102K in extreme fear (Fear & Greed Index: 21) ──────────────────────────────────── 🔍 What's Different About This Current Cycle Here's what stands out as fundamentally different: 1️⃣ The Recent TOTAL Crypto Liquidation Wasn't Capitulation—It Was Infrastructure Cleansing This wasn't profit-taking or true capitulation. The numbers tell the story: $19.13 billion in forced liquidations in 24 hours 1.6 million traders wiped out 20x bigger than the March 2020 COVID crash ($1.2B) 12x bigger than the FTX collapse ($1.6B) This was leverage-driven, not sentiment-driven. The weak hands and overleveraged positions got flushed out. Meanwhile, strong hands (institutions, whales) continued accumulating through the chaos. Key Difference : In true bear market capitulations, holders capitulate. In October, leveraged speculators capitulated while spot holders held firm . ──────────────────────────────────── 2️⃣ The Liquidity Vacuum Is Temporary (This Is Critical) Here's what most people are missing about October: The crash wasn't just about tariffs—it was about a government-induced liquidity crisis . What Happened: US government shutdown began October 1st Treasury General Account (TGA) balance swelled from $800B to over $1 trillion in just 20 days That's $200+ billion drained from the financial system Standing Repo Facility (SRF) usage hit $50.35 billion on October 31—highest since the pandemic crisis in March 2020 This indicated severe dollar shortage in the system Why This Matters: BTCUSD correlation with dollar liquidity remains near 0.85 When the government shutdown ends and resumes spending, that liquidity floods back BitMEX analysts project a strong relief rally when hundreds of billions are injected back This isn't a structural bear market—it's a temporary liquidity vacuum. ──────────────────────────────────── 3️⃣ Institutional Holders Aren't Selling Like Retail Did in Past Cycles Whale Accumulation Data: 1,455 wallets now hold over 1,000 BTC UTXO Age Distribution shows a 5% spike in "Over 8 Years" buckets Long-term holders are doubling down , not distributing Whale Originating Transaction Count: Miner Behavior: Post-halving, miners anticipated higher prices and chose to hold rather than sell immediately While smaller miners face profitability pressure, institutional holders are not showing distribution patterns ETF Context: U.S. spot Bitcoin ETFs saw $1.2B+ in outflows during the crash week October 16 alone: $536 million in panic redemptions BlackRock's IBIT : $268.6M out | ARK's ARKB: $275.2M out BUT HERE'S THE KEY : These were temporary panic outflows, not structural distribution. Year-to-date, institutional accumulation has been relentless . The October outflows represent weak hands being shaken out—exactly what you'd expect in a mid-cycle correction, not a cycle top. ──────────────────────────────────── 4️⃣ No FOMO. No FUD. No Euphoria. (Strongest Psychological Indicators) Let's compare sentiment metrics: Current Sentiment: Crypto Fear & Greed Index: 21-25 (Extreme Fear) as of November 7-8 BTCUSD RSI as at Oct ATH: ~60 (far below euphoric 75+ levels) Market Mood: Despair, capitulation narrative, "bear market confirmed" True Bull Market Top Sentiment (for comparison): Fear & Greed Index: 80-95 (Extreme Greed) RSI: 75-85 (overbought for weeks) Market Mood: "Bitcoin to $500K," taxi drivers asking about crypto, covers of mainstream magazines We haven't even come close to euphoria. The 2024 meme coin craze was a micro-cycle within the broader structure—too early and too isolated to be considered true market-wide euphoria. ──────────────────────────────────── 5️⃣ The CHART Does Not Reflect a Bull Market Yet This is where I'll let the charts speak. First, Look at Gold's Bull Market: 👉 Clean. Parabolic. Obvious. No second-guessing needed. Now Look at Bitcoin: 👉 Ask Yourself Honestly: Does this chart scream "parabolic bull market"? Does the recent ATH look like a blow-off top? Does the volume profile suggest distribution? If you can't answer YES with conviction, then the answer is NO. A Simple Psychology Principle I Use: If I can't say YES without doubting my decision, then the answer is NO. ──────────────────────────────────── 6️⃣ Cycle Coincided with AI Tech Mania and GOLD Super Rally This cycle is unique because capital had competing destinations: AI Tech Mania : Nvidia, AI stocks absorbed massive capital flows GOLD Super Rally : GOLD broke out to all-time highs, attracting safe-haven capital Risk-On Delay : BTCUSD became less attractive as capital rotated elsewhere This delayed the typical BITCOIN Bitcoin cycle dynamics—it didn't end them. ──────────────────────────────────── 🧠 My Contrarian Thesis While this might sound crazy, I believe we are still in the OPTIMISM phase of this rally. Unlike previous cycles, I believe we will experience an extended rally lasting through Q1/Q2 2026. My Thesis is NOT Based On: ❌ Traditional Halving Cycle Theory — I believe that timeline will be extended and recalibrated this time ❌ Stock-to-Flow (S2F) Alone — Though I lean toward its supply dynamics My Thesis IS Based On: ✅ Pure naked price action and structure ✅ Volume profile analysis showing accumulation ✅ Market structure and RSI positioning ✅ Government liquidity mechanics and TGA dynamics ✅ Institutional vs retail behavior divergence ✅ Psychological playbook of market cycles ──────────────────────────────────── 🔄 Why the Halving Cycle Is Extended, Not Broken Many are saying "the 4-year cycle is dead." I disagree. It's not broken—it's being distorted and extended by new factors: The ETF Factor Changed Everything: Traditional Halving Cycle: Post-halving scarcity → slow accumulation → parabolic phase ~500-550 days later 2024-2025 Cycle: January 2024: Spot BTCUSD ETFs approved ETFs brought forward typical post-halving demand 12 months early This created an early rally into March 2024, then consolidation October 2025: Temporary ETF panic outflows (weak hands exit) Framework : The cycle hasn't ended—it's been stretched across a longer timeframe Historical Context: Historically, most significant price appreciation occurred between days ~500-550 post-halving For the April 2024 halving, that window ends Q3 2025 ... but if we factor in the time lag and the now running ~2-Months Govt shutdown delay then that window could be adjusted to Q3 2025 - Q1 2026 See it like a football match, time delay during match is added as extra time, it doesn't mean the 90min rule is broken simply means wasted time must be accounted for. We're literally in the window right now Expert Analysis: Leading analysts suggest the era of the strict 4-year cycle is evolving Market maturity, institutional concentration, and dampened volatility mean the traditional rhythm is being replaced by liquidity-sensitive, macro-correlated behavior The cycle isn't gone—it's adapting to a new market structure ──────────────────────────────────── 📈 The Current Chart Breakdown Look at the Chart Again: 👉 Four Critical Questions: 1. Does this move look like a completed rally? → No. It looks like mid-cycle consolidation with a violent shakeout. 2. Does the recent ATH reflect a distribution top? → No. Volume and RSI don't support distribution behavior. The ATH was a brief spike , not a prolonged distribution phase. 3. What does the volume profile show? → Accumulation zone. Heavy volume during the $95K-$110K range indicates re-accumulation, not distribution. 4. What is the RSI telling us? → Sitting on base support —the same level that triggered every prior bull market explosion in this cycle. Conclusion: If both price action and volume show accumulation rather than distribution, we're in a re-accumulation phase, not a post-rally distribution phase. ──────────────────────────────────── 🎯 The Macro Setup BTC is Positioned Perfectly: ✅ Inside the macro demand zone that has held since late 2023 ✅ On the ascending channel that guided every major leg of this cycle ✅ Channel from 2023 is intact and pointing into six-figure territory ✅ Weekly demand zone holding with precision — re-accumulation, not distribution ✅ Weekly RSI on base support — same level that triggered every bull explosion ✅ Nothing is broken. Nothing is topping. This is positioning, not exhaustion. ──────────────────────────────────── I shared this analysis yesterday, you can read the full or the summarized version below: 📅 Cycle Structure: The 14-15 Week Expansion Pattern Every expansion leg in this cycle has followed a pattern: 14-15 weeks of expansion Followed by 16-18 weeks of correction Where Are We Now? End of the correction window Beginning of the next expansion phase Historical Precedent: If we follow 2017's pattern (euphoric Nov-Dec Rally) where BTC gained +200% in price between Nov 17 -Dec 17 from 5.6k+ to 19.6k+, we could see an explosive acceleration starting from Next week Mid-November - December 2025 With institutional adoption and extended liquidity cycles, this could push into Q1 2026 This would make the current cycle the longest on record , not the end of one ──────────────────────────────────── 🔥 What the Chart Is Screaming Key Technical Signals: Ascending Channel Intact — Channel from late 2023 still pointing to six figures Demand Zone Holding — Weekly demand zone defended with precision Breakout Level Clear — $126K break = ignition point for macro acceleration RSI Base Support — Weekly RSI at the exact level that preceded every rally Projection Untouched — Path to $150K–$170K remains structurally intact ──────────────────────────────────── 🚀 Two Scenarios Moving Forward Scenario 1: Direct Blast-Off ⚡ Demand zone holds firm here Government shutdown ends → liquidity snap-back $126K breaks decisively within weeks New ATH confirmed Vertical acceleration into $150K–$170K by December 2025 Extended rally continues through Q1 2026 Scenario 2: One Final Manipulation Flush 🌊 Wick below demand zone (liquidity grab to $95K-$98K) Mid-channel tap for final shakeout Violent V-shaped recovery and reclaim Same ultimate target: $160K–$170K Timeline delayed by 4-8 weeks but destination unchanged Both scenarios end at the same place. The path differs, but the structure remains intact. ──────────────────────────────────── ❌ The Only Invalidation I will abandon this thesis if: Primary Invalidation: Weekly close below the ascending channel (currently ~$80K) Secondary Warning Signals: TGA doesn't release liquidity when government reopens Institutional ETF outflows continue for 2+ consecutive months Fear & Greed Index stays below 30 through EOY 2025 BITCOIN fails to reclaim $110K by end of November 2025 Weekly RSI breaks below 40 and stays there Until these conditions are met, the bull thesis remains structurally intact. ──────────────────────────────────── 💡 The Liquidity Snap-Back Thesis Here's the mechanism most traders are missing: How Government Shutdowns Affect Crypto: Phase 1: Shutdown (October 1 - Present) Government stops spending TGA balance grows ($800B → $1T+) Liquidity drained from system Dollar shortage (SRF at $50B+) Risk assets crash Phase 2: Reopening (Coming Soon) Government resumes spending TGA balance depletes back down $200B+ floods back into system Dollar shortage resolved Risk assets rally violently BTCUSD 0.85 correlation with dollar liquidity means: When liquidity drains → Bitcoin falls When liquidity returns → Bitcoin rips This isn't speculation—it's mechanical. The October crash was a liquidity event, not a sentiment event. When that liquidity returns, BTC will respond proportionally. ──────────────────────────────────── 📊 Why October's Liquidation Was Different From Bear Markets Let's compare major crypto crashes: The Critical Difference: Previous crashes: Spot holders capitulated October 2025: Spot holders accumulated while leveraged traders got wiped out This is cleansing, not capitulation. ──────────────────────────────────── 🎨 Compare: What a Real Bull Market Top Looks Like Signs of a Cycle Top We DON'T Have: ❌ Fear & Greed Index at 90+ for weeks ❌ RSI pinned above 75 ❌ Parabolic vertical price action ❌ "Bitcoin is going to $1 million" headlines everywhere ❌ Taxi drivers and hairdressers asking about crypto ❌ Massive miner selling at highs ❌ Whales distributing to retail ❌ Everyone you know is suddenly a crypto expert ❌ Cover stories on TIME, Forbes, Bloomberg ❌ New ATHs multiple weeks in a row Signs of Mid-Cycle Correction We DO Have: ✅ Fear & Greed at 21 (Extreme Fear) ✅ RSI at 46 (neutral to oversold) ✅ Choppy consolidation in range ✅ "Bull market is over" narratives everywhere ✅ Retail giving up and selling ✅ Whales accumulating quietly ✅ Liquidation event clearing out leverage ✅ Volume profile showing accumulation ✅ Market despair and hopelessness We're not at a top. We're in the middle of the game. ──────────────────────────────────── 💰 Why I'm All In In my last post I said I went ALL IN on BITCOIN and my selected alts. (after earlier shorting around 120k and sitting on cash) Not because I'm reckless. Not because I'm ignoring risk. But because: The macro structure is intact The demand zone is holding RSI is at historical launch support Volume shows accumulation, not distribution No euphoria has occurred yet The chart does not reflect a completed bull market Government liquidity will return mechanically Largest liquidation in history = weak hands removed Institutional holders aren't selling We're in the historical extended post-halving window This is structure. This is patience. This is conviction based on data. ──────────────────────────────────── 🙏 Final Thoughts I know many of you are hurting right now. I know hope feels dangerous. But look at the data objectively: October was the largest forced liquidation in history—not organic selling The government shutdown created a temporary liquidity vacuum Zero signs of euphoria anywhere in the market Institutional holders and whales are accumulating The chart structure shows mid-cycle correction , not cycle top Sometimes, the best opportunities come when: Everyone is bearish The crowd has capitulated Fear is at its peak And the chart is quietly building the foundation for the next explosive leg This is not hopium. This is structure. This is the setup. The Golden Bull Run hasn't even started breathing yet. We're not at the end— we're at the reset point before the real parabolic phase. ──────────────────────────────────── 📌 Key Levels to Watch Support Levels: Primary Demand Zone: $98K - $104K (current position) Mid-Channel Support: $90K - $95K Critical Invalidation: $85k-$90K (weekly close) Breakout Levels: Ignition Point: $126K (previous ATH) Confirmation: $130K (weekly close above) Targets: Conservative: $150K - $160K (Q2 2025) Base Case: $170K - $180K (Q3 2025) Extended Cycle: $200K+ (Q4 2025 - Q2 2026) Timeline Checkpoints: End of November 2025: Reclaim $110K December 2025: Break $126K and establish new ATH Q1 2026: Parabolic acceleration phase and potential cycle peak(extended thesis) ──────────────────────────────────── 🎯 What Would Make Me Change My Mind? I will publicly update and reassess if: Weekly close below $85k-$90K (channel break) TGA remains elevated 4+ weeks after shutdown ends Institutional ETF outflows persist through December RSI breaks and holds below 40 Fear & Greed stays below 30 through Q1 2026 Failure to reclaim $110K by November 31, 2025 I'm bullish, but not blind. The market will tell us if the thesis breaks. ──────────────────────────────────── 🔚 Bottom Line This bull market isn't slowing down—it's resetting for the real parabolic phase. BTC is gearing up for expansion, and alts will follow with the delayed but inevitable altseason wave. This next 12-18 months is where: Generational wealth is made or missed The real euphoria begins The masses FOMO in—not out The chart finally looks like a bull market Don't let October's liquidation event fool you into thinking this is over. The chart says accumulation. The structure says intact. The liquidity says temporary. The sentiment says despair. That's not a bear market— that's the setup for the next leg. 🐂🔥 ──────────────────────────────────── Not financial advice. This is my personal analysis based on current data. Markets are unpredictable. Trade responsibly. Manage your risk. Do your own research. If you found this analysis valuable, feel free to boost/share. Let's see who's still standing when BITCOIN crosses $150K. ────────────────────────────────────
niclaxfx
بیت کوین مرده نیست! راز انفجار بزرگ بعدی و شروع سیزن آلتکوینها
Patlamadan Önce Her Şey: Bitcoin'in Sonraki Ayağı ve Gelen Alt Sezon Dalgası Bir kez daha ben HEPSİ İÇİNDE açık BITCOIN ve birkaç seçilmiş ALTS. Boğa piyasası DEĞİL bitti. 🔥Altsezon ısınmaya bile başlamadı ve bu henüz başlamadı hopyum ... İşte ham makro gerçek grafik bağırıyor: BTCUSD içinde temiz bir şekilde oturuyor makro talep bölgesi Hala bu döngünün her major ayağını taşıyan yükselen kanalda ilerliyoruz Üst yok. Arıza yok. Zayıflık yok. bu konumlandırma yorgunluk değil. ⏱ Döngü Yapısı: • Her genişletme ayağı: 14–15 hafta 📈 • Her düzeltme: 16–18 hafta 📉 Düzeltme penceresinden çıkıyoruz (10 Kasım'da sona eriyor🗓️)→ bir sonraki genişleme aşamasına giriyoruz. 📊 Grafiğin doğruladığı şey: • Ocak 2024'ten itibaren uzun vadeli kanal hala sağlam → trend altı rakama işaret ediyor. • Haftalık talep bölgesi kontrollü olarak hareket ediyor yeniden birikim , dağıtım değil. • Tetiği temizle: yukarıya doğru kırılma 126 bin dolar → makro ateşleme. • Haftalık RSI bekleniyor taban desteği ⚫ → her major bacak kaldırmadan önceki seviyenin aynısı. • Bu döngü için hala yüksek zaman dilimi hedefi 150 bin dolar – 170 bin dolar →220k+'ya kadar parabolik 🎯 • Birim profili gösterileri birikim dağıtım değil 🎯 📝 Senaryolar: 1️⃣ Doğrudan Patlama 🚀 Talep bölgesi korunuyor → 126 bin dolar kırılma → yeni ATH → trend hızlanıyor 160 bin dolar – 170 bin dolar. 2️⃣ Manipülasyon Yıkama 🩸 Talebin altında fitil (90 bin dolara ani çöküş) → kanal ortası dokunuş → şiddetli geri alma → aynı nihai hedef. ❌ Geçersiz kılma: Sadece haftalık kapanış kanalın altında yapıyı öldürür. Nothing Else Matters. ✅ Özet: Bu boğa piyasası soğumuyor yeniden yükleniyor . Bitcoin bir sonraki genişleme dalgasına hazırlanıyor ve alternatifler bunu gecikmeli, şiddetli ve kaçınılmaz bir şekilde takip edecek altsezon. Bir sonraki bacak nerede kuşak girişleri ya ödersin ya da pişman olursun. Benim bahisim açık BITCOIN seninki nerede? Yasal Uyarı: Bu analiz yalnızca eğitim amaçlıdır ve finansal tavsiye olarak değerlendirilmemelidir. Geçmiş performans gelecekteki sonuçları garanti etmez. Yatırım kararları vermeden önce her zaman kendi araştırmanızı yapın ve finans profesyonellerine danışın. Daha düşük zaman dilimleri (H8/H4), makrodaki 16 haftalık düzeltmenin sonu ile mükemmel bir şekilde sıralanarak temiz bir çift dip gösterir. Eğer bu yapı hafta sonuna (10 Kasım) kadar kırılırsa, muhtemelen yukarıya doğru 5 dalgalı bir Elliott ivmesinin başlamasını tetikleyecek. Yakından izliyorum — Önümüzdeki ilginç hafta✌🏾.
niclaxfx
سقوط آزاد طلا (XAU/USD): آیا حمایت حیاتی 3986 دلار شکسته میشود؟
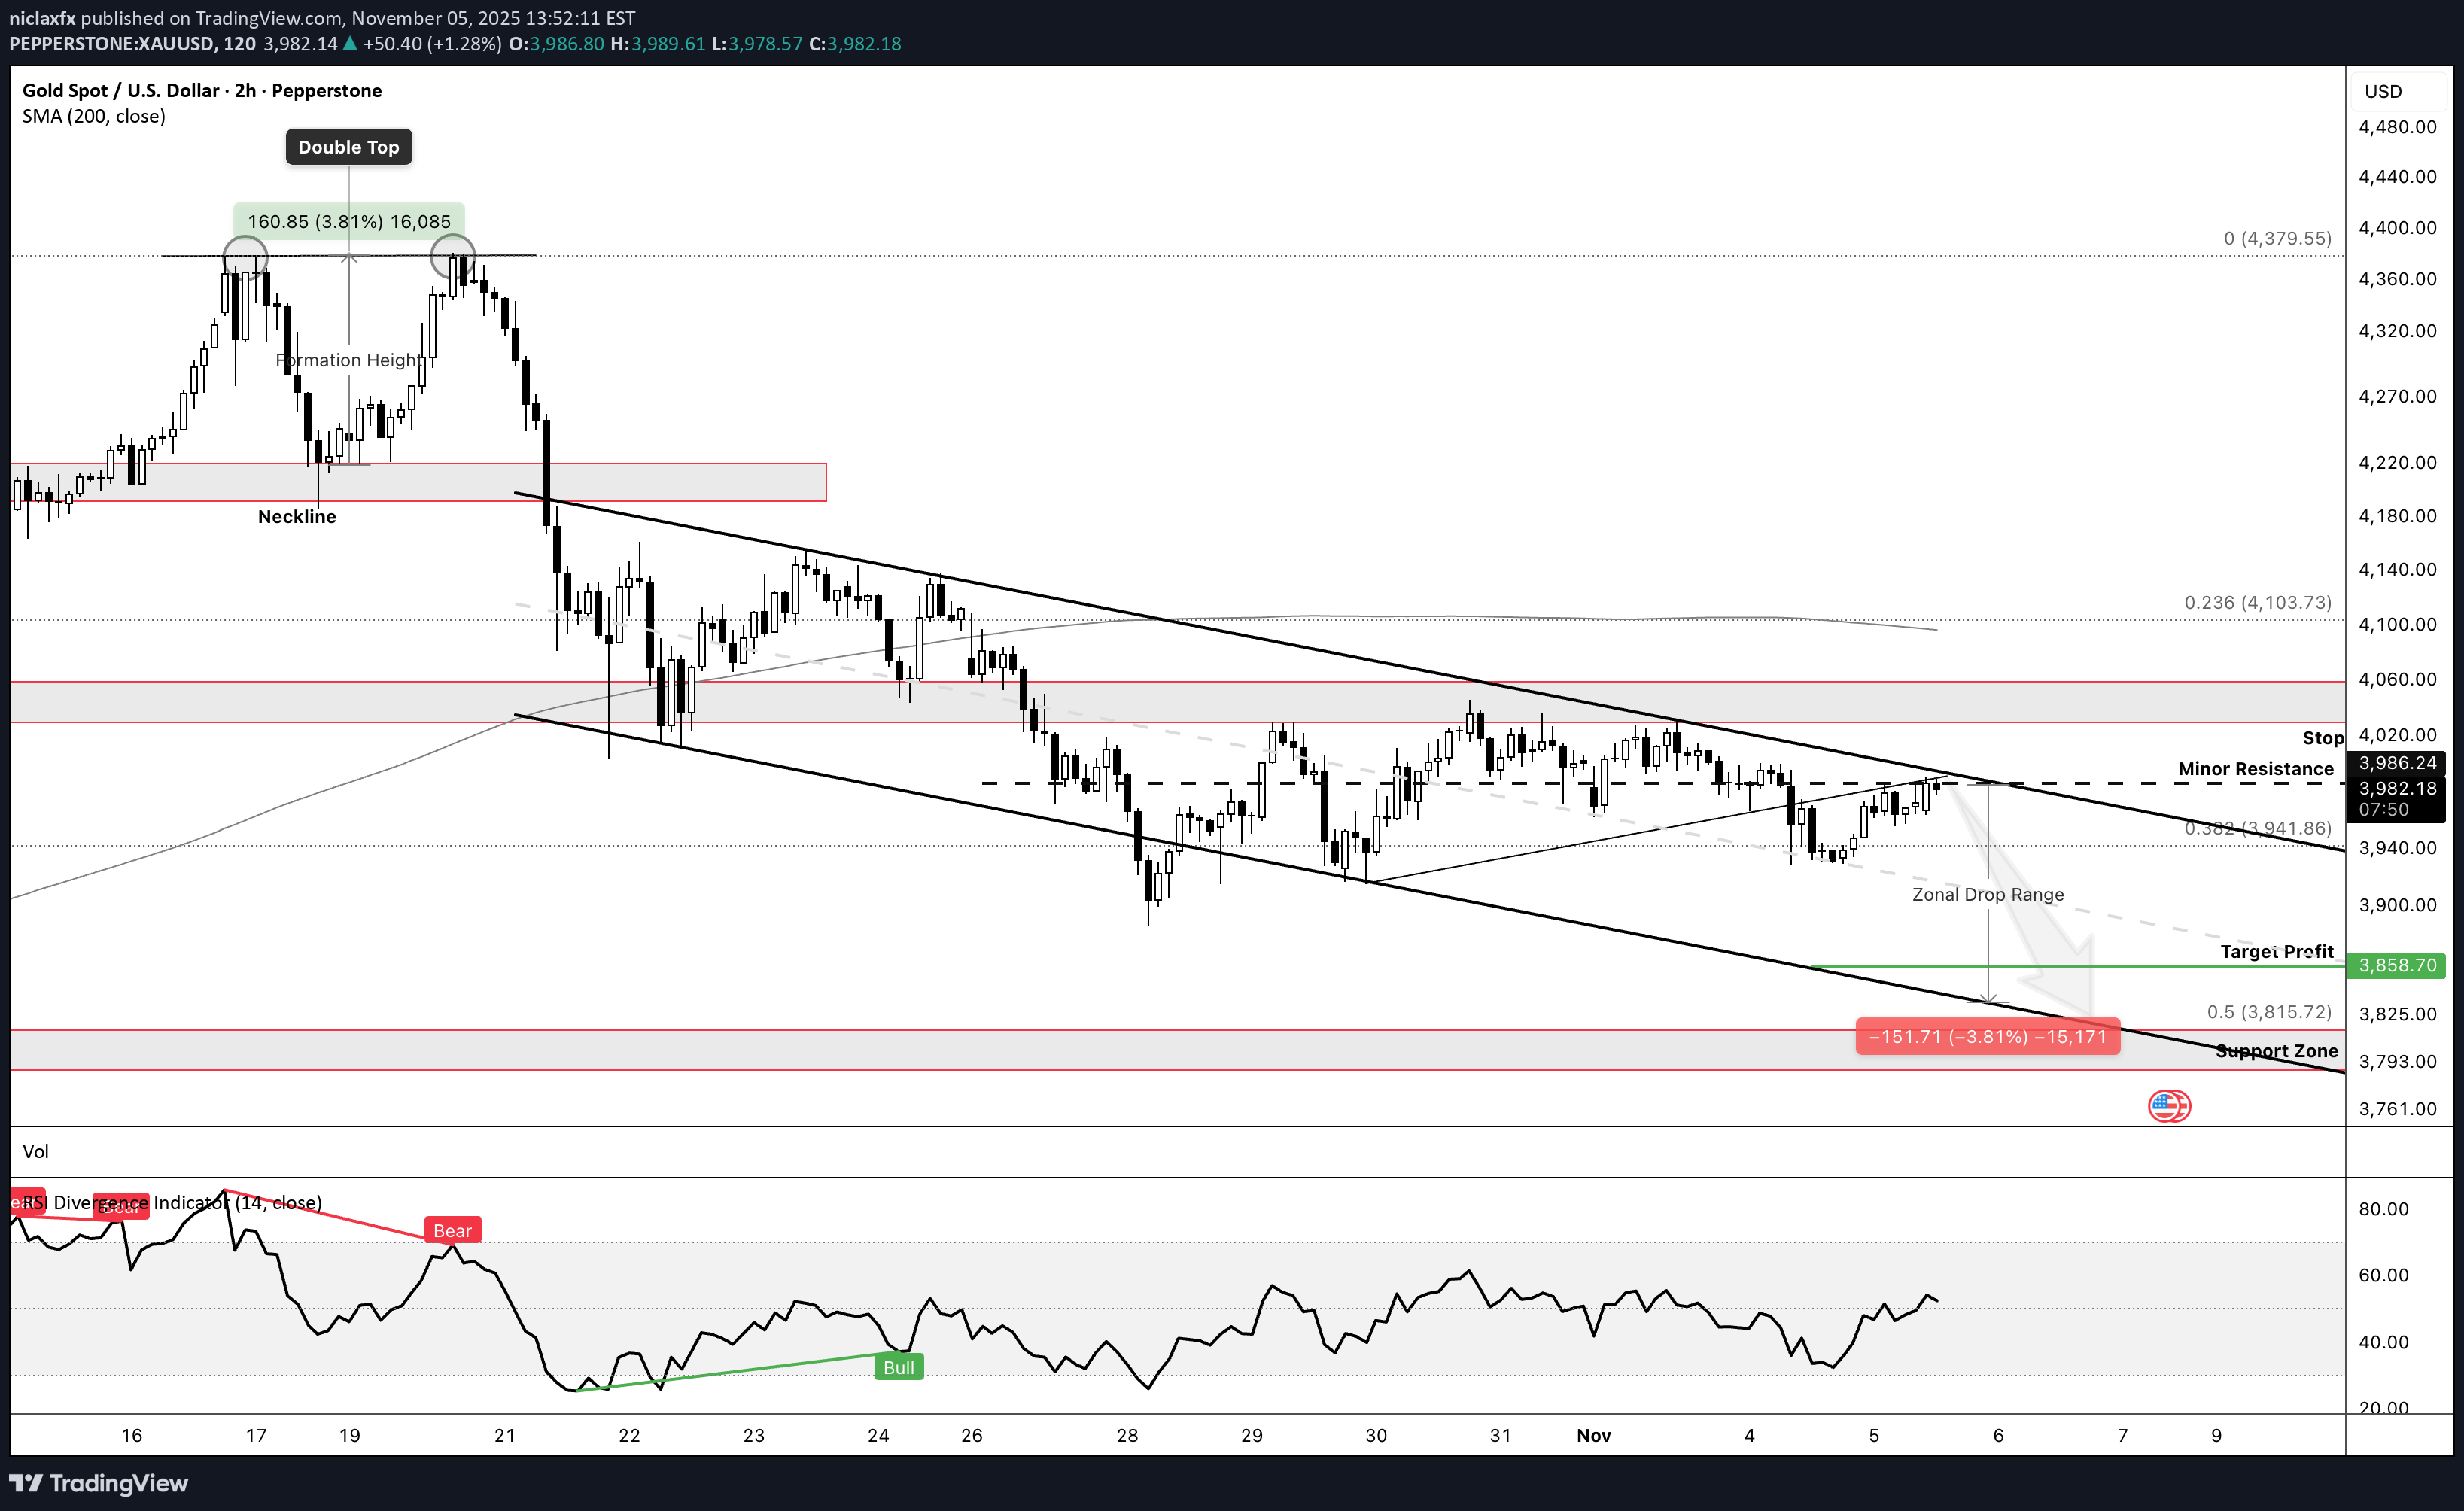
ALTIN 4.380 dolarda ağır bir zirveye ulaşırken, boyun çizgisi 4.200 ila 4.190 dolar civarında kırıldı - klasik Çift Tepe formasyonu. O zamandan beri alçalan bir kanalın içinde kan akıyor ve her sıçrama baskı altında öldü. sand ⚔️'daki çizgi 3.986 dolar — fiyat aşağıda kaldığı sürece ayılar tam kontrolde. Hala satıcıların her baskıya devam ettiği Bölgesel Düşüş Aralığında (3.986 $ – 3.825 $) işlem yapıyoruz. 🎯 Hedefler: TP1 → 2920$ (%38,2 fib) TP2 → 3.858 $ TP2 → 3.790 ABD Doları–3.760 ABD Doları (Destek Bölgesi) 🧠 Kurulum: 3.980$ ile 3.990$ arasındaki kısa retler. 4.040 doların üzerinde stop – bu seviyenin üzerindeki herhangi bir kapanış, oyunu iptal eder ve 4.103 – 4.160 dolara doğru alan açar. 📉 RSI: 51 civarında düşüş yönünde nötr. 📊 Hacim: Kurutma = bir sonraki düşürmeden önce düdüklü tencerede. Boğalar 4.040 doları geri alana kadar sadece şort avlayacağım. 3.986 doların altında hızlanma bekliyoruz; 3.858 dolara doğru likidite boşluğu, belki de 3.790 dolara tam bir akış. Keskin kalın, sabırlı kalın 💚.
niclaxfx
ریتم مخفی بیت کوین: پیشبینی مسیر صعودی تا ۱۶۰ هزار دلار (۱۲۰ هزار کلید است!)

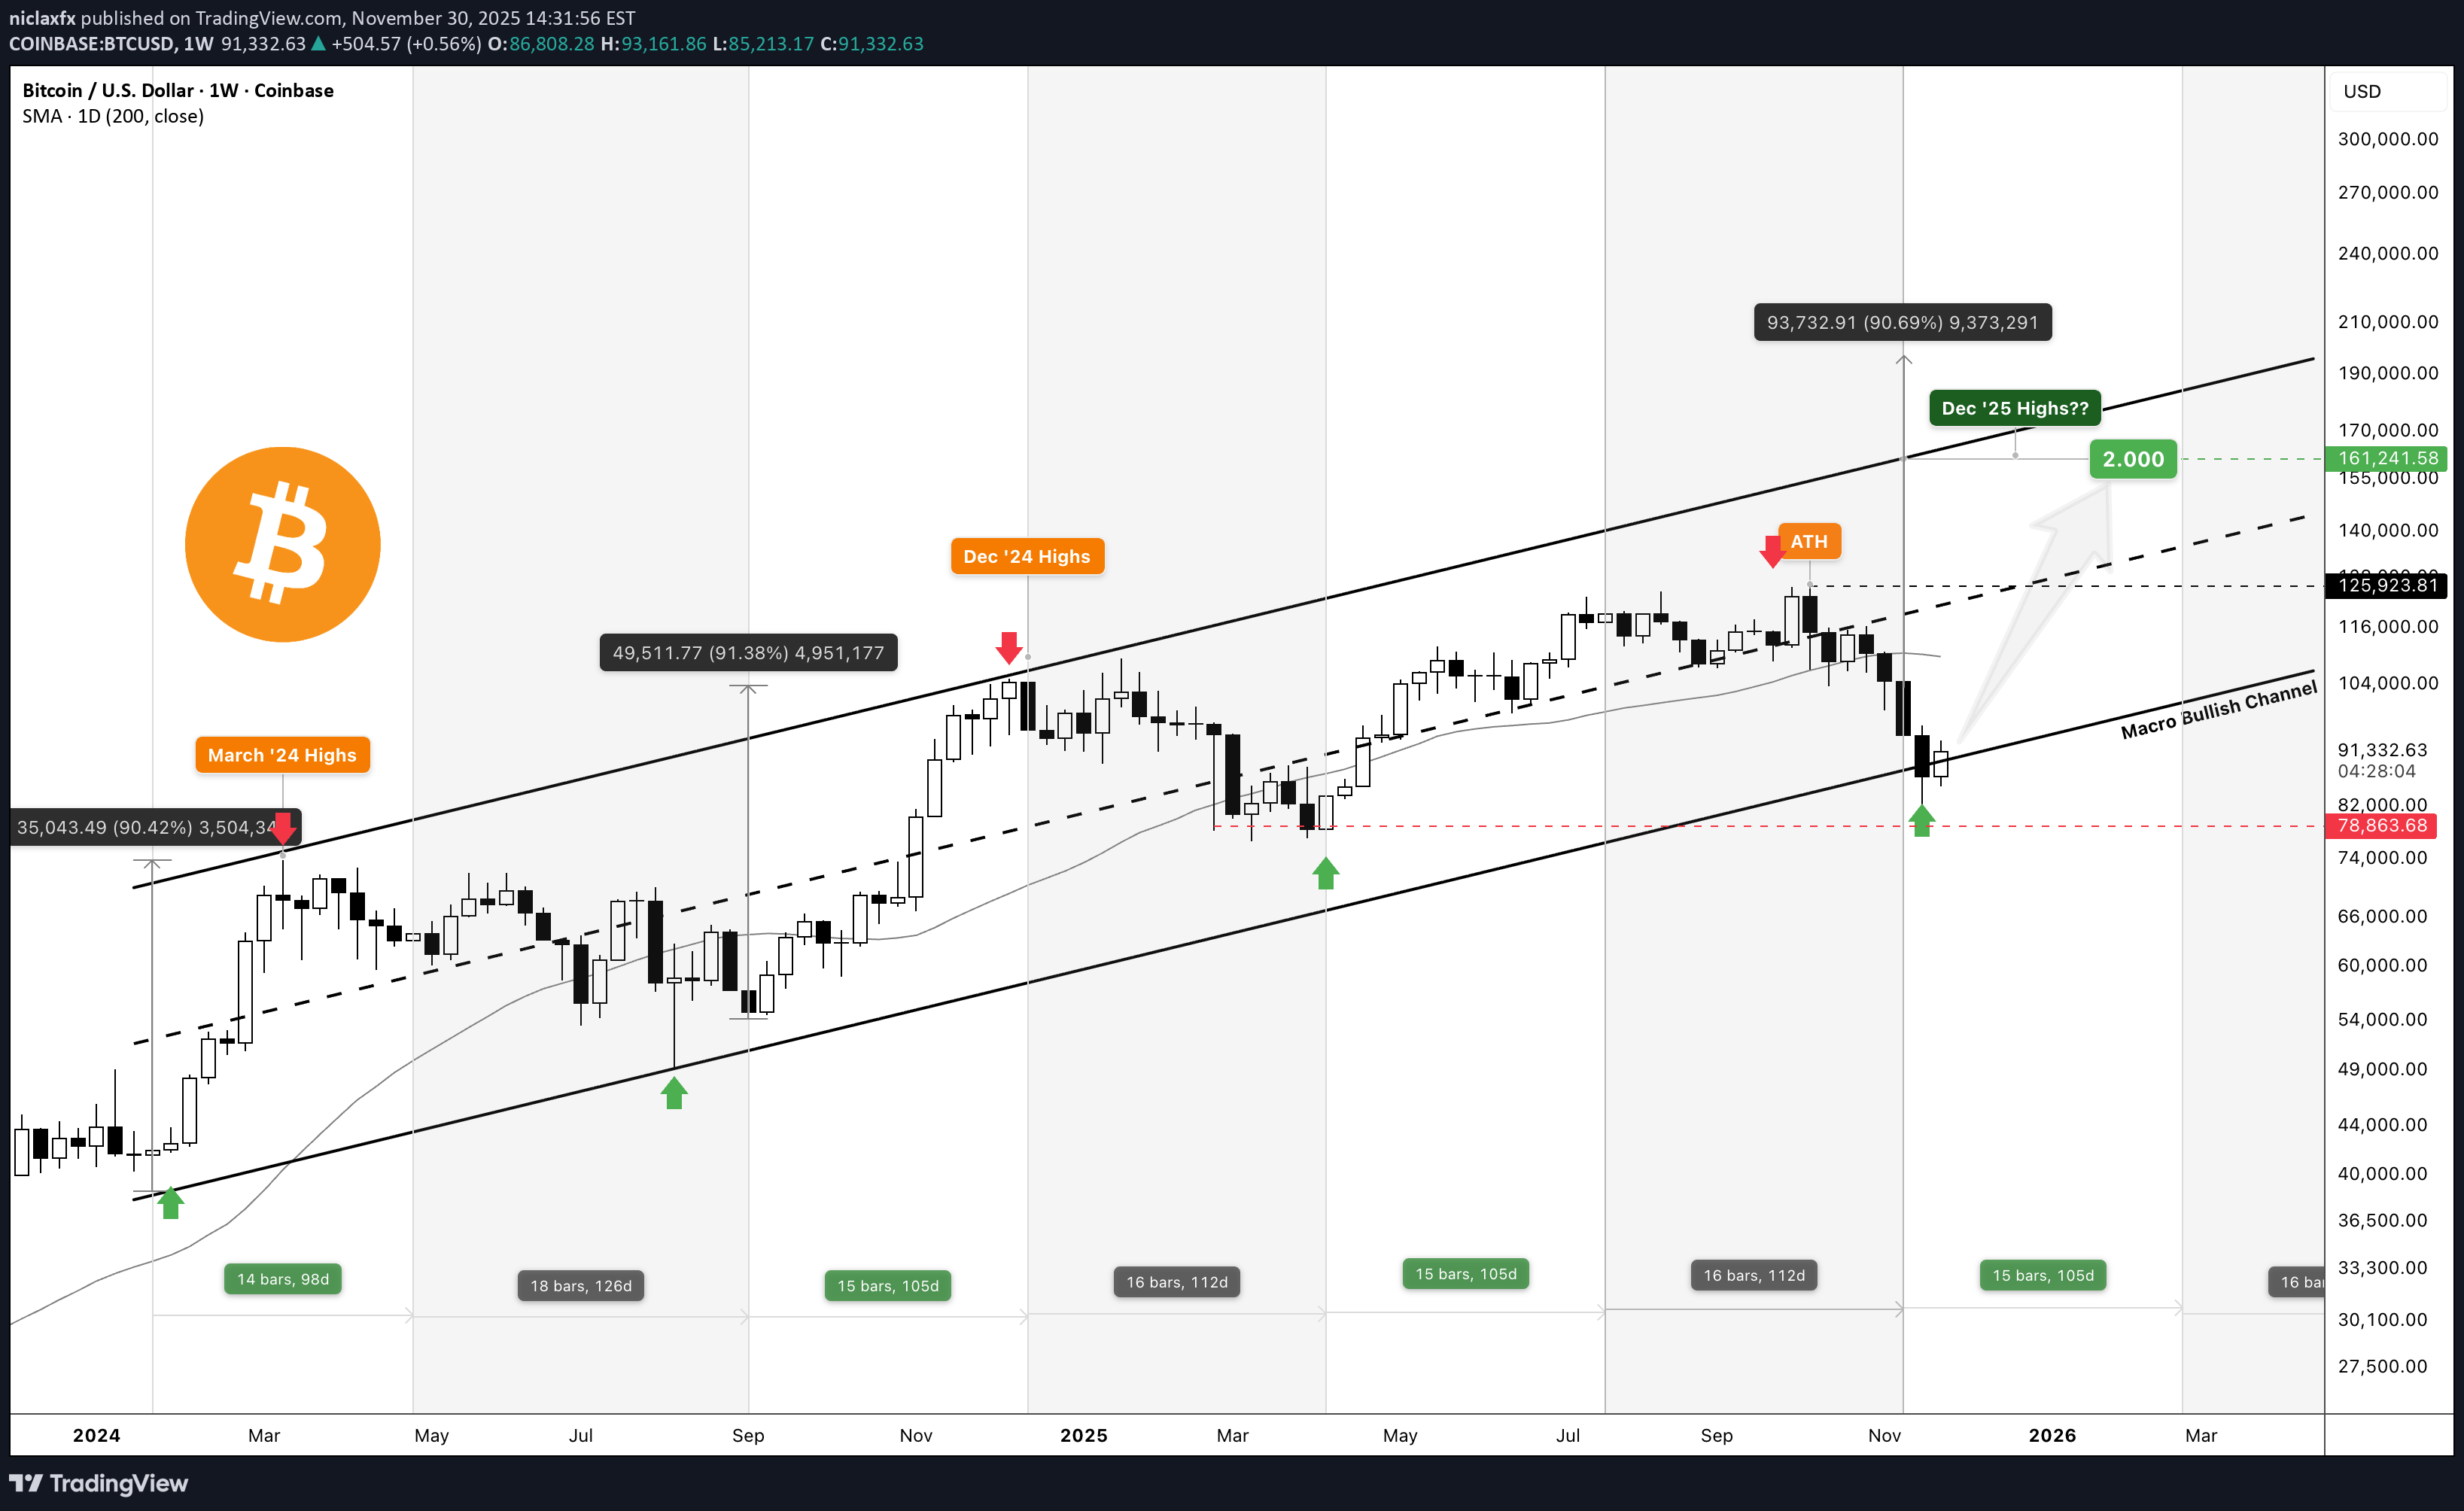
Bitcoin ritimle hareket eder - rastgele değil, umursamaz değil, uyumlu. Her yükseliş ve geri dönüş, kendi geçmişinden bir melodi gibi çalıyor, ve bir kez daha grafik o tanıdık melodiyi mırıldanıyor. Dokunduktan sonra 126K , fiyat geri çekildi, test edildi 120K desteği , ve temiz bir şekilde sıçradı; bu ritmin hala sağlam olduğunun bir işareti. ATH–SR bölgesi (120K–124K) artık pivot görevi görüyor, Başka bir Kasım ayı tekrarı için ivmenin arttığı yer. Bu aralığın üzerinde sonraki notalar aynı hızda çalınır. 138K, 147K, ve muhtemelen 160.000+ tempo Kasım 24 – Aralık 24, şimdi Ekim 25 – Kasım 25 gibi akıyorsa. Ancak bu vuruş bozulursa 108K ritmin temeli olarak kalır. BTCUSD move sadece fiyat olarak değil, aynı zamanda kalıplar halinde de hareket eder. Gürültüyü değil ritmi dinleyin. -Klaus | NFX Merkezi 💚 ----------------- Kritik zamanlarda bile, biraz oynamakta sorun yok...📝 TL;DR: 🟠 120K–124K pivot bölgesidir. 📈 Yukarıda tutun = 138K, 147K, 160K+'yı hedefler. 📉 Aşağı kırılma = 108K yeniden test. 📆 Desen Kasım '24'e uygundur ancak esnek kalın.
niclaxfx
بیت کوین در 123 هزار دلار: آیا گاوها یا خرسها پیروز میشوند؟ راز مقاومت سهگانه فاش شد!

Price şimdi 123k direnç bölgesini üç kez test etti. Üçüncü denemede, ret yerine absorpsiyona işaret eden sığ bir koparma gördük - satıcıların ince çalışabileceğine dair bir işaret ((aralarında, lol oldum). Şimdi, tüm gözler 123k tekrar testinde-potansiyel makyaj ya da kırılma pivotu. Bu seviye desteklemeye dönerse, boğalar 129.700'de bir sonraki FIB uzantısına doğru gidebilir. Ancak seviye yol verirse, muhtemelen 117k - 118.5k taban bölgesine geri döneriz. Anahtar seviyeleri 🔴 Direnç Bölgesi: 122.500 - 124.500 🟢 Hedef: 129.700 (FIB Ext 1.272) ⛔️ Geçersiz kalma: 122.000'in altında 🔵 Temel Destek: 117.000 - 118.500 📝 Tez: Üçlü testler tedarik bölgelerini zayıflatma eğilimindedir. Sığ koparma, tükenme yerine birikim önerir. Alıcılar 123k tutamağı savunursa onay gelir - Flips ivmeyi aşağı yönde geri tutamaması. Tl; dr: Üçlü Direnç Testi → Sığ Breakout → Oyundaki Yeniden Test. 123k pivot. Bekle = 129.700. Başarısız = tabana dön. ⚠story anlatacaktır.
niclaxfx
طلا در منطقه حساس: تصمیم سرنوشتساز هفته آینده برای قیمت چیست؟

ALTIN Etkileyici yükseliş yapısını sürdürür, önceki tüm direnç bölgelerinden temiz bir şekilde tırmanır. Her genişleme aşaması ölçülmüş ve tutarlı - ~% 1.7 dürtüsel bacaklar ve ~% 4.4 düzeltici genişlemeler arasında değişerek, perakende oynaklıktan ziyade kontrollü kurumsal flow yansıtan ritmik bir fiyat davranışı oluşturur. Fiyat şu anda Bölge 4'te çalışıyor ve 3.987 $ - 3.990 $ direnç hedefine yaklaşıyor. Bu seviye, mevcut genişleme aralığının üst sınırı ile uyumludur ve onu kritik bir karar noktası haline getirir. Price Eylül ayında gözlemlenen aynı tarihsel ritmi takip ederse, 3.987 $ 'lık bir musluk görme olasılığı yüksek bir olasılık ve ardından herhangi bir devam denemesinden önce 3.914 $' a (bölge desteği) doğru bir geri çekilme görme olasılığı var. Bununla birlikte, şu anda somut U. Ekonomik data Yakıt yönlü mahkumiyetine açıklar. Bu, buradaki momentumun büyük ölçüde teknik olarak yönlendirildiği ve daha geniş bir eğilim değişiminden önce altın için son aşamayı işaretleyebileceği anlamına gelir. Anahtar Not: Birincil önyargı: Boğa devamı, 3.900 doların üzerinde iken geçerli olmaya devam etmektedir. Price'ın 3987'ye ulaşmasını ve daha sonra mümkün olan 3914'e geri çekilmesini bekliyorum. Cilt sabit kalır, ancak öforik değil - geç FOMO'dan ziyade disiplinli birikimi sinyal verir. Çözüm: ALTIN Yapı sağlam kalır, ancak pazar bir karar bölgesine girer. Bir sonraki move Buradan 24-48 saatlik pencerede, muhtemelen son bir uzantıya tanık olduğumuzu veya daha derin bir düzeltmenin başlangıcına tanık olduğumuzu belirleyecektir. 💭 Bu ticareti takip ediyorsanız aşağıdaki düşüncelerinizi paylaşın.
niclaxfx
ریزش بیت کوین در راه است؟ تحلیل فنی و ماکرو که نباید نادیده گرفت!

📝Thesis: Sadece kısa bir yere girdim Btcusd Teknik ve makro sinyallerin birleşmesine dayanmaktadır. Bu sadece aşırı alımlı RSI değil - asimetrik risk, aldatıcı yükseliş yapısı ve çoğu tüccarın göz ardı ettiği daha geniş bir düşüş alt tonuyla ilgili. 📉 Kurulum dökümü RSI (H4): 85.12 - Son derece fazla alım. Tarihsel olarak, bu bölge keskin geri çekilmeleri tetikledi. Grafikte “ayı” olarak işaretlenen önceki RSI zirveleri paterni doğrular (Temmuz, Ağustos 2025). 📊 Grafik yapısı: Yükselen kama yaklaşan STR direnç bölgesi + 78.6 fib seviyesi. Fiyat eylemi bitkin görünüyor ve hacim soluyor. 🌐 Makro önyargısı: Yerel yükseliş ivmesine rağmen, daha geniş eğilim düşüş olarak kalır. Kredi marjları genişliyor ve makro likidite sıkılıyor. Risk-Off Tonu sürünüyor. RR RR Profil: ATH sadece ~ 4K $ yukarıda. Dezavantaj hedefleri daha sıkı geçersiz kılma ile daha temiz ödül bölgeleri sunar. STR bölgesinin hemen üzerine yerleştirin. 🎯 Ticaret parametreleri ✅ Giriş: Yakın STR Direnç Bölgesi ⛔️ Durmak: Üst trend çizgisi / STR bölgesinin üstünde 🟠 Hedef 1: Orta Kanal Desteği 🟢 Hedef 2: Alt FIB Konfluence Bölgesi 🧠 Makro kaplama U. S. Kredi marjları genişliyor (%2,75 oranında hy endeks, CDS yayılıyor). Devletin kapatma riski artıyor. Fed risk yönetimi modundadır - henüz panik değil, ton değişiyor. Ekim tarihsel olarak değişkendir (bkz. 2008 Analogları) - likidite stresini izleyin. ⚠️ TL; DR Kısa süre Btcusd İşte sadece teknik değil, stratejik. Aşırı Alımlı RSI + Bearish Wedge + Makro Stres = Asimetrik Kurulum. Risk sınırlıdır, ödül temizdir. Bakalım nasıl oynuyor.
Sorumluluk Reddi
Sahmeto'nun web sitesinde ve resmi iletişim kanallarında yer alan herhangi bir içerik ve materyal, kişisel görüşlerin ve analizlerin bir derlemesidir ve bağlayıcı değildir. Borsa ve kripto para piyasasına alım, satım, giriş veya çıkış için herhangi bir tavsiye oluşturmazlar. Ayrıca, web sitesinde ve kanallarda yer alan tüm haberler ve analizler, yalnızca resmi ve gayri resmi yerli ve yabancı kaynaklardan yeniden yayınlanan bilgilerdir ve söz konusu içeriğin kullanıcılarının materyallerin orijinalliğini ve doğruluğunu takip etmekten ve sağlamaktan sorumlu olduğu açıktır. Bu nedenle, sorumluluk reddedilirken, sermaye piyasası ve kripto para piyasasındaki herhangi bir karar verme, eylem ve olası kar ve zarar sorumluluğunun yatırımcıya ait olduğu beyan edilir.