sembol BTC hakkında analiz Teknik niclaxfx: Satın al (08.11.2025) önerilir

niclaxfx
سقوط بیت کوین توهم بود؟ چرا رالی طلایی واقعی تازه شروع نشده است!
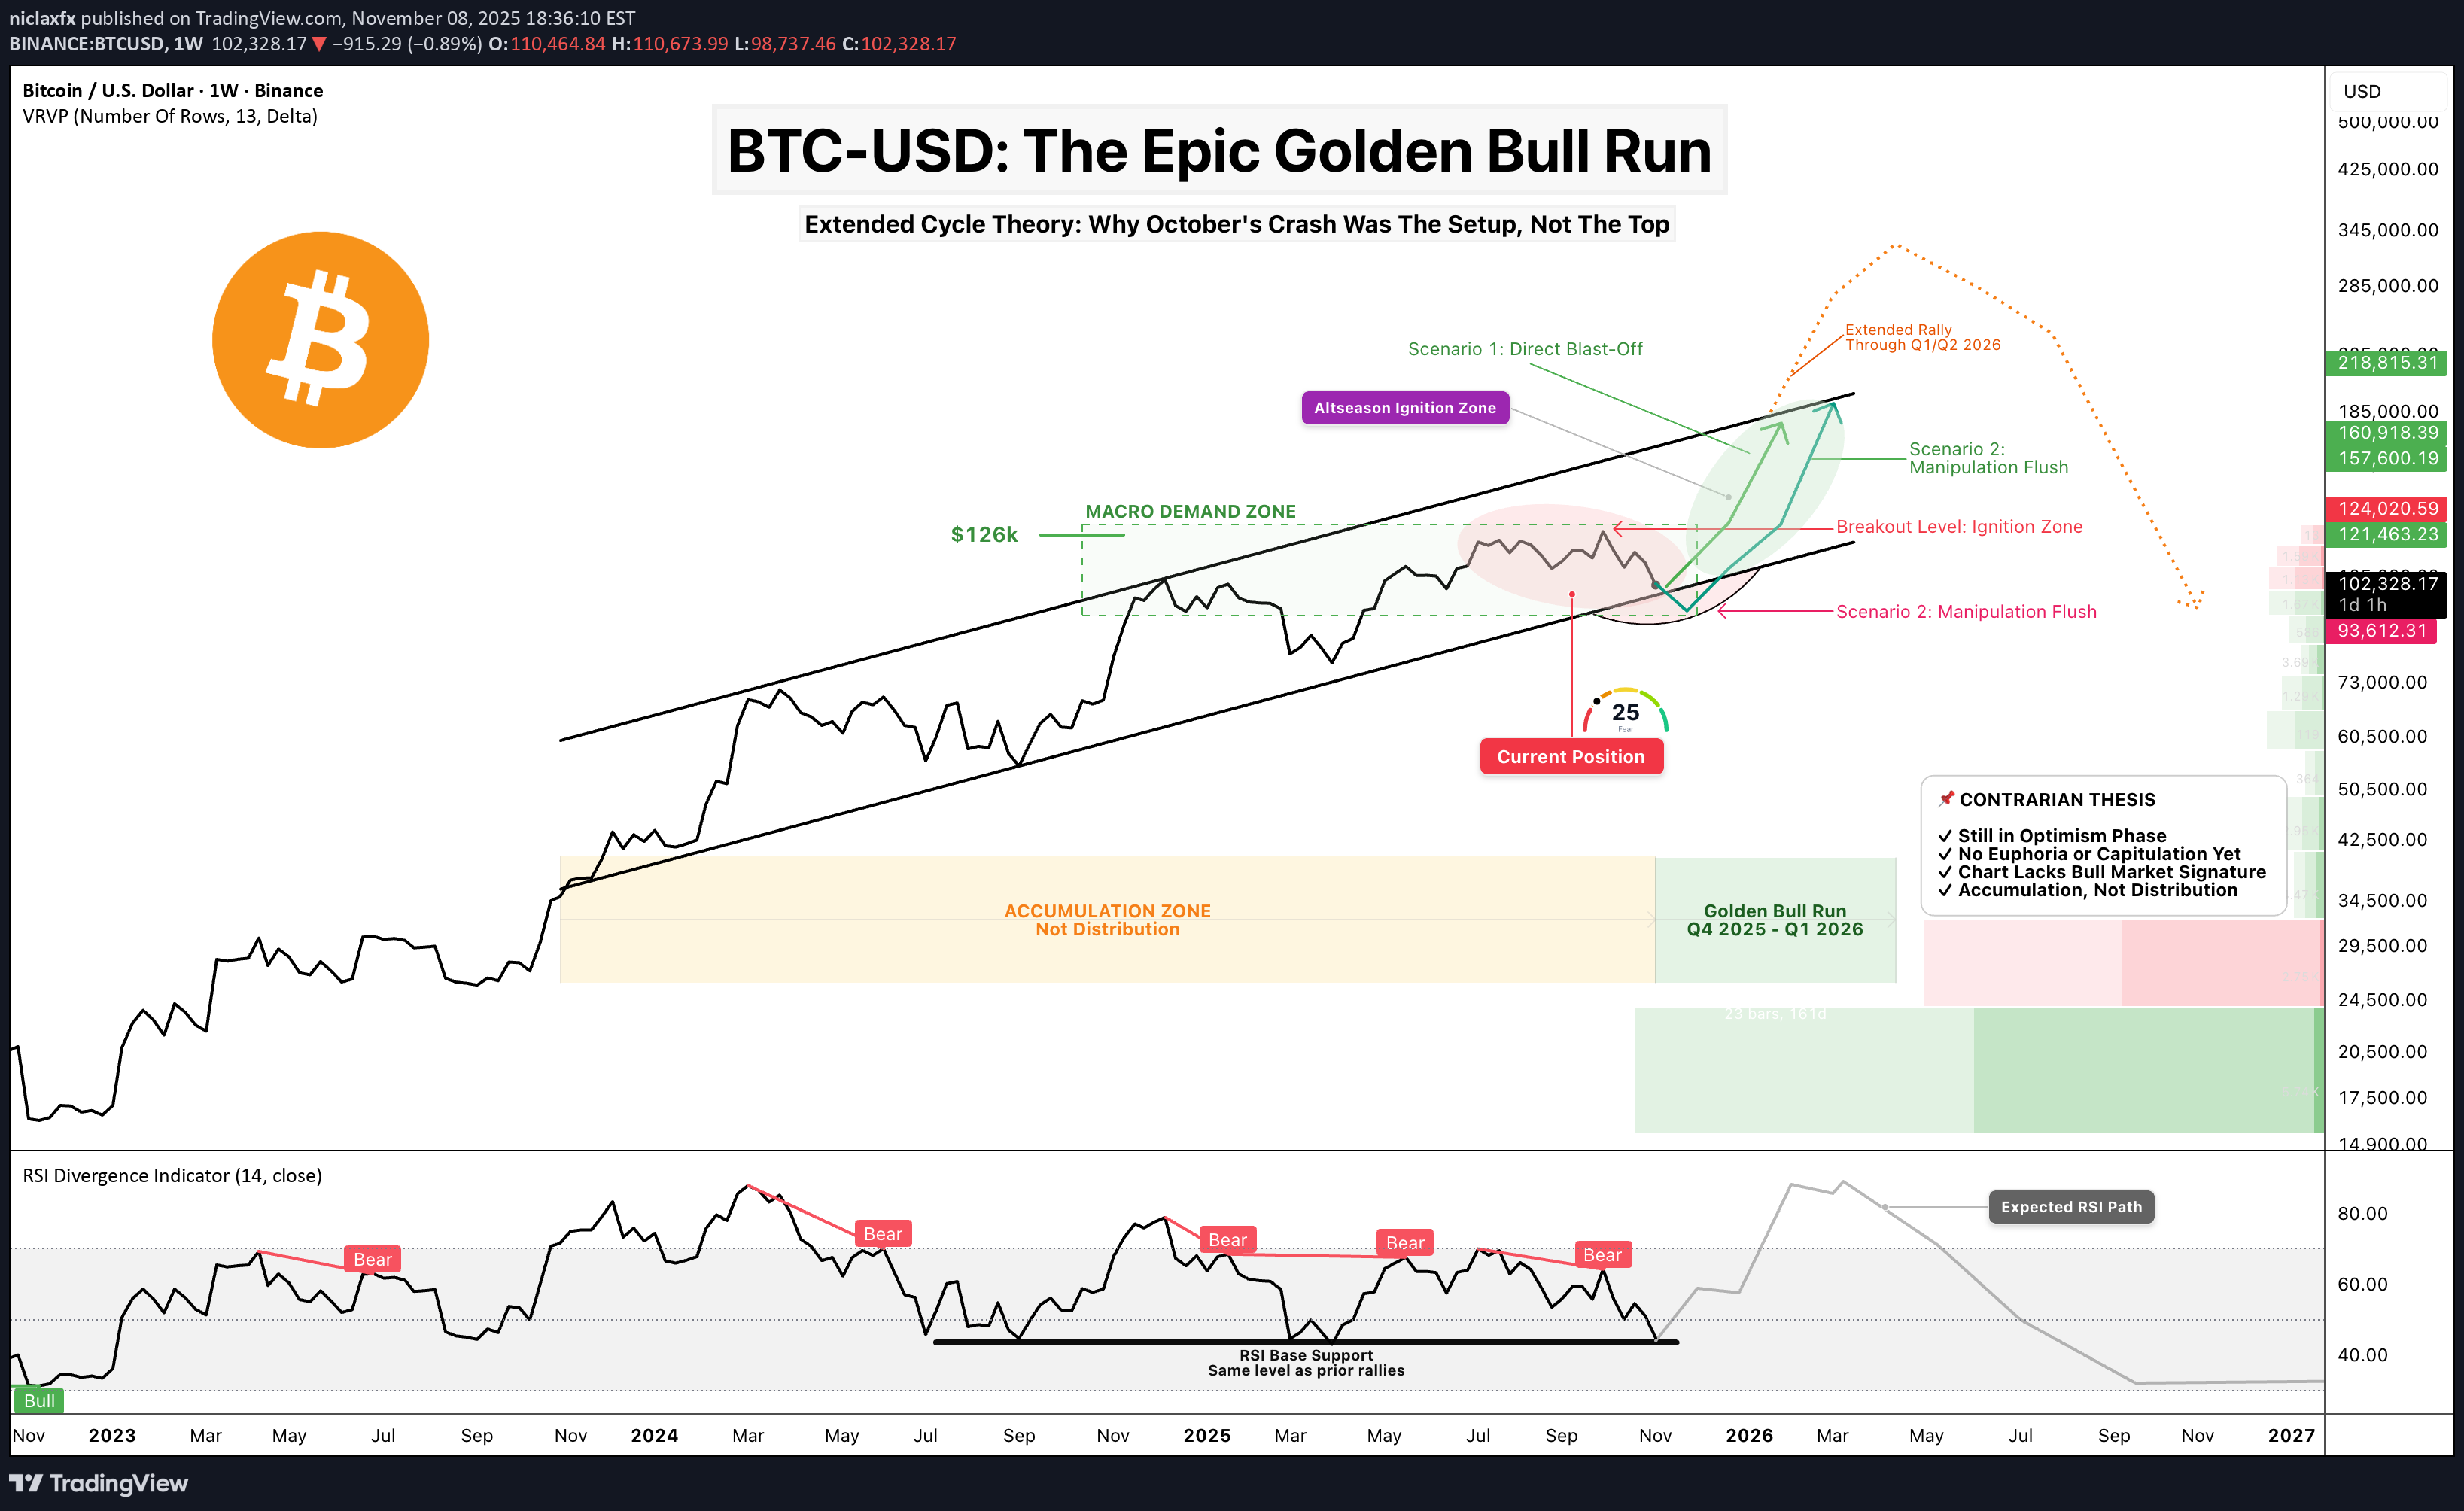
Yes, I get it. Everyone thinks we're already in a bear market. Hope is lost. Life-changing money evaporated. The October crash saw $19 billion in forced liquidations —the largest in crypto history. Some tragically took their own lives. No one wants false hope right now. But I don't think the bull market is over. And here's why—backed by data, not hopium. ──────────────────────────────────── ⚠️ DISCLAIMER This post is strictly my personal beliefs and thoughts, and should NOT be construed as financial advice, nor does it mean the market must go this way. This will be a long read but would be worth the time. Sit tight and grab a beer 🍻 ──────────────────────────────────── Context: Where I Stood in September First, I want to share that as of the last week of September, I gave a detailed breakdown of the market and shared why I thought the bull market was over, which I tagged "The Great Convergence." Read below if you missed that:👉 In that post, I worked with the BITCOIN halving cycle theory (along with SPX and GOLD ), which for over a decade has been the most efficient, accurate, and proven method for timing BITCOIN rallies, tops, and bottoms. By halving theory, the bull market should have ended by August/September 2025. What Actually Happened: Early October : BITCOIN briefly touched a new ATH near $126,296 October 1st : US government shutdown begins, draining $700B+ from markets via TGA October 10th : Trump's 100% China tariff threat triggers $19.13B liquidation cascade in 24 hours BITCOIN crashed from $126K to below $104K—an 18% drop in days October became the first "red October" since 2018 1.6 million traders liquidated—20x larger than COVID crash, 12x larger than FTX November 8th (Today) : Market hovering around $100-102K in extreme fear (Fear & Greed Index: 21) ──────────────────────────────────── 🔍 What's Different About This Current Cycle Here's what stands out as fundamentally different: 1️⃣ The Recent TOTAL Crypto Liquidation Wasn't Capitulation—It Was Infrastructure Cleansing This wasn't profit-taking or true capitulation. The numbers tell the story: $19.13 billion in forced liquidations in 24 hours 1.6 million traders wiped out 20x bigger than the March 2020 COVID crash ($1.2B) 12x bigger than the FTX collapse ($1.6B) This was leverage-driven, not sentiment-driven. The weak hands and overleveraged positions got flushed out. Meanwhile, strong hands (institutions, whales) continued accumulating through the chaos. Key Difference : In true bear market capitulations, holders capitulate. In October, leveraged speculators capitulated while spot holders held firm . ──────────────────────────────────── 2️⃣ The Liquidity Vacuum Is Temporary (This Is Critical) Here's what most people are missing about October: The crash wasn't just about tariffs—it was about a government-induced liquidity crisis . What Happened: US government shutdown began October 1st Treasury General Account (TGA) balance swelled from $800B to over $1 trillion in just 20 days That's $200+ billion drained from the financial system Standing Repo Facility (SRF) usage hit $50.35 billion on October 31—highest since the pandemic crisis in March 2020 This indicated severe dollar shortage in the system Why This Matters: BTCUSD correlation with dollar liquidity remains near 0.85 When the government shutdown ends and resumes spending, that liquidity floods back BitMEX analysts project a strong relief rally when hundreds of billions are injected back This isn't a structural bear market—it's a temporary liquidity vacuum. ──────────────────────────────────── 3️⃣ Institutional Holders Aren't Selling Like Retail Did in Past Cycles Whale Accumulation Data: 1,455 wallets now hold over 1,000 BTC UTXO Age Distribution shows a 5% spike in "Over 8 Years" buckets Long-term holders are doubling down , not distributing Whale Originating Transaction Count: Miner Behavior: Post-halving, miners anticipated higher prices and chose to hold rather than sell immediately While smaller miners face profitability pressure, institutional holders are not showing distribution patterns ETF Context: U.S. spot Bitcoin ETFs saw $1.2B+ in outflows during the crash week October 16 alone: $536 million in panic redemptions BlackRock's IBIT : $268.6M out | ARK's ARKB: $275.2M out BUT HERE'S THE KEY : These were temporary panic outflows, not structural distribution. Year-to-date, institutional accumulation has been relentless . The October outflows represent weak hands being shaken out—exactly what you'd expect in a mid-cycle correction, not a cycle top. ──────────────────────────────────── 4️⃣ No FOMO. No FUD. No Euphoria. (Strongest Psychological Indicators) Let's compare sentiment metrics: Current Sentiment: Crypto Fear & Greed Index: 21-25 (Extreme Fear) as of November 7-8 BTCUSD RSI as at Oct ATH: ~60 (far below euphoric 75+ levels) Market Mood: Despair, capitulation narrative, "bear market confirmed" True Bull Market Top Sentiment (for comparison): Fear & Greed Index: 80-95 (Extreme Greed) RSI: 75-85 (overbought for weeks) Market Mood: "Bitcoin to $500K," taxi drivers asking about crypto, covers of mainstream magazines We haven't even come close to euphoria. The 2024 meme coin craze was a micro-cycle within the broader structure—too early and too isolated to be considered true market-wide euphoria. ──────────────────────────────────── 5️⃣ The CHART Does Not Reflect a Bull Market Yet This is where I'll let the charts speak. First, Look at Gold's Bull Market: 👉 Clean. Parabolic. Obvious. No second-guessing needed. Now Look at Bitcoin: 👉 Ask Yourself Honestly: Does this chart scream "parabolic bull market"? Does the recent ATH look like a blow-off top? Does the volume profile suggest distribution? If you can't answer YES with conviction, then the answer is NO. A Simple Psychology Principle I Use: If I can't say YES without doubting my decision, then the answer is NO. ──────────────────────────────────── 6️⃣ Cycle Coincided with AI Tech Mania and GOLD Super Rally This cycle is unique because capital had competing destinations: AI Tech Mania : Nvidia, AI stocks absorbed massive capital flows GOLD Super Rally : GOLD broke out to all-time highs, attracting safe-haven capital Risk-On Delay : BTCUSD became less attractive as capital rotated elsewhere This delayed the typical BITCOIN Bitcoin cycle dynamics—it didn't end them. ──────────────────────────────────── 🧠 My Contrarian Thesis While this might sound crazy, I believe we are still in the OPTIMISM phase of this rally. Unlike previous cycles, I believe we will experience an extended rally lasting through Q1/Q2 2026. My Thesis is NOT Based On: ❌ Traditional Halving Cycle Theory — I believe that timeline will be extended and recalibrated this time ❌ Stock-to-Flow (S2F) Alone — Though I lean toward its supply dynamics My Thesis IS Based On: ✅ Pure naked price action and structure ✅ Volume profile analysis showing accumulation ✅ Market structure and RSI positioning ✅ Government liquidity mechanics and TGA dynamics ✅ Institutional vs retail behavior divergence ✅ Psychological playbook of market cycles ──────────────────────────────────── 🔄 Why the Halving Cycle Is Extended, Not Broken Many are saying "the 4-year cycle is dead." I disagree. It's not broken—it's being distorted and extended by new factors: The ETF Factor Changed Everything: Traditional Halving Cycle: Post-halving scarcity → slow accumulation → parabolic phase ~500-550 days later 2024-2025 Cycle: January 2024: Spot BTCUSD ETFs approved ETFs brought forward typical post-halving demand 12 months early This created an early rally into March 2024, then consolidation October 2025: Temporary ETF panic outflows (weak hands exit) Framework : The cycle hasn't ended—it's been stretched across a longer timeframe Historical Context: Historically, most significant price appreciation occurred between days ~500-550 post-halving For the April 2024 halving, that window ends Q3 2025 ... but if we factor in the time lag and the now running ~2-Months Govt shutdown delay then that window could be adjusted to Q3 2025 - Q1 2026 See it like a football match, time delay during match is added as extra time, it doesn't mean the 90min rule is broken simply means wasted time must be accounted for. We're literally in the window right now Expert Analysis: Leading analysts suggest the era of the strict 4-year cycle is evolving Market maturity, institutional concentration, and dampened volatility mean the traditional rhythm is being replaced by liquidity-sensitive, macro-correlated behavior The cycle isn't gone—it's adapting to a new market structure ──────────────────────────────────── 📈 The Current Chart Breakdown Look at the Chart Again: 👉 Four Critical Questions: 1. Does this move look like a completed rally? → No. It looks like mid-cycle consolidation with a violent shakeout. 2. Does the recent ATH reflect a distribution top? → No. Volume and RSI don't support distribution behavior. The ATH was a brief spike , not a prolonged distribution phase. 3. What does the volume profile show? → Accumulation zone. Heavy volume during the $95K-$110K range indicates re-accumulation, not distribution. 4. What is the RSI telling us? → Sitting on base support —the same level that triggered every prior bull market explosion in this cycle. Conclusion: If both price action and volume show accumulation rather than distribution, we're in a re-accumulation phase, not a post-rally distribution phase. ──────────────────────────────────── 🎯 The Macro Setup BTC is Positioned Perfectly: ✅ Inside the macro demand zone that has held since late 2023 ✅ On the ascending channel that guided every major leg of this cycle ✅ Channel from 2023 is intact and pointing into six-figure territory ✅ Weekly demand zone holding with precision — re-accumulation, not distribution ✅ Weekly RSI on base support — same level that triggered every bull explosion ✅ Nothing is broken. Nothing is topping. This is positioning, not exhaustion. ──────────────────────────────────── I shared this analysis yesterday, you can read the full or the summarized version below: 📅 Cycle Structure: The 14-15 Week Expansion Pattern Every expansion leg in this cycle has followed a pattern: 14-15 weeks of expansion Followed by 16-18 weeks of correction Where Are We Now? End of the correction window Beginning of the next expansion phase Historical Precedent: If we follow 2017's pattern (euphoric Nov-Dec Rally) where BTC gained +200% in price between Nov 17 -Dec 17 from 5.6k+ to 19.6k+, we could see an explosive acceleration starting from Next week Mid-November - December 2025 With institutional adoption and extended liquidity cycles, this could push into Q1 2026 This would make the current cycle the longest on record , not the end of one ──────────────────────────────────── 🔥 What the Chart Is Screaming Key Technical Signals: Ascending Channel Intact — Channel from late 2023 still pointing to six figures Demand Zone Holding — Weekly demand zone defended with precision Breakout Level Clear — $126K break = ignition point for macro acceleration RSI Base Support — Weekly RSI at the exact level that preceded every rally Projection Untouched — Path to $150K–$170K remains structurally intact ──────────────────────────────────── 🚀 Two Scenarios Moving Forward Scenario 1: Direct Blast-Off ⚡ Demand zone holds firm here Government shutdown ends → liquidity snap-back $126K breaks decisively within weeks New ATH confirmed Vertical acceleration into $150K–$170K by December 2025 Extended rally continues through Q1 2026 Scenario 2: One Final Manipulation Flush 🌊 Wick below demand zone (liquidity grab to $95K-$98K) Mid-channel tap for final shakeout Violent V-shaped recovery and reclaim Same ultimate target: $160K–$170K Timeline delayed by 4-8 weeks but destination unchanged Both scenarios end at the same place. The path differs, but the structure remains intact. ──────────────────────────────────── ❌ The Only Invalidation I will abandon this thesis if: Primary Invalidation: Weekly close below the ascending channel (currently ~$80K) Secondary Warning Signals: TGA doesn't release liquidity when government reopens Institutional ETF outflows continue for 2+ consecutive months Fear & Greed Index stays below 30 through EOY 2025 BITCOIN fails to reclaim $110K by end of November 2025 Weekly RSI breaks below 40 and stays there Until these conditions are met, the bull thesis remains structurally intact. ──────────────────────────────────── 💡 The Liquidity Snap-Back Thesis Here's the mechanism most traders are missing: How Government Shutdowns Affect Crypto: Phase 1: Shutdown (October 1 - Present) Government stops spending TGA balance grows ($800B → $1T+) Liquidity drained from system Dollar shortage (SRF at $50B+) Risk assets crash Phase 2: Reopening (Coming Soon) Government resumes spending TGA balance depletes back down $200B+ floods back into system Dollar shortage resolved Risk assets rally violently BTCUSD 0.85 correlation with dollar liquidity means: When liquidity drains → Bitcoin falls When liquidity returns → Bitcoin rips This isn't speculation—it's mechanical. The October crash was a liquidity event, not a sentiment event. When that liquidity returns, BTC will respond proportionally. ──────────────────────────────────── 📊 Why October's Liquidation Was Different From Bear Markets Let's compare major crypto crashes: The Critical Difference: Previous crashes: Spot holders capitulated October 2025: Spot holders accumulated while leveraged traders got wiped out This is cleansing, not capitulation. ──────────────────────────────────── 🎨 Compare: What a Real Bull Market Top Looks Like Signs of a Cycle Top We DON'T Have: ❌ Fear & Greed Index at 90+ for weeks ❌ RSI pinned above 75 ❌ Parabolic vertical price action ❌ "Bitcoin is going to $1 million" headlines everywhere ❌ Taxi drivers and hairdressers asking about crypto ❌ Massive miner selling at highs ❌ Whales distributing to retail ❌ Everyone you know is suddenly a crypto expert ❌ Cover stories on TIME, Forbes, Bloomberg ❌ New ATHs multiple weeks in a row Signs of Mid-Cycle Correction We DO Have: ✅ Fear & Greed at 21 (Extreme Fear) ✅ RSI at 46 (neutral to oversold) ✅ Choppy consolidation in range ✅ "Bull market is over" narratives everywhere ✅ Retail giving up and selling ✅ Whales accumulating quietly ✅ Liquidation event clearing out leverage ✅ Volume profile showing accumulation ✅ Market despair and hopelessness We're not at a top. We're in the middle of the game. ──────────────────────────────────── 💰 Why I'm All In In my last post I said I went ALL IN on BITCOIN and my selected alts. (after earlier shorting around 120k and sitting on cash) Not because I'm reckless. Not because I'm ignoring risk. But because: The macro structure is intact The demand zone is holding RSI is at historical launch support Volume shows accumulation, not distribution No euphoria has occurred yet The chart does not reflect a completed bull market Government liquidity will return mechanically Largest liquidation in history = weak hands removed Institutional holders aren't selling We're in the historical extended post-halving window This is structure. This is patience. This is conviction based on data. ──────────────────────────────────── 🙏 Final Thoughts I know many of you are hurting right now. I know hope feels dangerous. But look at the data objectively: October was the largest forced liquidation in history—not organic selling The government shutdown created a temporary liquidity vacuum Zero signs of euphoria anywhere in the market Institutional holders and whales are accumulating The chart structure shows mid-cycle correction , not cycle top Sometimes, the best opportunities come when: Everyone is bearish The crowd has capitulated Fear is at its peak And the chart is quietly building the foundation for the next explosive leg This is not hopium. This is structure. This is the setup. The Golden Bull Run hasn't even started breathing yet. We're not at the end— we're at the reset point before the real parabolic phase. ──────────────────────────────────── 📌 Key Levels to Watch Support Levels: Primary Demand Zone: $98K - $104K (current position) Mid-Channel Support: $90K - $95K Critical Invalidation: $85k-$90K (weekly close) Breakout Levels: Ignition Point: $126K (previous ATH) Confirmation: $130K (weekly close above) Targets: Conservative: $150K - $160K (Q2 2025) Base Case: $170K - $180K (Q3 2025) Extended Cycle: $200K+ (Q4 2025 - Q2 2026) Timeline Checkpoints: End of November 2025: Reclaim $110K December 2025: Break $126K and establish new ATH Q1 2026: Parabolic acceleration phase and potential cycle peak(extended thesis) ──────────────────────────────────── 🎯 What Would Make Me Change My Mind? I will publicly update and reassess if: Weekly close below $85k-$90K (channel break) TGA remains elevated 4+ weeks after shutdown ends Institutional ETF outflows persist through December RSI breaks and holds below 40 Fear & Greed stays below 30 through Q1 2026 Failure to reclaim $110K by November 31, 2025 I'm bullish, but not blind. The market will tell us if the thesis breaks. ──────────────────────────────────── 🔚 Bottom Line This bull market isn't slowing down—it's resetting for the real parabolic phase. BTC is gearing up for expansion, and alts will follow with the delayed but inevitable altseason wave. This next 12-18 months is where: Generational wealth is made or missed The real euphoria begins The masses FOMO in—not out The chart finally looks like a bull market Don't let October's liquidation event fool you into thinking this is over. The chart says accumulation. The structure says intact. The liquidity says temporary. The sentiment says despair. That's not a bear market— that's the setup for the next leg. 🐂🔥 ──────────────────────────────────── Not financial advice. This is my personal analysis based on current data. Markets are unpredictable. Trade responsibly. Manage your risk. Do your own research. If you found this analysis valuable, feel free to boost/share. Let's see who's still standing when BITCOIN crosses $150K. ────────────────────────────────────