
bL1TZZ
@t_bL1TZZ

Ne tavsiye etmek istersiniz?
önceki makale
پیام های تریدر
filtre
bL1TZZ
A Spring Or Final Test Of Supply Before Markup? Bulls Load Up.

MDXUSDT en yüksek seviyelerinden %98'ini düzeltti. BTC'nin yükseliş rallisini takip etmedi ve şu anda near strong talep bölgesinde kalıyor. Wykoff'un Birikim Şemalarını takip edersek Aşama C'ye giriyor olabiliriz. A Aşaması, %320 Otomatik Reaksiyondan önce Ön Destek / Doruğa Satış ile başladı. Bu strong rallisi direnç bölgemizi istediğimden daha yükseğe çıkardı. Daha sonra A Aşamasını sonlandıran SC'ten sonra birden fazla ST meydana geldi. Faz B'de de birden fazla ST vardı ancak fiyat hiçbir zaman AR direnç seviyelerine ulaşmadı. Bir "Bahar" tipik olarak TR destek bölgesinin altına kısa bir düşüş yapar, ancak bu, boğaların Faz B ST (İkincil test) sırasındaki aynı düşük seviye olan 5,5 sente adım atmasıyla olmayacaktı. Bahardan sonra bir Test (son sarsıntı/Ayı Tuzağı) veya arıza olmadan Son Destek Noktası bekleyebiliriz. Hatta Baharın çoktan geldiğini ve bunun kalan arzın Testi olduğunu bile iddia edebilirsiniz. Herşey mümkün. Test—Büyük operatörler her zaman bir TR boyunca (örn. ST'ler ve yaylar) ve fiyat artışı sırasında key noktalarda arz için piyasayı test eder. Bir testte önemli miktarda arz ortaya çıkarsa, piyasa genellikle fiyatlandırılmaya hazır değildir. Yükselişe geçmek için çeşitli nedenler var; 8 Osilatörler yakın zamanda işlemleri başlatmak için yükseliş çekiciyle farklılaşmayı bastılar. RSI Daha Yüksek En Düşükleri ve Daha Yüksek En Yüksekleri oluşturmaya devam ediyor. Büyük Hacim Profili, near İşlem Aralığının en düşük seviyelerinde görünür ve bu da yükselişi hızla azaltır. 10 günlük/Haftalık Stokastik yükseliş eğilimi near aşırı satış seviyelerinde. Fiyat şu anda haftalık 10/21 günlük SMA'ların üzerinde seyrediyor ve ilk kesişime yaklaşıyor. 2. günde, 50 + 200 SMA ilk kez Altın Haç'a bir inç daha yaklaştı. Bulls, 5,5 sent – 6 sentlik destek bölgesini korumak için büyük bir kararlılık gösterdi. Fiyat daha da düşebilir mi? Elbette. Bir stratejiye sahip olmak key'dir. Ayıların bu idea'u geçersiz kılmak için strong hacim destekli bir kırılmaya ve desteğin altında uzun bir süreye ihtiyacı var. Piyasadaki strong satışları da boğalar üzerinde baskı yaratabilir. Faz C Nedir? Aşama C'de hisse senedi fiyatı, kalan arz üzerinde belirleyici bir teste tabi tutulur ve bu da "akıllı para" operatörlerinin hisse senedinin fiyatlandırılmaya hazır olup olmadığını tespit etmesine olanak tanır. Bahar, TR'nin (A ve B Aşamalarında oluşturulan) destek seviyesinin altında hızla tersine dönen ve TR'ye geri dönen bir fiyat hareketidir. Bu bir ayı tuzağı örneğidir çünkü desteğin altındaki düşüş, düşüş trendinin yeniden başlayacağının sinyalini veriyor gibi görünmektedir. Ancak gerçekte bu, geç satıcıları (ayıları) tuzağa düşüren yeni bir yükseliş trendinin başlangıcına işaret ediyor. Wyckoff'un yönteminde, bir yay (veya bir sarsıntı) ile temsil edilen başarılı bir arz testi, yüksek olasılıklı bir ticaret fırsatı sağlar. Düşük hacimli bir yay (veya düşük hacimli bir sarsıntı testi), hisse senedinin muhtemelen yukarı hareket etmeye hazır olduğunu gösterir, bu nedenle bu, en azından kısmi bir uzun pozisyon başlatmak için iyi bir zamandır. Mdex(MDX) Nedir? Mdex, fon havuzları konseptine dayalı, otomatik piyasa yapıcı, merkezi olmayan bir borsadır. Mdex, Heco Chain'e dayalı bir çift zincirli DEX modeli önerir ve uygular ve Ethereum. Mdex, Heco zincirinin düşük işlem ücretlerinin avantajlarını ve Ethereum ekosisteminin refahını birleştirir. MDEX ile kullanıcılar aynı zamanda likidite madenciliği ve ticari madenciliğin ikili madencilik mekanizmasına da katılabilirler. Mdex, Heco ve Ethereum üzerinde DEX, IMO ve DAO'yu entegre eden en büyük DeFi platformunu oluşturmaya kararlıdır. Mevcut Piyasa Değeri - 70m. Sirkülasyon Arzı - 950.25M Spekülatif Kurulum, DYOR + DD. İyi şanslar!Yorum: 1 hafta Osilatörler
bL1TZZ
Chainlink - Did We Just Witness Wykoff Accumulation?

To all my fellow traders, speculators and gamblers, its been some time since my last post. I hope you've all been well, and most importantly, bathing in huge profits :) It seems like Chainlink followed textbook Wykoff Accumulation Schematics. Not the most perfect schematics, notably PS ( Prelim Support) falling a little short of the soon to be Resistance Lines. In addition, BU only touched the resistance turned support once before rocketing up. However the first PS does line up with the BU and subsequent SOS (Show Of Strength) Phase A includes a number of additional ST ( Secondary Test) which is common after the SC (Selling Climax) stage. The selling Climax should've marked the lowest point, but price action made a lower low after the AR (Auto Rally) But it was merely a 19c difference. Price still stayed within the TR(Trading Range) and bounced from the support lines. The AR also marked the highest point within the trading range. These are all minor discrepancies as price action continued to follow Wykoff theory. We had multiple touches of the Support / Resistance lines, along with a perfect Spring (Final Shakeout/Bear Trap), Test and LPS, followed by a BU + SOS. It took approximately 533 days from the SC (Selling Climax) to the TR (Trading Range) breakout, The longer the accumulation period, the stronger the "Spring". Does this mean price will continue north? Not necessarily, we've all seen these schematics fail. After all, Chainlink is up over 305% since the $4.65 Spring/Shakeout/Bear Trap lows. That would've made an awesome long entry. However, price is still way below its $53 ATH, so anything is possible. Having a quick look we could see that price is currently at resistance levels. A break from the 19$ range could initiate further upside. Like the majority of the market, the crypto king (BTC) will probably dictate Chainlinks next move. If we are to follow Wykoff theory, we could expect further upside. I made a post back in May 22' private post titled "Link... Whales have been accumulating" I remember reading many articles at the time that stated big players were buying up Chainlink. Price action also found support at various Fibonacci levels, in addition to strong buy signals. RSI Levels were at record lows, in addition to a whopping 90% correction at the time. Unfortunately, I never got around to publishing that idea, it would've made a fantastic post. I am no expert on Wykoff theory, so I've included information taken from various online sources. Hopefully it helps, Much love and lots of profits to you all. What is Wyckoff Accumulation? Each cycle in the market begins with accumulation. This phase is marked by a range trend, where the market is relatively stable and rangebound. During this phase, institutional investors buy the stock at lower prices. Also, the volume tends to decline in this phase because the buying interest gradually absorbs the selling pressure. Another way to confirm accumulation is to look at the support level. You may notice higher lows, indicating that the buyers are gaining power. Slowly, the trading volume begins to rise. This is a key indicator of the shift in sentiment and suggests a breakout trend. As the accumulation progresses, you may see signs of strength in the price action, where the asset breaks above the trading range’s upper boundary. This breakout often indicates that the market is ready for an upward move. During the Wyckoff Accumulation process, smart money builds substantial positions at favourable prices before the broader market realizes the potential for an upward move. The accumulation may resemble a “compressed spring” on the chart. The longer it is, the better the indication of a breakout. Markup: The second phase of accumulation is the markup, which follows a breakout. According to Wyckoff, traders should find entry points through the pullback zones in this phase. Wyckoff Events PS— Preliminary Support , where substantial buying begins to provide pronounced support after a prolonged down-move. Volume increases and price spread widens, signalling that the down-move may be approaching its end. SC— Selling Climax, the point at which widening spread and selling pressure usually climaxes and heavy or panicky selling by the public is being absorbed by larger professional interests at or near a bottom. Often price will close well off the low in a SC, reflecting the buying by these large interests. AR— Automatic Rally , which occurs because intense selling pressure has greatly diminished. A wave of buying easily pushes prices up; this is further fueled by short covering. The high of this rally will help define the upper boundary of an accumulation TR. ST— Secondary Test , in which price revisits the area of the SC to test the supply/demand balance at these levels. If a bottom is to be confirmed, volume and price spread should be significantly diminished as the market approaches support in the area of the SC. It is common to have multiple STs after a SC. Springs or shakeouts usually occur late within a TR and allow the stock’s dominant players to make a definitive test of available supply before a markup campaign unfolds. A “spring” takes price below the low of the TR and then reverses to close within the TR; this action allows large interests to mislead the public about the future trend direction and to acquire additional shares at bargain prices. A terminal shakeout at the end of an accumulation TR is like a spring on steroids. Shakeouts may also occur once a price advance has started, with rapid downward movement intended to induce retail traders and investors in long positions to sell their shares to large operators. Test — Large operators always test the market for supply throughout a TR (e.g., STs and springs) and at key points during a price advance. If considerable supply emerges on a test, the market is often not ready to be marked up. A spring is often followed by one or more tests; a successful test (indicating that further price increases will follow) typically makes a higher low on lesser volume. SOS — Sign Of Strength , a price advance on increasing spread and relatively higher volume. Often a SOS takes place after a spring, validating the analyst’s interpretation of that prior action. LPS—Last Point of Support , the low point of a reaction or pullback after a SOS. Backing up to an LPS means a pullback to support that was formerly resistance, on diminished spread and volume. On some charts, there may be more than one LPS, despite the ostensibly singular precision of this term. BU—“Back-Up” . This term is short-hand for a colourful metaphor coined by Robert Evans, one of the leading teachers of the Wyckoff method from the 1930s to the 1960s. Evans analogized the SOS to a “jump across the creek” of price resistance, and the “back up to the creek” represented both short-term profit-taking and a test for additional supply around the area of resistance. A back-up is a common structural element preceding a more substantial price mark-up, and can take on a variety of forms, including a simple pullback or a new TR at a higher level. Each Phase Explained. Phase A: Phase A marks the stopping of the prior downtrend. Up to this point, supply has been dominant. The approaching diminution of supply is evidenced in preliminary support (PS) and a selling climax (SC). These events are often very obvious on bar charts, where widening spread and heavy volume depict the transfer of huge numbers of shares from the public to large professional interests. Once these intense selling pressures have been relieved, an automatic rally (AR), consisting of both institutional demand for shares as well as short-covering, typically ensues. A successful secondary test (ST) in the area of the SC will show less selling than previously and a narrowing of spread and decreased volume, generally stopping at or above the same price level as the SC. If the ST goes lower than that of the SC, one can anticipate either new lows or prolonged consolidation. The lows of the SC and the ST and the high of the AR set the boundaries of the TR. Horizontal lines may be drawn to help focus attention on market behaviour. Sometimes the downtrend may end less dramatically, without climactic price and volume action. In general, however, it is preferable to see the PS, SC, AR and ST, as these provide not only a more distinct charting landscape but a clear indication that large operators have definitively initiated accumulation. In a re-accumulation TR (which occurs during a longer-term uptrend), the points representing PS, SC and ST are not evident in Phase A. Rather, in such cases, Phase A resembles that more typically seen in distribution (see below). Phases B-E generally have a shorter duration and smaller amplitude than, but are ultimately similar to, those in the primary accumulation base. Phase B: In Wyckoffian analysis, Phase B serves the function of “building a cause” for a new uptrend (see Wyckoff Law #2 – “Cause and Effect”). In Phase B, institutions and large professional interests are accumulating relatively low-priced inventory in anticipation of the next markup. The process of institutional accumulation may take a long time (sometimes a year or more) and involves purchasing shares at lower prices and checking advances in price with short sales. There are usually multiple STs during Phase B, as well as upthrust-type actions at the upper end of the TR. Overall, the large interests are net buyers of shares as the TR evolves, with the goal of acquiring as much of the remaining floating supply as possible. Institutional buying and selling imparts the characteristic up-and-down price action of the trading range. Early on in Phase B, the price swings tend to be wide and accompanied by high volume. As the professionals absorb the supply, however, the volume on downswings within the TR tends to diminish. When it appears that supply is likely to have been exhausted, the stock is ready for Phase C. Phase C: It is in Phase C that the stock price goes through a decisive test of the remaining supply, allowing the “smart money” operators to ascertain whether the stock is ready to be marked up. As noted above, a spring is a price move below the support level of the TR (established in Phases A and B) that quickly reverses and moves back into the TR. It is an example of a bear trap because the drop below support appears to signal resumption of the downtrend. In reality, though, this marks the beginning of a new uptrend, trapping the late sellers (bears). In Wyckoff's method, a successful test of supply represented by a spring (or a shakeout) provides a high-probability trading opportunity. A low-volume spring (or a low-volume test of a shakeout) indicates that the stock is likely to be ready to move up, so this is a good time to initiate at least a partial long position. The appearance of a SOS shortly after a spring or shakeout validates the analysis. As noted in Accumulation Schematic #2, however, the testing of supply can occur higher up in the TR without a spring or shakeout; when this occurs, the identification of Phase C can be challenging. Phase D: If we are correct in our analysis, what should follow is the consistent dominance of demand over supply. This is evidenced by a pattern of advances (SOSs) on widening price spreads and increasing volume, as well as reactions (LPSs) on smaller spreads and diminished volumes. During Phase D, the price will move at least to the top of the TR. LPSs in this phase are generally excellent places to initiate or add to profitable long positions. Phase E: In Phase E, the stock leaves the TR, demand is in full control and the markup is obvious to everyone. Setbacks, such as shakeouts and more typical reactions, are usually short-lived. New, higher-level TRs comprising both profit-taking and acquisition of additional shares (“re-accumulation”) by large operators can occur at any point in Phase E. These TRs are sometimes called “stepping stones” on the way to even higher price targets. Who Was Richard Wykoff? Richard Demille Wyckoff (1873–1934) was an early 20th-century pioneer in the technical approach to studying the stock market. He is considered one of the five “titans” of technical analysis, along with Dow, Gann, Elliott, and Merrill. At age 15, he worked as a stock runner for a New York brokerage. Afterward, while still in his 20s, he became the head of his firm. He also founded and, for nearly two decades, wrote and edited The Magazine of Wall Street, which, at one point, had more than 200,000 subscribers. Wyckoff was an avid student of the markets, as well as an active tape reader and trader. He observed the market activities and campaigns of the legendary stock operators of his time, including JP Morgan and Jesse Livermore. From his observations and interviews with those big-time traders, Wyckoff codified the best practices of Livermore and others into laws, principles, and techniques of trading methodology, money management, and mental discipline. Mr. Wyckoff observed numerous retail investors being repeatedly fleeced. Consequently, he dedicated himself to instructing the public about “the real rules of the game” as played by the large interests, or “smart money.” In the 1930s, he founded a school that would later become the Stock Market Institute. The school's central offering was a course that integrated the concepts that Wyckoff had learned about identifying large operators' accumulation and distribution of stock with how to take positions in harmony with these big players. His time-tested insights are as valid today as they were when first articulated. Speculative Setup, DYOR.
bL1TZZ
The Crypto Commander-In-Chief & The Fibonacci Golden Pocket.

نه، این یک "ایده کوتاه مدت" نیست، بلکه نگاهی است به اوجهای قبلی بازار و اصلاحات پس از آن. 2013 - در نوامبر، BTC در حدود 1,163 دلار به اوج خود میرسد. اگر خوش شانس بودید و چند سال قبل bitty را با قیمت 2 دلار خریده بودید، 50,000٪ بازدهی فوق العاده داشتید. سپس قیمت یک اصلاح اساسی 86.7 درصدی را تجربه می کند و در سطح 0.618 فیبوناچی به کف می رسد، دوره انباشت 2 ساله آغاز می شود. در مجموع 406 روز طول کشید تا BTC کف را پیدا کند و دقیقاً 1064 روز (35 ماه) از آن کف تا اوج سال 2017 طول کشید. 2017 - به لطف Bitfinex و همکاران، پادشاه ارزهای دیجیتال در دسامبر 2017 در محدوده 20 هزار دلار به اوج خود رسید، پس از آن یک اصلاح 85 درصدی اتفاق می افتد و قیمت در سطح 0.615 فیبوناچی به کف می رسد. یک جهش عالی 12,850 درصدی از کف های 155 دلاری سال 2015. تقریباً 364 روز طول کشید تا BTC کف را پیدا کند و از قضا، 1071 روز قبل از بالاترین حد تاریخی بعدی - تنها یک هفته اختلاف از پایین ترین تا بالاترین دوره 2015-2017. 2021 - BTC بالاترین حد تاریخی جدید 69,000 دلاری را ثبت می کند، یک صعود واقعاً تماشایی. تصور اینکه این زمانی 0.01 سنت بوده است، حیرت انگیز است. یک افزایش 2,150 درصدی از کف های حدود 3,100 دلاری سال 2018. با این حال، هنگامی که hit به محدوده 17,700 دلار رسید، 74 درصد از قیمت آن از بین رفته بود. این همچنین اولین باری است که BTC زیر بالاترین حد تاریخی قبلی سقوط می کند. قیمت هنوز در حدود سطح 0.382 فیبوناچی در نوسان است، اگر این سطح از بین برود، بازدید از سطح 0.5 فیبوناچی در برنامه است، این سطح همچنین با رالی ناموفقی که منجر به اوج سال 2019 شد، همتراز است. اگر BTC اصلاح 84 درصدی مشابهی را که در گذشته داشته است، تجربه کند، بار دیگر از منطقه معروف Golden Pocket دیدن کرد. Golden Pocket دارای حجم زیادی است، من شک ندارم که گاوی های بلندمدت به دنبال خرید از آنجا بود (به شرطی که اصلاً به آنجا برسد). نکته دیگری که باید به آن توجه داشت این است که، تقریباً یک دوره 4 ساله بین اوج های بازار وجود دارد. در واقع، مدت زمان بین اوج سال 2013 و اوج سال 2017، 1470 روز (48.32 ماه) بود، تنها 35 روز بین اوج تا اوج دوره 2017-2021 با 1435 روز (47.17 ماه) فاصله وجود دارد. اگر BTC از یک چرخه مشابه پیروی کند، این به طور بالقوه می تواند به معنای بالاترین حد تاریخی جدید در اکتبر 2025 باشد. BTC حتی می تواند از اینجا به اوج برسد، چه کسی می داند، فقط زمان مشخص کرد. انباشت، علامت گذاری، توزیع - ظهور و تکرار، این اتفاق قرن هاست که می افتد. تعصب من بدون تغییر باقی می ماند، همه ایده های ارسال شده من بلندمدت هستند و برای سرمایه گذاران بلندمدت مناسب هستند. آن دسته از گاوچران های سریع پولدار شدن بیشتر شبیه قمارباز هستند، نه سرمایه گذار. من معتقدم که اکنون زمان انباشت است. میانگین هزینه دلاری در پروژه های مورد علاقه شما قطعاً جذاب تر از یک سال قبل است. بسیاری از سکه ها به صفر می رسند، برخی ممکن است 10 برابر - 100 برابر شوند. داشتن استراتژی کلیدی است. تحقیقات خود را انجام دهید. در نهایت - "بازار ابزاری برای انتقال پول از بی صبر به صبور است." - وارن بافت. امیدوارم این به سرمایه گذاران، معامله گران و قماربازان همکارم کمک کند. موفق باشید! تنظیمات سوداگرانه، DYOR (تحقیق خود را انجام دهید).
bL1TZZ
META- Undervalued & Oversold.
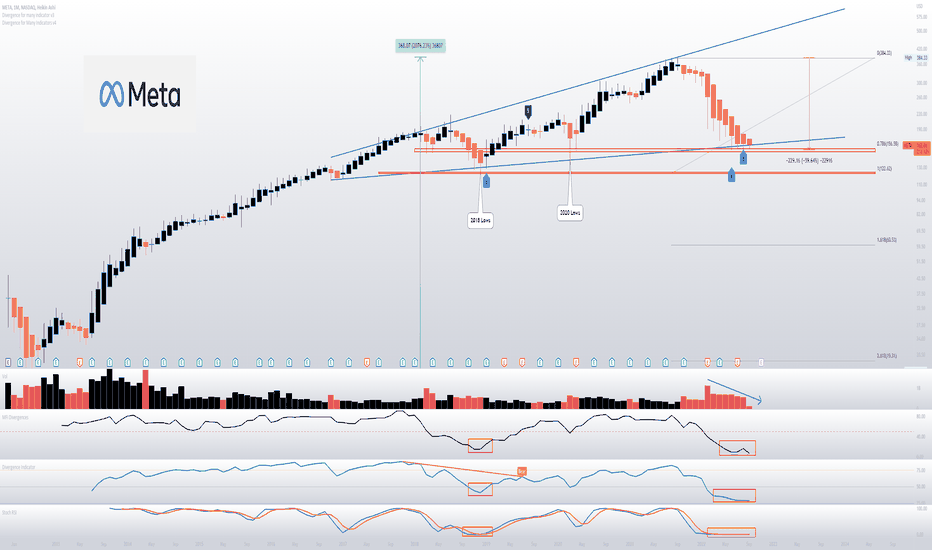
Market Cap - 426 Billion META has been on a 9 year bull run, in that period, it has firmly cemented itself as a digital marketing juggernaut. When it reached its all time high of $384.33 back in September 2021, it had an enormous market cap of 1.064 trillion dollars. At the time, it was only the fifth U.S. company to hit the milestone , joining Apple , Microsoft , Amazon and Google-parent company Alphabet . However the last 12 months have been somewhat brutal for Zuckerberg & co, the share price has dropped a staggering 60% to date, making this the biggest correction Meta has ever endured. Economic uncertainty, regulatory pressure and more recently, a first ever earnings miss, investors were quick to hit the panic button & add to the selling pressure. In February, Meta went down in history for the biggest one-day crash in the stock market. The company’s stock lost about $230 billion in market value in a single day. Meta revenue slipped to $28.8 billion in the second quarter, missing the $28.9 billion analyst estimate. Gross profit was $23.6 billion, down 0.5% from the equivalent quarter last year. In April, Apple introduced a change to its privacy policy that requires apps to ask users if they want to be tracked, this made META's ad selling business less affective, with only a reported 16% of users agreeing to be tracked. The privacy crackdown is set to cost Meta at least $10 billion in lost sales in 2022 alone. As a result of the data drought, Meta shifted their ad spending to Google because its flagship search-ad business relies on customer intent—users’ search terms immediately reveal what they are interested in—rather than data collected from app and web tracking. Google , the world’s largest digital-ad company by revenue, generated its highest sales growth in more than a decade in the third quarter. The sensational rise of short-video sharing app TikTok, has seen many users defect with approximately 1.4 billion monthly active users now on the popular platform. This is quickly approaching Instagram, which has approximately 2 billion monthly active users. This year, TikTok is on track to triple worldwide ad revenues, to $11.6bn, more than the $10.44bn for Snapchat and Twitter combined. This forced META to focus more on short-videos in the form of "Reels". Reels recently reached $1 billion in annualized revenue for the first time, Reels now has a higher revenue run rate than Facebook /Instagram Stories at identical times post-launch. Mark Zuckerberg is betting his company’s future on the metaverse — a virtual space in which people interact with each other using avatars and developing AR / VR technology. He said that he plans to invest heavily in his company’s metaverse ambitions & that will mean losing significant amounts of money on the project in the next three to five years. This massive shift has shaken up already nervous investors, however should one of its Reality Labs products change the world, it would be the jolt this company needs to continue funding its ambitions. The company once suffered a colossal 19% drop in 2018 after posting disappointing revenue and user figures for the second quarter of that year, however it bounced back before going on to make all time highs. Facebook has 2.74 billion monthly active users, No other platform offers this kind of reach. Facebook is the world’s third-most visited website- outranked only by Google and YouTube. It’s also the top Google search query. Facebook is the second-most downloaded free app in the App Store. 63% of the U.S. population over age 12 uses Facebook . 32.4% of Facebook’s audience is aged 25-34. Seniors are the fastest-growing group of Facebook users. More than 37% of people born in 1945 or earlier are on Facebook , up from 26% a year earlier. 74% of high-income earners use Facebook For those earning $75,000 or more, Facebook is the preferred social network. Facebook is also the most popular social network (besides YouTube) for college graduates, with 74% of them using the platform. LinkedIn again comes second with this group, at 51%. Facebook users spend 34 minutes per day using the platform. 36% of people get news from Facebook . 79.9% of Facebook users only access the platform on a mobile device. An average Facebook user clicks on 12 ads per month. Facebook has an advertising audience of 2.14 billion. Meta's balance sheet includes $40 billion in cash, equivalents and short term investments, with $16 billion in total debt (although some of this may include operating liabilities). The firm's free cash flow generation is very strong, with $8.5 billion generated in the quarter, up 8.9% year over year. $5 billion worth of stock was approved for purchase in the second quarter. In addition, the company authorized another $24.32 billion for stock repurchases. Meta further reduced its full-year operating expense during its latest earnings update. Its current operating expense guidance sits at $85.0-$87.0 billion for 2022 From a TA point of view, there are a number of reasons to be bullish which include- - A very strong oversold signal (not shown due to limitations using invite-only scripts on public ideas) - 9 + 5 oscillators recently printing divergence -look left, - RSI / MFI / Stochastic are all oversold & sit @ record lows, - Pulling a fib from the 2018 lows, we could see that price currently sits @ the 0.786 Fibonacci level, - Decreasing selling volume, - Support trendline being tested. Should the 0.786 / support trendline not hold, long-term bulls should look for buys @ 2018/2020 lows. Can price drop further? Sure! Timing tops or bottoms is not my thing. Will Zuckerberg's metaverse gamble pay off? Only time will tell. As it stands, Meta remains in a strong position with enormous reach, should the massive investment in metaverse pay off, there is no doubt that Meta will go on to make new highs. Speculative Setup, DYOR. Strictly a long term play. Allow 24-72 Months for this idea."there is no doubt that Meta will go on to make new highs" And a new All time high was most certainly made. Price did fall below our 2018/2020 buy zone by approximately %28, but the bulls staged a sensational rally with a 452% move to the upside. Congratulations to those who took this trade!
bL1TZZ
VeChain/USDT. Testing the 0.5 Fibonacci.

Mevcut Piyasa Değeri 1,69 MilyarMart 20 satışında 0,00157'ye düştüğünden beri, VeChain %17.000'in üzerinde fırlayarak 27,9 sentlik bir zirveye ulaştı! Kısa bir süre sonra, "İnanılmaz Satış" basıldığında, bu sinyaller daha yüksek TF'lerde göz ardı edilmemelidir. Fiyat o zamandan beri %92'nin üzerinde düzeldi ve kendini 0,5 Fib seviyesinde (2 sent) buldu. Bu alan aynı zamanda şimdi destek olarak test edilen önceki dirençtir. Ayrıca doğrulanmamış koşullu bir satın alma sinyalimiz var. 0,5 seviyesi tutmazsa, uzun vadeli boğalar altın cepte (1 sent) satın alma aramalı. Bu alan bir destek/talep bölgesi/önceki küçük direnç. POC 0,786'yı tamamlıyor, (yarım sent) uzun vadeli boğalar tekrar yükleme yapmalı. En büyük Hacim Profili 0,3 - 1 sent arasında görünüyor. RSI güzel bir düşen kama oluşturuyor, bir kırılma + HH bir ralliyi başlatabilir. Stokastik aşırı satılmış. Satış Hacmi zamanla yavaşça azaldı. Zirveleri/dipleri zamanlamak önemli değil ve işe yaramıyor. İnandığınız favori projelerinize DCA yapmak en iyisidir. Hakkında..VeChain, data silodan gelen bilgileri aracıdan çıkararak bir kuruluşun tam görünümünü sağlamayı amaçlayan bir kurumsal blok zinciri platformudur.VeChain ayrıca ilk coin teklifleri (ICO'lar) ve Nesnelerin İnterneti (IoT) bağlantılı cihazlar arasında işlem yapmak için lider bir platform olmayı planlıyor. VeChain iki token kullanır: VeChain token (VET) bir değer katmanı ve VeChain Thor Energy (VTHO) bir akıllı sözleşme katmanı olarak. Spekülatif Kurulum, DYOR. Tüm Kripto Fikirleri için 3-18+ Ay Süre Verin. Göstergelerin kullanımına izin verdiği için without_worries'e teşekkürler.
bL1TZZ
Disregard The Noise. XRP Will Eventually Pump. Bulls Load Up.

Öncelikle, XRP adı verilen bu merkezi şeyin en büyük hayranı değilim. YouTube'daki propagandacıların "XRP 10K, 25K, 50K, 100K", "Büyük Sıfırlama" vb. gibi saçmalıklar yaymasını sevmiyorum. Ancak burada duyguların önemi yok ve akıl hocamın tekrar tekrar söylediği gibi - "Duygular adamı, Bir Para Katili" 20 Mart satışında 10 sente ulaştığından beri, fiyat %1800 yükselerek 1,96 dolara çıktı, ardından "Büyük Satış" basıldı ve fiyat o zamandan beri %85 düzelerek 29 sente çıktı.XRP piyasanın geri kalanı gibi bir daha asla yükselmedi ve en iyi 10 coin'in geri kalanı gibi yeni bir zirveye ulaşmadı, bunun başlıca nedeninin herkesin artık farkında olduğundan emin olduğum tüm SEC destanı olduğunu düşünüyorum. Fiyat şu anda Fibonacci Altın Cebinde geziniyor, büyük Hacim Profili şurada bulunabilir ve orada 0,786 fib seviyesi (19 sent) 5 boğa osilatörüyle birlikte koşullu bir "İnanılmaz Alım" basılıyor. Stokastik Aşırı Satış. Uzun vadeli Boğalar artık pozisyonlarına dolar maliyet ortalaması uyguluyor olmalı. 17 - 19 sent arası alımlar mükemmel olurdu. Fiyat daha da düşebilir mi? Kesinlikle, zirveleri veya dipleri zamanlamaya çalışmıyorum. Piyasa hissiyatı aşırı derecede düşüş eğiliminde. Finansal sistem akıl almaz derecede karmaşıktır ve Fed dahil hiç kimse, bugüne kadarki en iddialı Nicel Sıkılaştırma programına başlarken her olası senaryoya hazırlıklı olamaz. Bu kripto para birimini nasıl etkileyecek? Bunu ancak zaman gösterecek!XRP güçlü bir destekçi kitlesine sahip ve zamanla Ripple'ın Swift'in bordrosunda bulunan 10.000 finansal kuruluştan müşteri çekmeye devam edeceğine inanıyorum. İyi şanslar! Spekülatif Kurulum, DYOR. Tüm Kripto Fikirleri için 3-18 Ay Süre Verin. Göstergelerin kullanımına izin verdiği için without_worries'e teşekkür ederiz.
bL1TZZ
PolkaDot. In The Golden Pocket.

Piyasa Değeri 6,9 Milyar RSI Ayı Uyumsuzluğu + "İnanılmaz Satış" öncesinde %2.600'lük serin bir yükselişle fiyat 0,5 fib seviyesine geriledi ve ardından yeniden 55 $'lık yüksek seviyesine yükseldi. Fiyat o zamandan beri %88 oranında düzeltme yaptı ve kendisini Altın Cep'te buldu. Ayrıca ilk "İnanılmaz Alış" Sinyalimiz + Stokastik Aşırı Satışımız da var. Bu, alt kısmın içeride olduğu anlamına mı geliyor? Bilmiyorum, zirveleri veya dipleri zamanlamayı denemiyorum. Uzun Vadeli boğalar, 0,786 fib seviyesi olan 4 Dolar seviyesinden yeniden girişle DCA'ya (Dolar Maliyet Ortalaması) sahip olmalıdır, burada bazı büyük Hacim Profilleri bulunabilir. Fiyat daha da düşebilir mi? Kesinlikle! Spekülatif Kurulum, DYOR. Tüm Kripto Fikirleri İçin 3-18 Ay Süre tanıyın. Göstergelerin kullanımına izin verdiği için @without_worries'e teşekkür ederiz.Yorum: Haftalık HA MFI @ 0,02!Yorum: Fiyat 0,786 / POC yeniden yükleme bölgemizden sıçradı. Fiyat o zamandan bu yana yaklaşık %235 oranında artış gösterdi. Şu anda çok büyük bir 7 osilatör, 2 haftalık DOT/BTC grafiğinde uyumsuzluk gösteriyor. Olası bir trend çizgisi kırılması + geri test ve potansiyel olarak büyük bir RSI Boğa Sapması.
bL1TZZ
UniSwap- MFI EXTREMLY Oversold. Bulls Load Up.

Piyasa Değeri 3,1 Milyar RSI Bear Div ve "İnanılmaz Satış" baskılarından önce %2.400'lük hoş bir yükseliş yaşadı. Fiyat o zamandan bu yana %92 oranında düzeltme yaptı ve 0,786 fib seviyesinden yukarıya doğru çekildi. POC ile bu aralıktaki Büyük Hacim Profili yaklaşık 3,80$ Haftalık Heikin Ashi Para Flow Endeksi 0,11'de! Stokastik Aşırı Satış. Uzun Vadeli Boğalar artık DCA'da olmalı. Daha da düşebilir mi? Elbette. Üstleri veya altları zamanlamayı denemiyorum. Spekülatif Kurulum, DYOR. Tüm Kripto Fikirleri İçin 3-18 Ay Süre tanıyın. Göstergelerin kullanımına izin verdiği için @without_worries'e teşekkür ederiz.Yorum:
Sorumluluk Reddi
Sahmeto'nun web sitesinde ve resmi iletişim kanallarında yer alan herhangi bir içerik ve materyal, kişisel görüşlerin ve analizlerin bir derlemesidir ve bağlayıcı değildir. Borsa ve kripto para piyasasına alım, satım, giriş veya çıkış için herhangi bir tavsiye oluşturmazlar. Ayrıca, web sitesinde ve kanallarda yer alan tüm haberler ve analizler, yalnızca resmi ve gayri resmi yerli ve yabancı kaynaklardan yeniden yayınlanan bilgilerdir ve söz konusu içeriğin kullanıcılarının materyallerin orijinalliğini ve doğruluğunu takip etmekten ve sağlamaktan sorumlu olduğu açıktır. Bu nedenle, sorumluluk reddedilirken, sermaye piyasası ve kripto para piyasasındaki herhangi bir karar verme, eylem ve olası kar ve zarar sorumluluğunun yatırımcıya ait olduğu beyan edilir.