
MonoCoinSignal
@t_MonoCoinSignal

Ne tavsiye etmek istersiniz?
önceki makale
پیام های تریدر
filtre
MonoCoinSignal
SOL: The Equilibrium Standoff
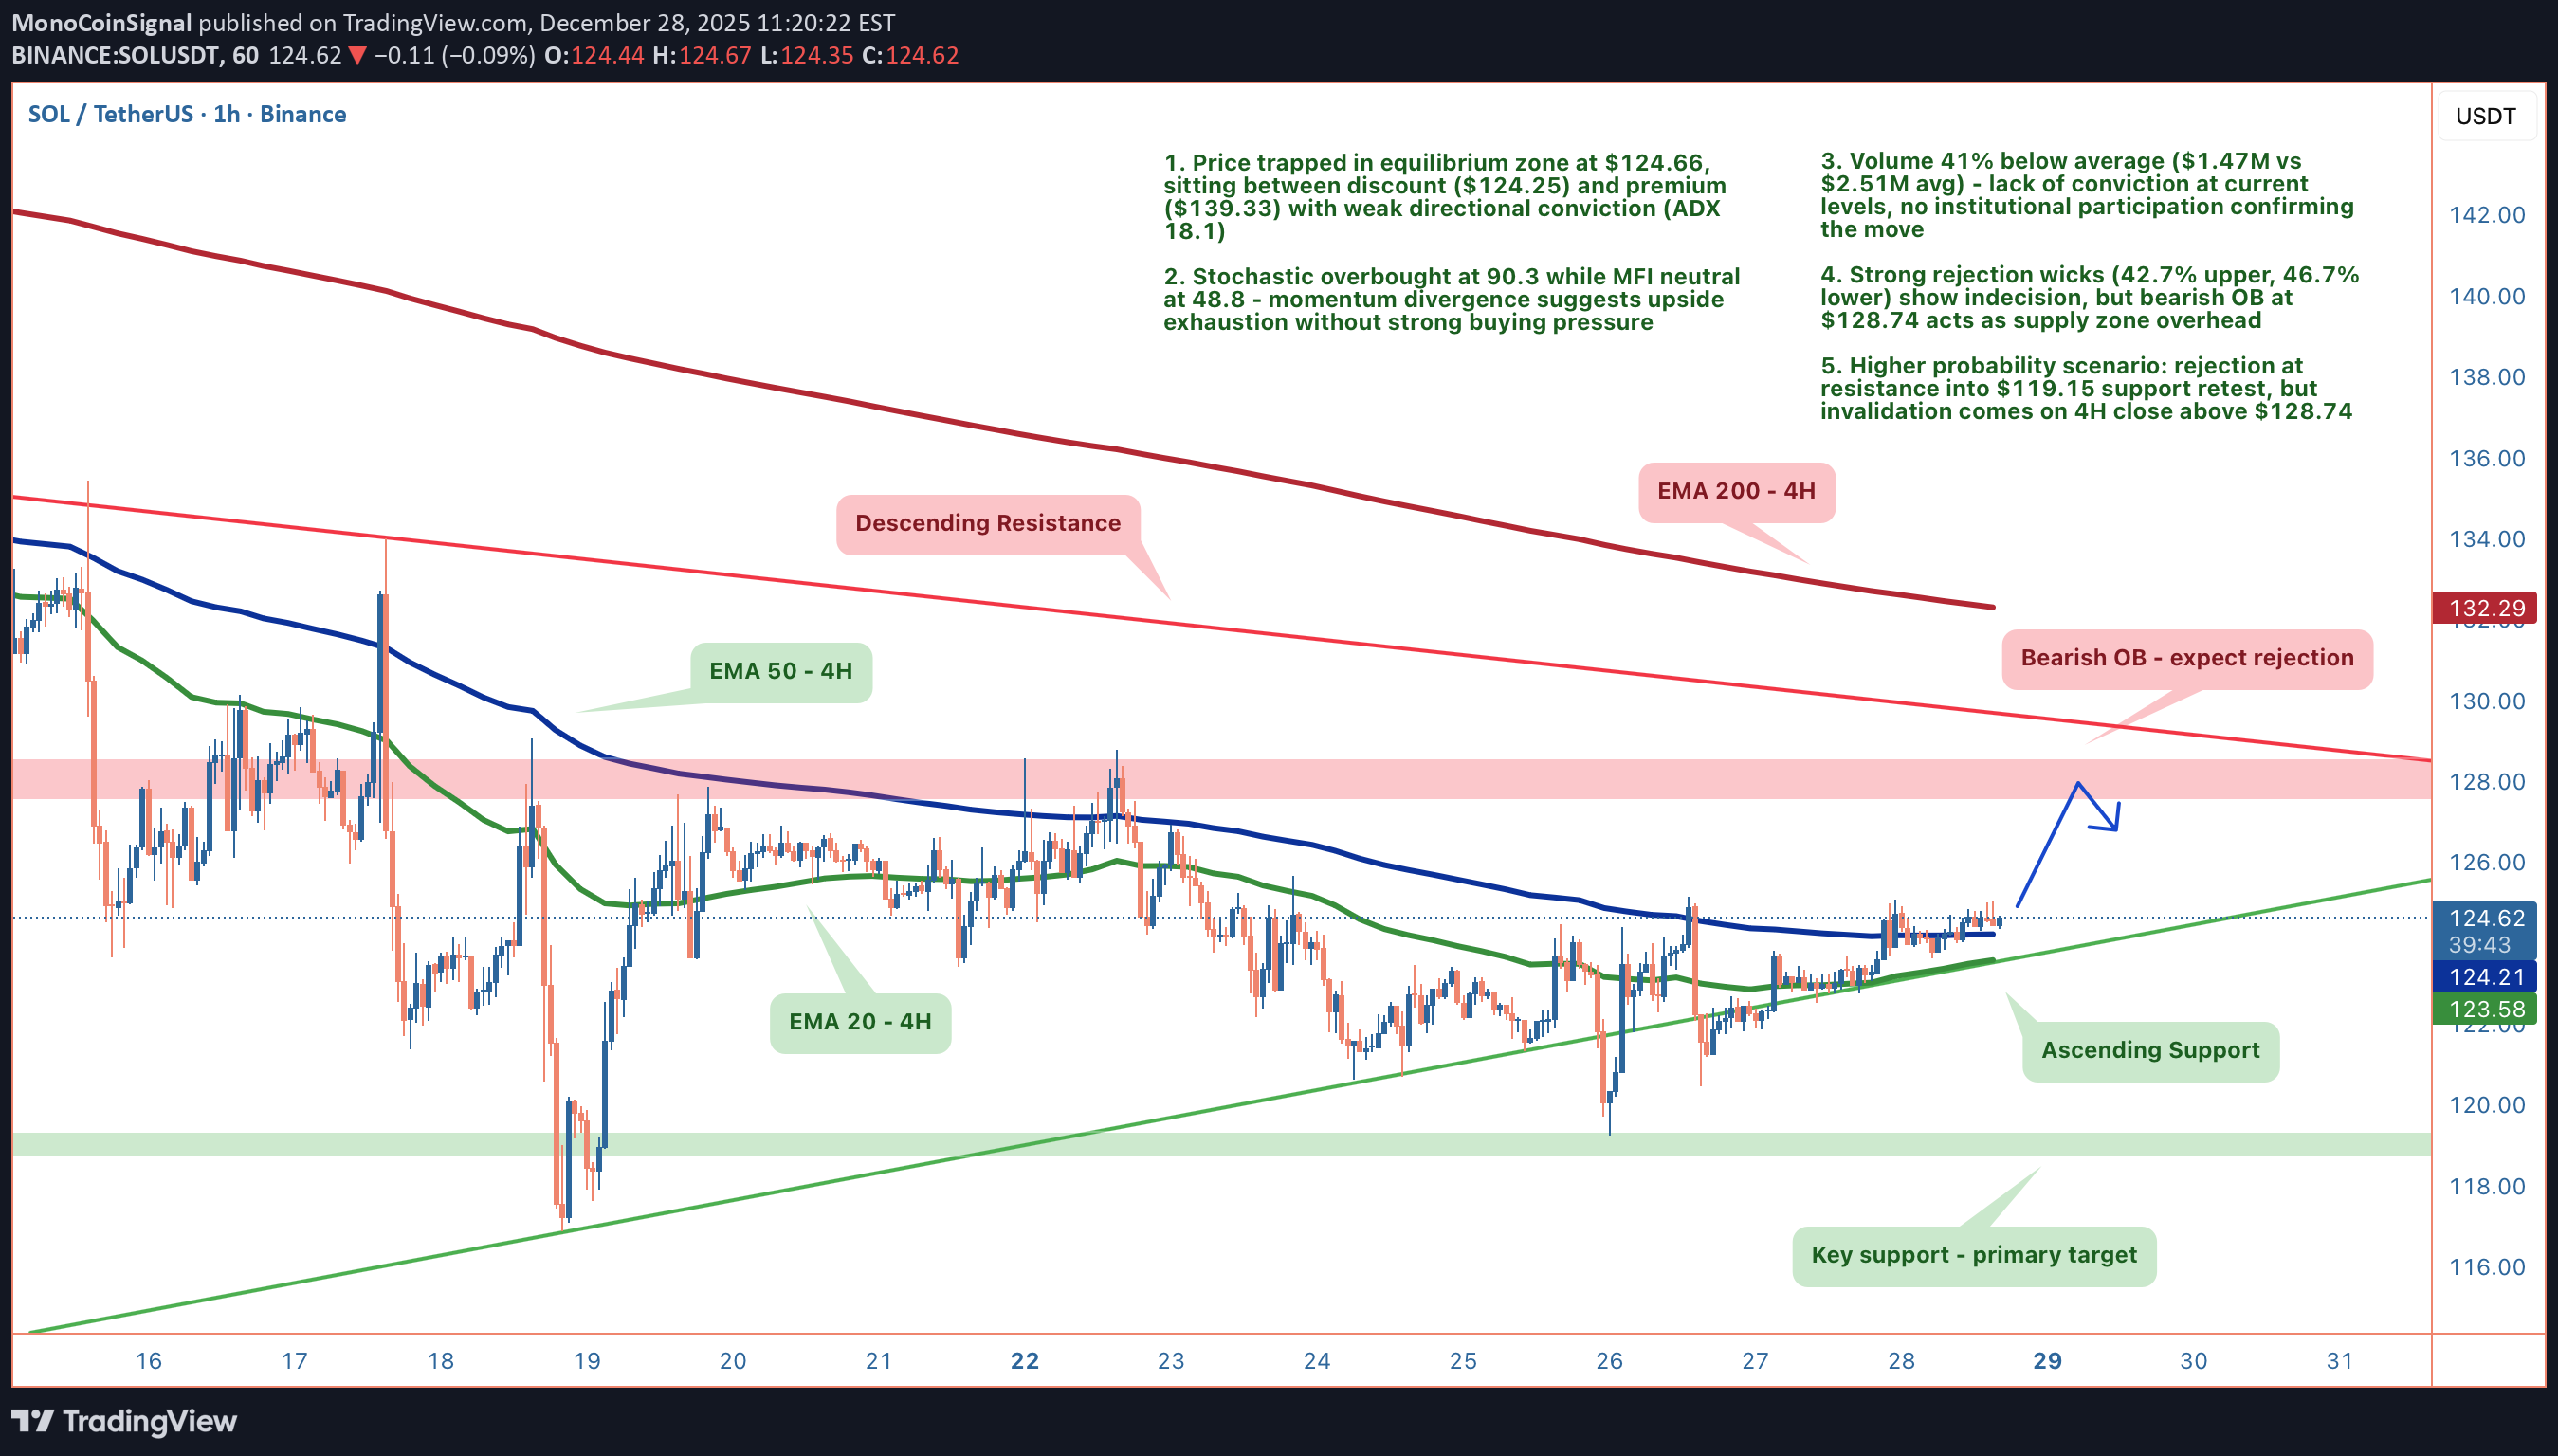
SOL saf dengede 124,66 dolarda duruyor, indirim değil, premium değil, sadece takılıp kaldı. Piyasa yapısı bir kırılmanın sinyalini vermiyor; bu bir ayrılığın sinyalini veriyor. Hacim ortalamanın %41 altında ve momentum göstergeleri çelişkili olduğundan, bu bir hamleyi takip etme ticareti değil, bir çözüm bekleme kurulumudur. 1. TEKNİK GERÇEKLİK 📉 • Fiyat, indirim bölgesi (124,25$) ile premium (139,33$) arasında sıkıştı • Zayıf kanaatle düşüş eğilimi eğilimi (yalnızca ADX 18,1) • Fitil analizi savaş bölgesini gösterir: %46,7 alt fitil (destek) ve %42,7 üst fitil (reddetme) • Hacim ortalama 1,47$M ile 2,51$M seviyesinde, akıllı para görünmüyor 2. GÖSTERGELER ⚖️ Ayı Sinyalleri: • Stokastik çığlıklar 90,3'te aşırı alımda • Ayı emri blok yükü 128,74$'da (temel tedarik bölgesi) • Hacim normalin %41 altında, kurumsal onay yok Boğa Sinyalleri: • MACD yükseliş eğilimini tersine çevirdi (0,2262'ye karşı -0,0791) • RSI nötr 60,8'de • 48,8'de MFI nötr Çatışma: MFI nötr kalırken stokastik aşırı alım, bu momentum farklılığıdır. Göstergeler uyuşmadığında, mevcut move yakıtla değil dumanla çalışmaktadır. 3. TİCARET KURULUMU 🎯 🔴 Senaryo A: Reddetme ve Yeniden Test (Daha Yüksek Olasılık) • Tetikleyici: 128,74$'lık düşüş OB'sinde reddedilme • Giriş: 123,42 doların altındaki dağılım (FVG dolgusu) • Hedef: 119,15$ düşük destek salınımı • Dur: 4 saat 128,74 doların üzerinde kapandı 🟢 Senaryo B: Yapı Değişimi (Düşük Olasılık) • Tetikleyici: 139,33$'lık premium bölgenin geri alınması • Giriş: 4 saat 128,74 doların üzerinde kapandı • Hedef: Karakter Değişimi (CHoCH) yükselişi • Geçersiz kılma: 128,74 doların altına reddedilme KARARIM %62 güven düşüş eğiliminde. Kurulum, direncin yeniden test edilmesine yönelik reddedilmeyi tercih ediyor, ancak zayıf trend gücü (ADX 18.1), bunun çözümlenmeden önce yana doğru kesilebileceği anlamına geliyor. İnancın düşük olduğu ortamlarda takası zorlamıyorum, risk yönetimi satranç ve dama arasındaki farktır.
MonoCoinSignal
LINK: The Spring is About to Break
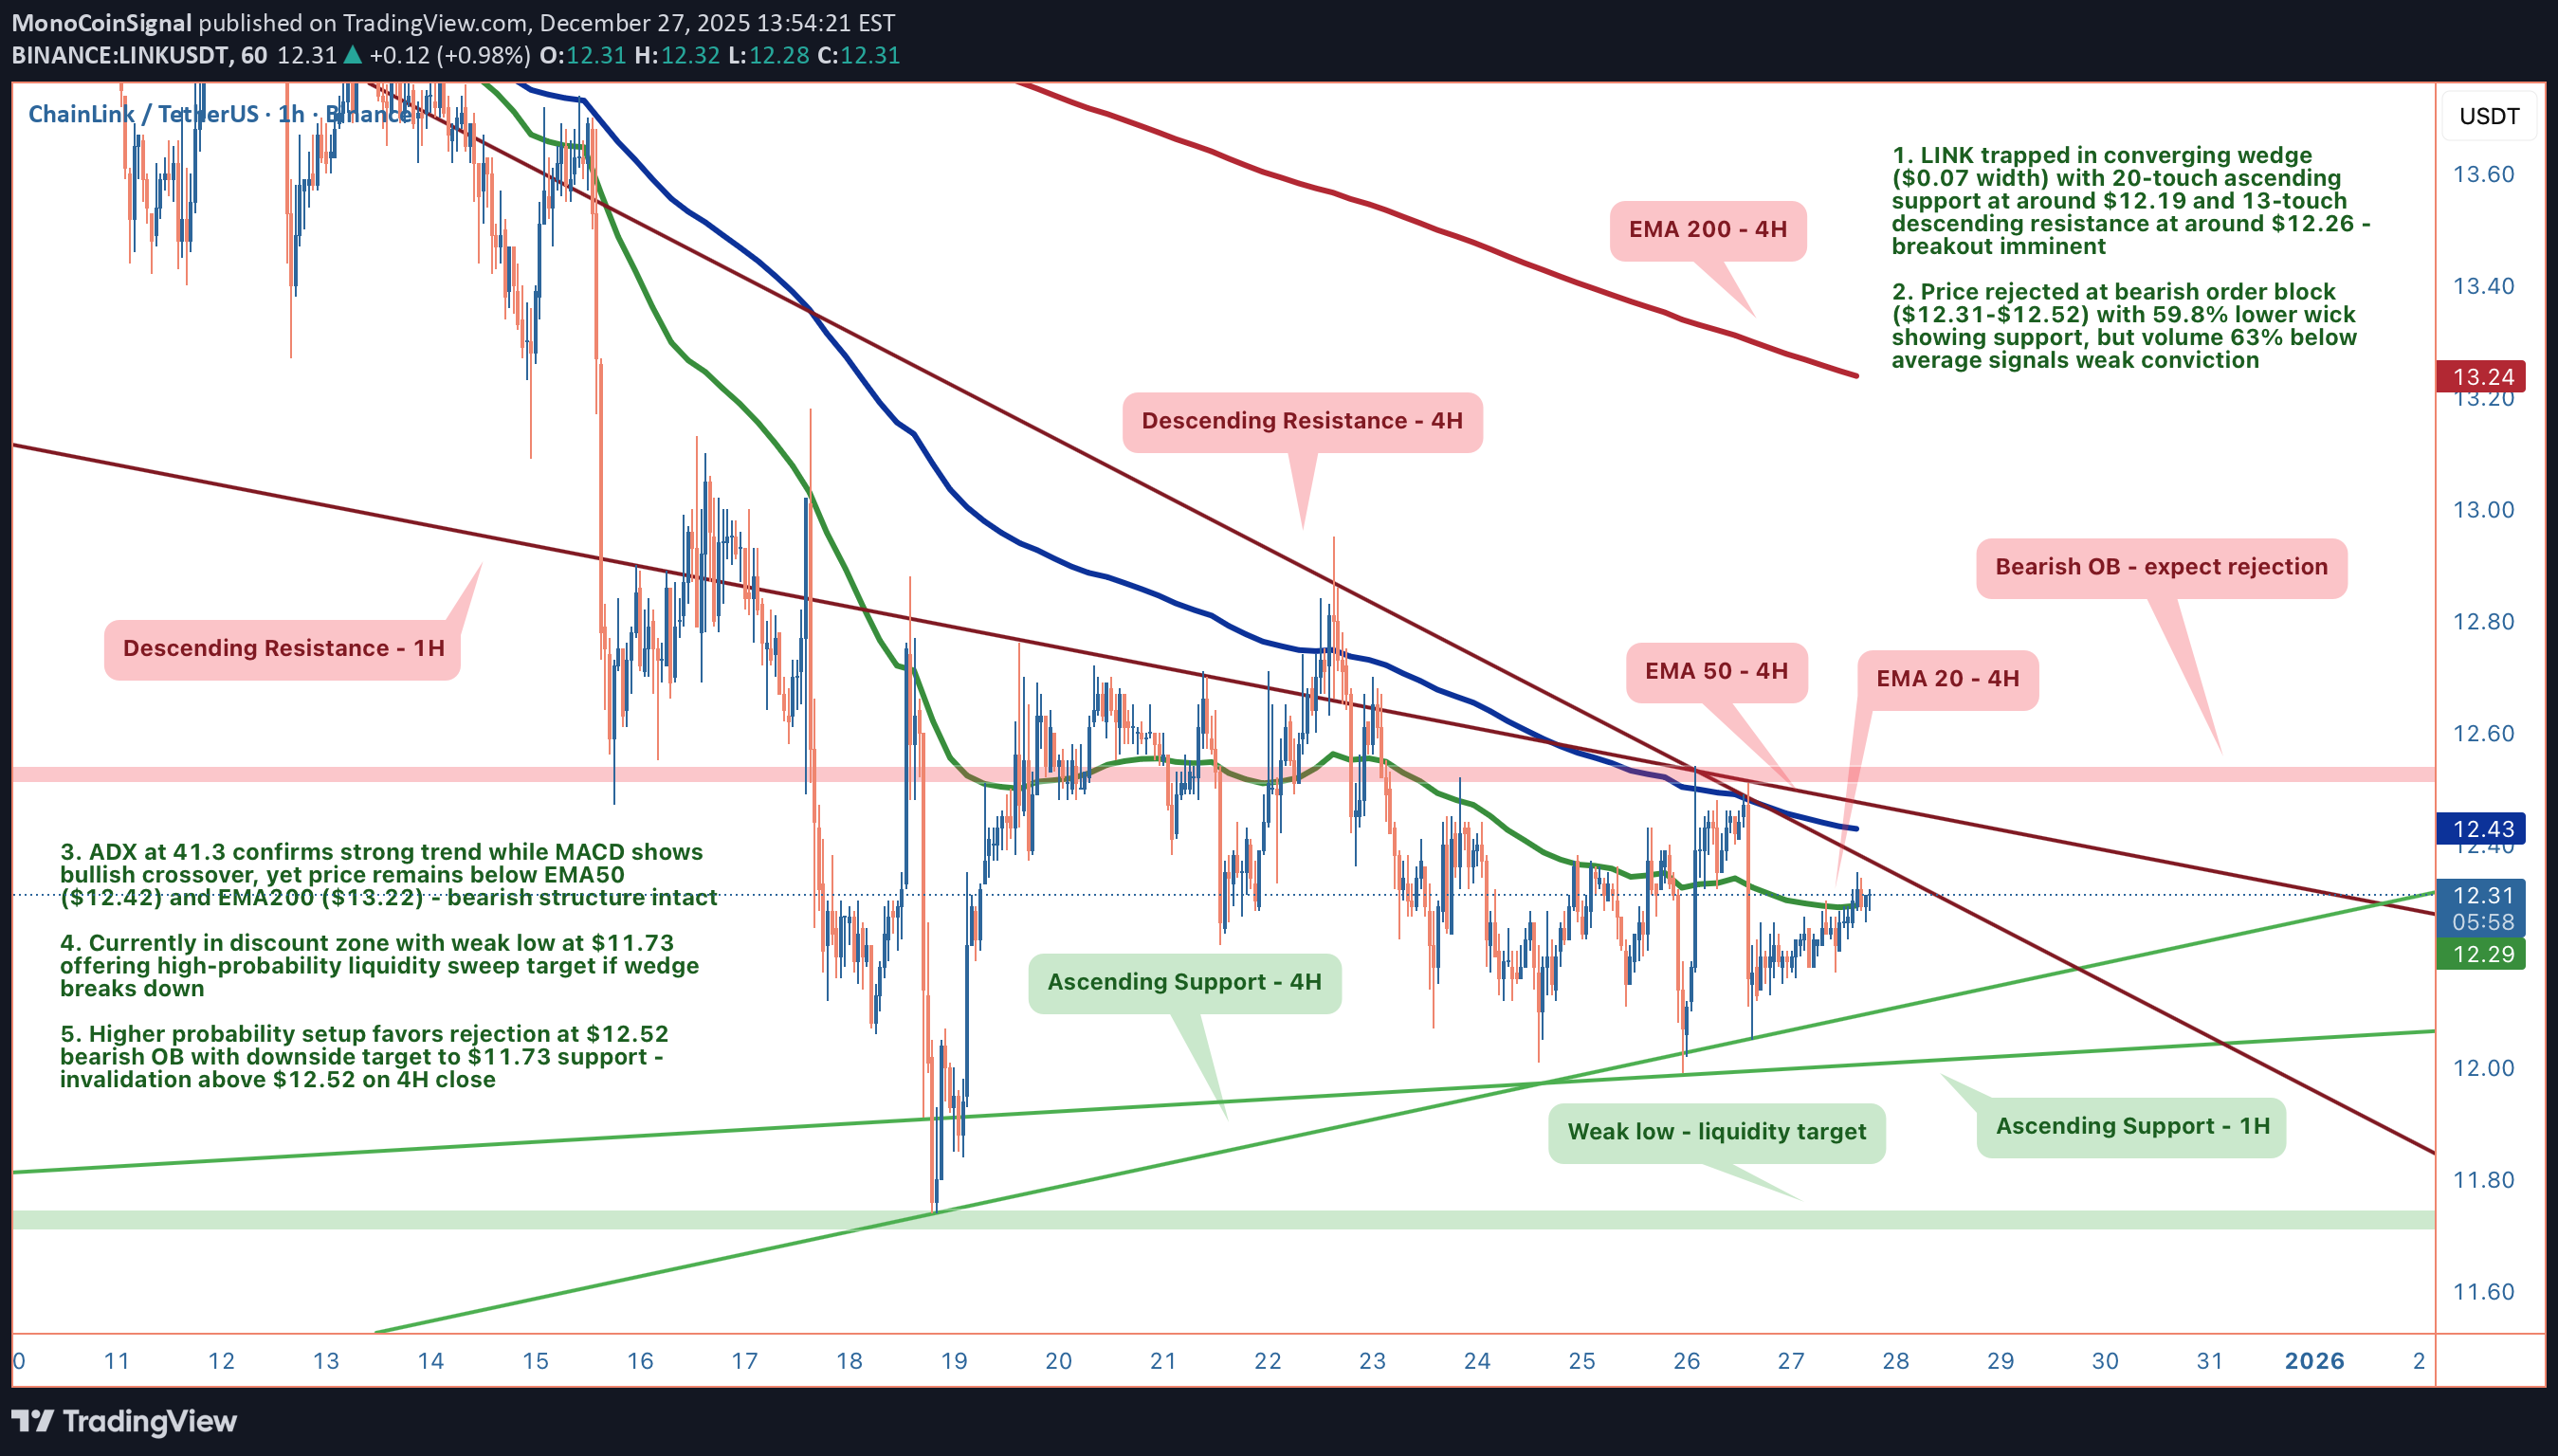
Sadece 0,07 dolarlık yer kalan bir ders kitabının zirvesinde oturuyoruz. 20'si yükselen desteğe (12,19 dolar), 13'ü azalan dirence (12,26 dolar) dokunuyor ve fiyat şu anda 12,30 dolarda. Sarmal yay senaryosu burada; sonraki birkaç çubukta bir şeyler ortaya çıkıyor. 1. TEKNİK GERÇEKLİK 📉 • Kama sıkıştırma: Genişlik 467 çubukta 14,62 dolardan 0,07 dolara daraldı; zirveye ulaşıldı • Makro yapısı: EMA50 (12,42 $) ve EMA200 (13,22 $) altındaki fiyat — düşüş eğilimi bozulmadan • Mevcut konum: Orta Bollinger Band (12,27 $) test ediliyor, EMA20'nin (12,29 $) hemen üzerinde • ADX 41.3'te: Güçlü trend ortamı onaylandı 2. GÖSTERGELER ⚖️ Ayı Sinyalleri: • Arz görevi gören 12,31-12,52$ seviyesindeki ayı emri blok yükü • Hacim ortalamanın %63 altında (1,66$'a karşılık 622.000$M) — sıçrama konusunda zayıf kanaat • İndirim bölgesindeki ticarete rağmen düşüş eğilimi görülüyor • Üst fitil %29,3 dirençte ret gösteriyor Boğa Sinyalleri: • MACD yükseliş geçişi (MACD -0,0311, Sinyal -0,0451'in üzerinde) • Güçlü destek girişimlerini gösteren alt fitil %59,8 • 12,21$-12,63$ seviyesindeki yükseliş emri bloğu, talep sağlıyor • RSI nötr 54,4'te, MFI 67,3'te (yüksek ancak aşırı değil) Çatışma: MACD momentum değişimini öneriyor ancak hacim bunun tersini söylüyor story. Bu sıçramanın arkasında inanç olmasa da, %59,8'lik alt fitil güçten ziyade kararsızlığı temsil ediyor. Yapı burada osilatörleri gölgede bırakıyor. 3. TİCARET KURULUMU 🎯 🔴 Senaryo A: Takoz Kırılımı (Daha Yüksek Olasılık - %68) • Tetikleyici: 4 saatlik kapanış 12,21 doların altında (yükseliş OB desteği kırılması) • Giriş: Hacim ile 12,21 doların altında onay • Hedef: 11,73 $ (zayıf düşük likidite taraması, %4,70 mesafe) • Dur: 4 saatlik kapanış 12,52 doların üzerinde Mantık: Fiyat 12,52 $'lık düşüş OB'sini reddediyor (azalan dirençle aynı hizada), 20 dokunuşlu artan desteği 12,19 $'dan kırıyor, korumasız alıcı tarafı likiditesinin bulunduğu 11,73 $'da eşit düşükleri süpürüyor. Yakınlaşan takozlar genellikle önceki trendin (aşağı yönlü trend) yönünde kırılır. 🟢 Senaryo B: Çıkışın Tersine Dönmesi • Tetikleyici: Hacim ile 12,52 doların üzerinde kesin bir kırılma • Giriş: 4 saatlik kapanış 12,52 doların üzerinde (aşağı yönlü OB + azalan direnci kırdı) • Hedef: 14,19 $ (premium bölge eşiği, CHoCH yükselişini tetikler) • Geçersiz kılma: 12,52 doların altına reddedilme Mantık: 14,19 doların geri alınması tüm düşüş yapısını geçersiz kılıyor ve boğaların kontrolü elinde tuttuğuna işaret ediyor. EMA50/200'ün altındaki konumlandırma ve düşüş eğilimi eğilimi göz önüne alındığında, bu sonuca daha düşük bir olasılık atfediliyor. KARARIM Risk ödülü çöküşü destekler. Hacmin 12,19 dolara 20 dokunuşla yükselen desteği, satışı hızlandıran önemli bir teknik olay olacaktır. Önden koşmak yerine onay bekleyin; kama apeksi sizin önyargınızı umursamaz, flow sırasına göre kırılır.
MonoCoinSignal
بیت کوین در آستانه صعود: منتظر اصلاح یا شکست قیمتی بمانیم؟
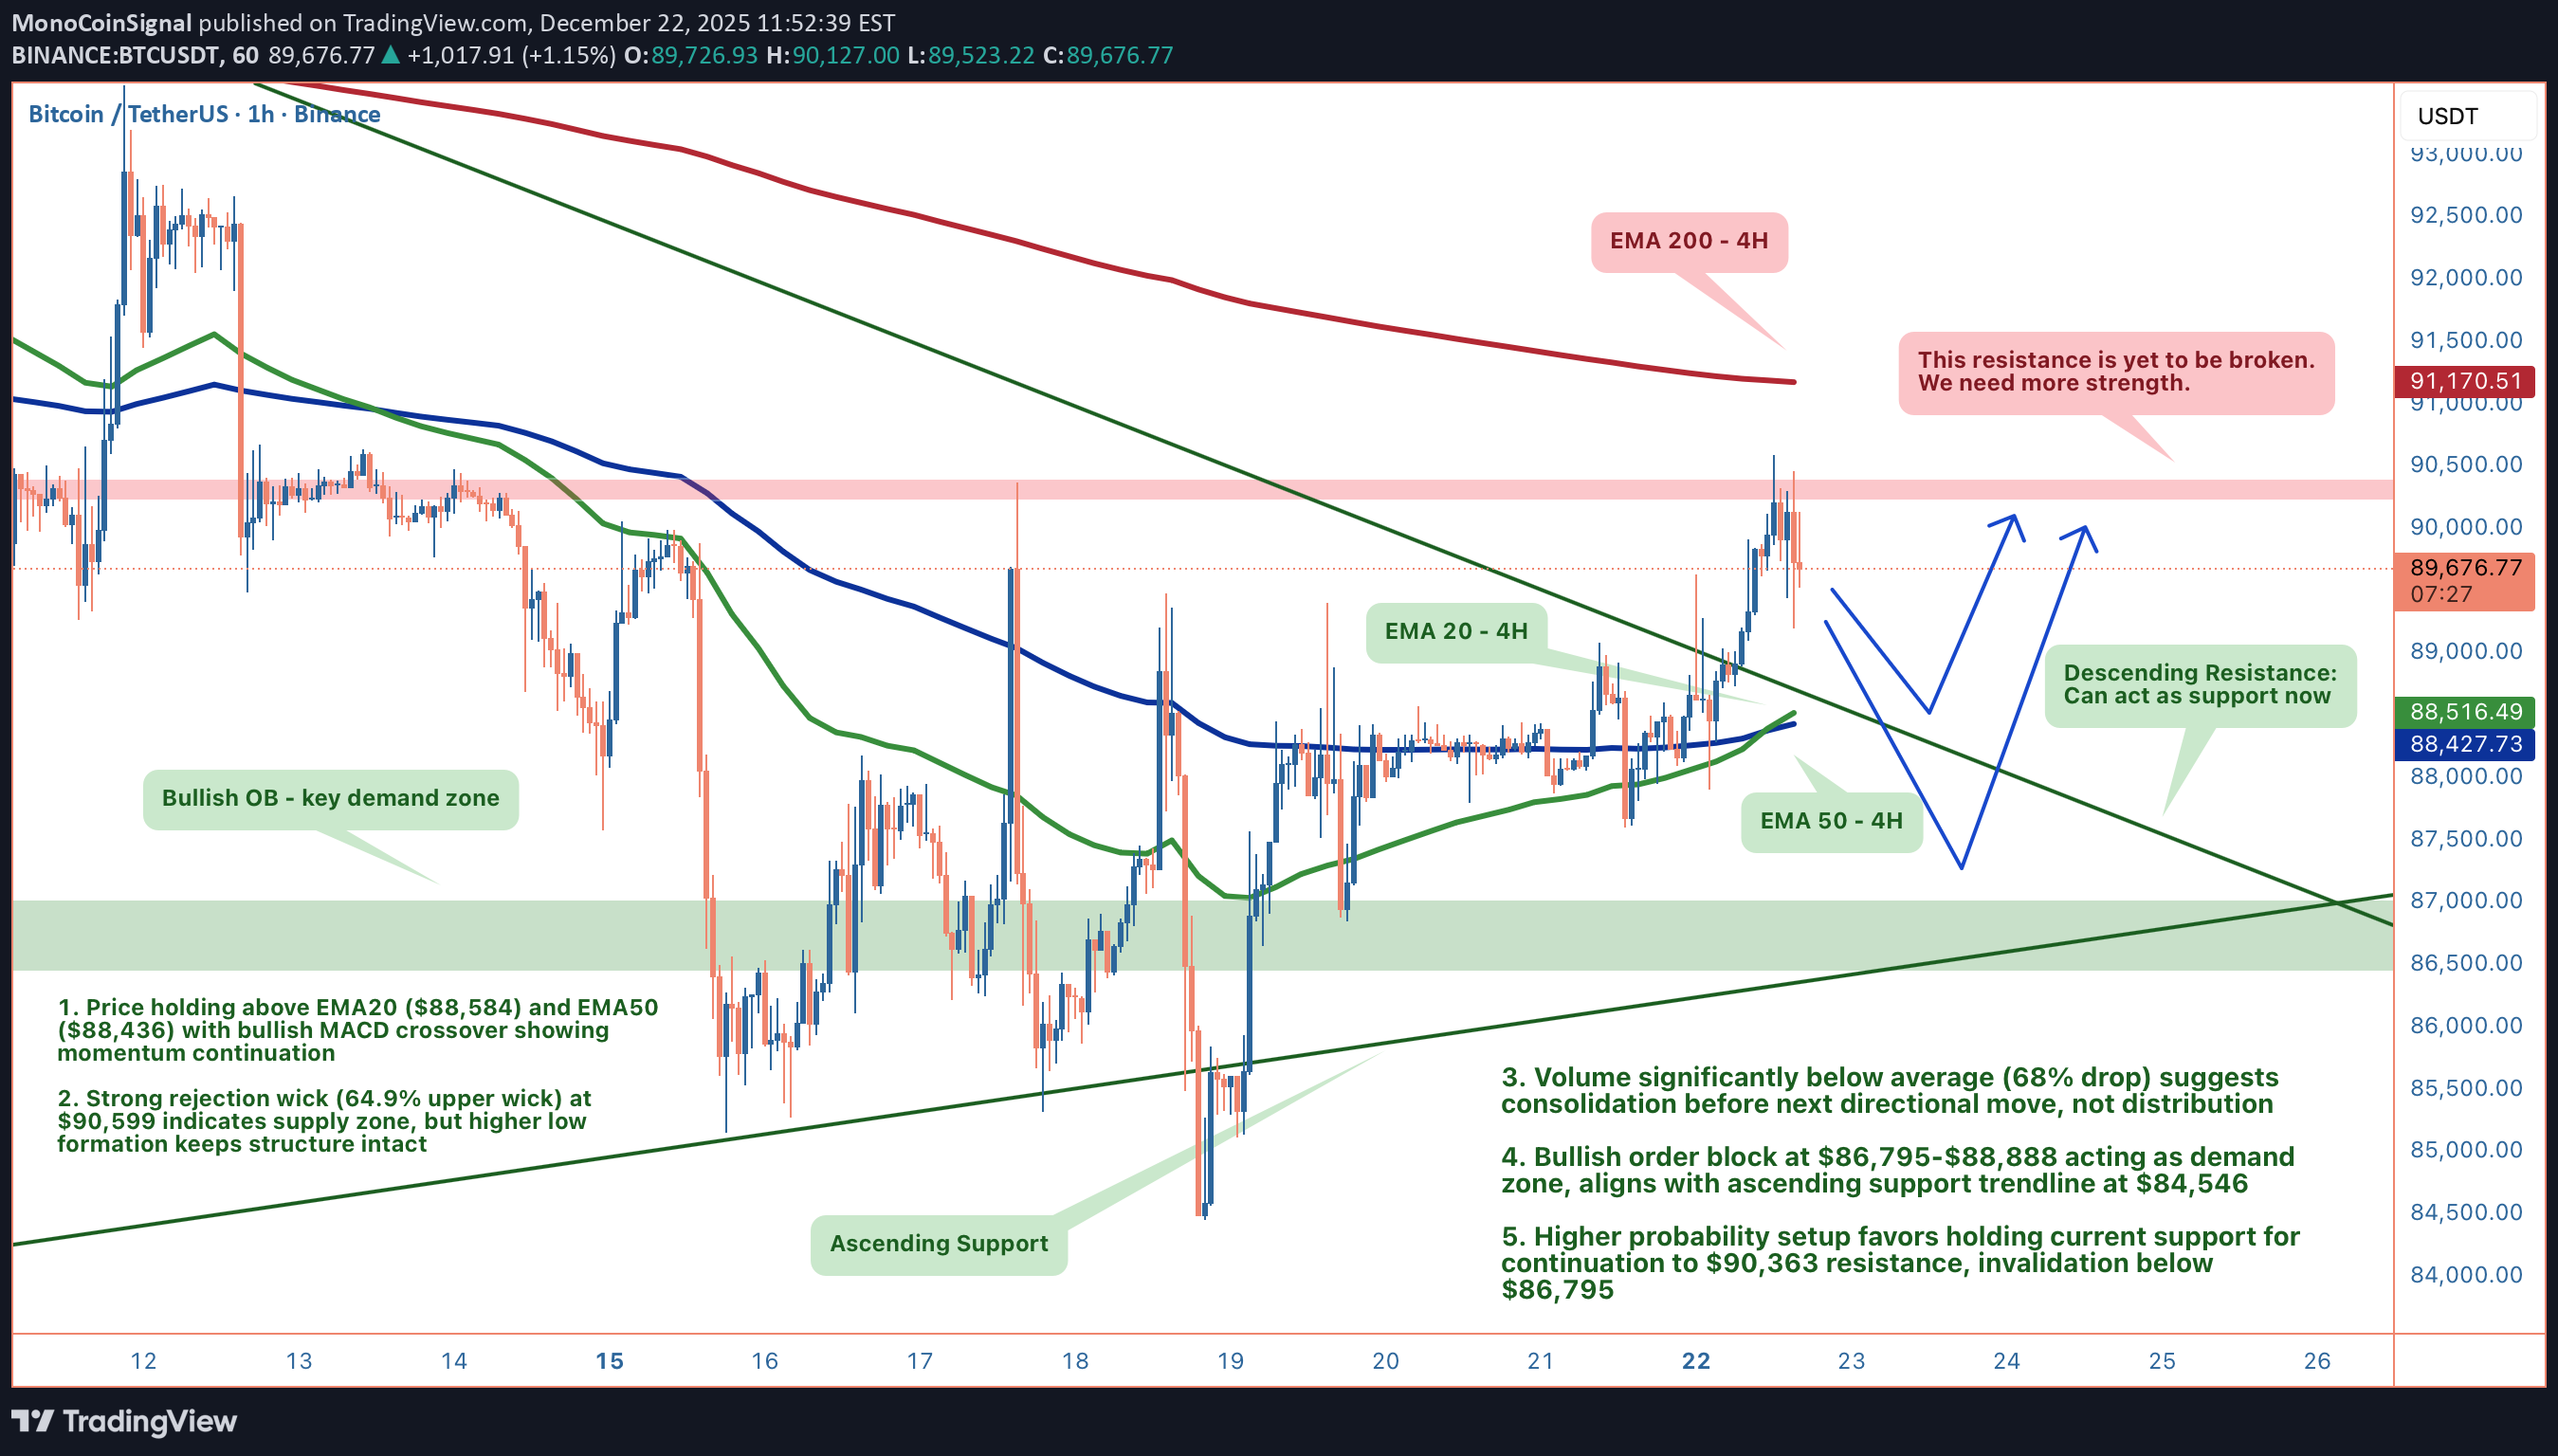
Her iki EMA'nın üzerinde bozulmadan temiz, daha yüksek bir düşük formasyonla dengede (89.619 $) oturuyoruz. Yapı devamı destekliyor ancak 90.599 dolardaki %64,9'luk ret fitili saygı duymamız gereken bir arz bölgesi yarattı. Hacim ortalamanın %68 altında; bu dağıtım değil konsolidasyondur. 1. TEKNİK GERÇEKLİK 📉 • EMA20 (88.584$) ve EMA50 (88.436$) üzerinde daha yüksek düşük formasyon tutunması • Agresif reddedilme sonrasında arz görevi gören 89.429$-90.617$ seviyesindeki ayı emri bloğu • Yükselen trend çizgisiyle uyumlu 86.795$-88.888$ seviyesindeki yükseliş emri bloğu (4 dokunuş, 127 çubuk doğrulandı) • Üstteki fitile rağmen yapı bozulmadan kalıyor; 89.200$'daki destek korunuyor 2. GÖSTERGELER ⚖️ Boğa Sinyalleri: • MACD geçişi onaylandı (476'ya karşı 308) momentum artışını gösteriyor • 75,5'teki MFI paranın güçlü olduğunu gösterir flow • 30.2'deki ADX orta derecede yönelimli kanaati gösterir Ayı Sinyalleri: • RSI 67,7'de aşırı alım bölgesine yaklaşıyor • Ortalamanın %68 altındaki hacim, ani bir kırılma konusunda dikkatli olunması gerektiğini gösteriyor Çatışma: Düşük hacim genellikle bu seviyelerde dağıtıma değil birikime işaret eder. Soru, bir sonraki etaptan önce talep bölgesine bir kez daha geçiş yapıp yapamayacağımızdır. 3. TİCARET KURULUMU 🎯 🟢 Senaryo A: Geri Çekme Girişi (Daha Yüksek Olasılık) • Tetikleyici: 89.200 $'a geri çekilme veya 86.795-88.888 $ yükseliş OB'sine geçiş • Giriş: 86.795$-88.888$ talep bölgesi (84.546$'da yükselen trend çizgisiyle kesişme) • Hedef 1: 90.363 Dolar (anlık direnç) • Hedef 2: 91.066 ABD doları (premium bölgeye giriş) • Hedef 3: 94.555$ (zayıf yüksek tarama) • Dur: 86.700 doların altında 🟢 Senaryo B: Çıkış Hızlandırması • Tetikleyici: Hacim onayıyla 4 saatlik kapanış 91.066 doların üzerinde gerçekleşti • Giriş: Destek için 91.066 Dolarlık dönüş (CHoCH yükseliş) • Hedef: 94.555$ • Geçersiz kılma: 4 saat 86.795 doların altında kapandı (yükseliş OB'sini ve trend çizgisini kırdı) KARARIM Bu sabrı destekleyen 7/10'luk bir kurulumdur. Yapı sağlam, göstergeler uyumlu ancak hacim kaygıları ve genel arz bölgesi bunun mükemmel olmasını engelliyor. Konumlandırılmışsanız 86.700 doların altında durun. Eğer bekliyorsanız, talebin geri çekilmesi sizin girişinizdir.
MonoCoinSignal
ADA: سیگنالهای متضاد بازار؛ آیا ریزش در راه است؟
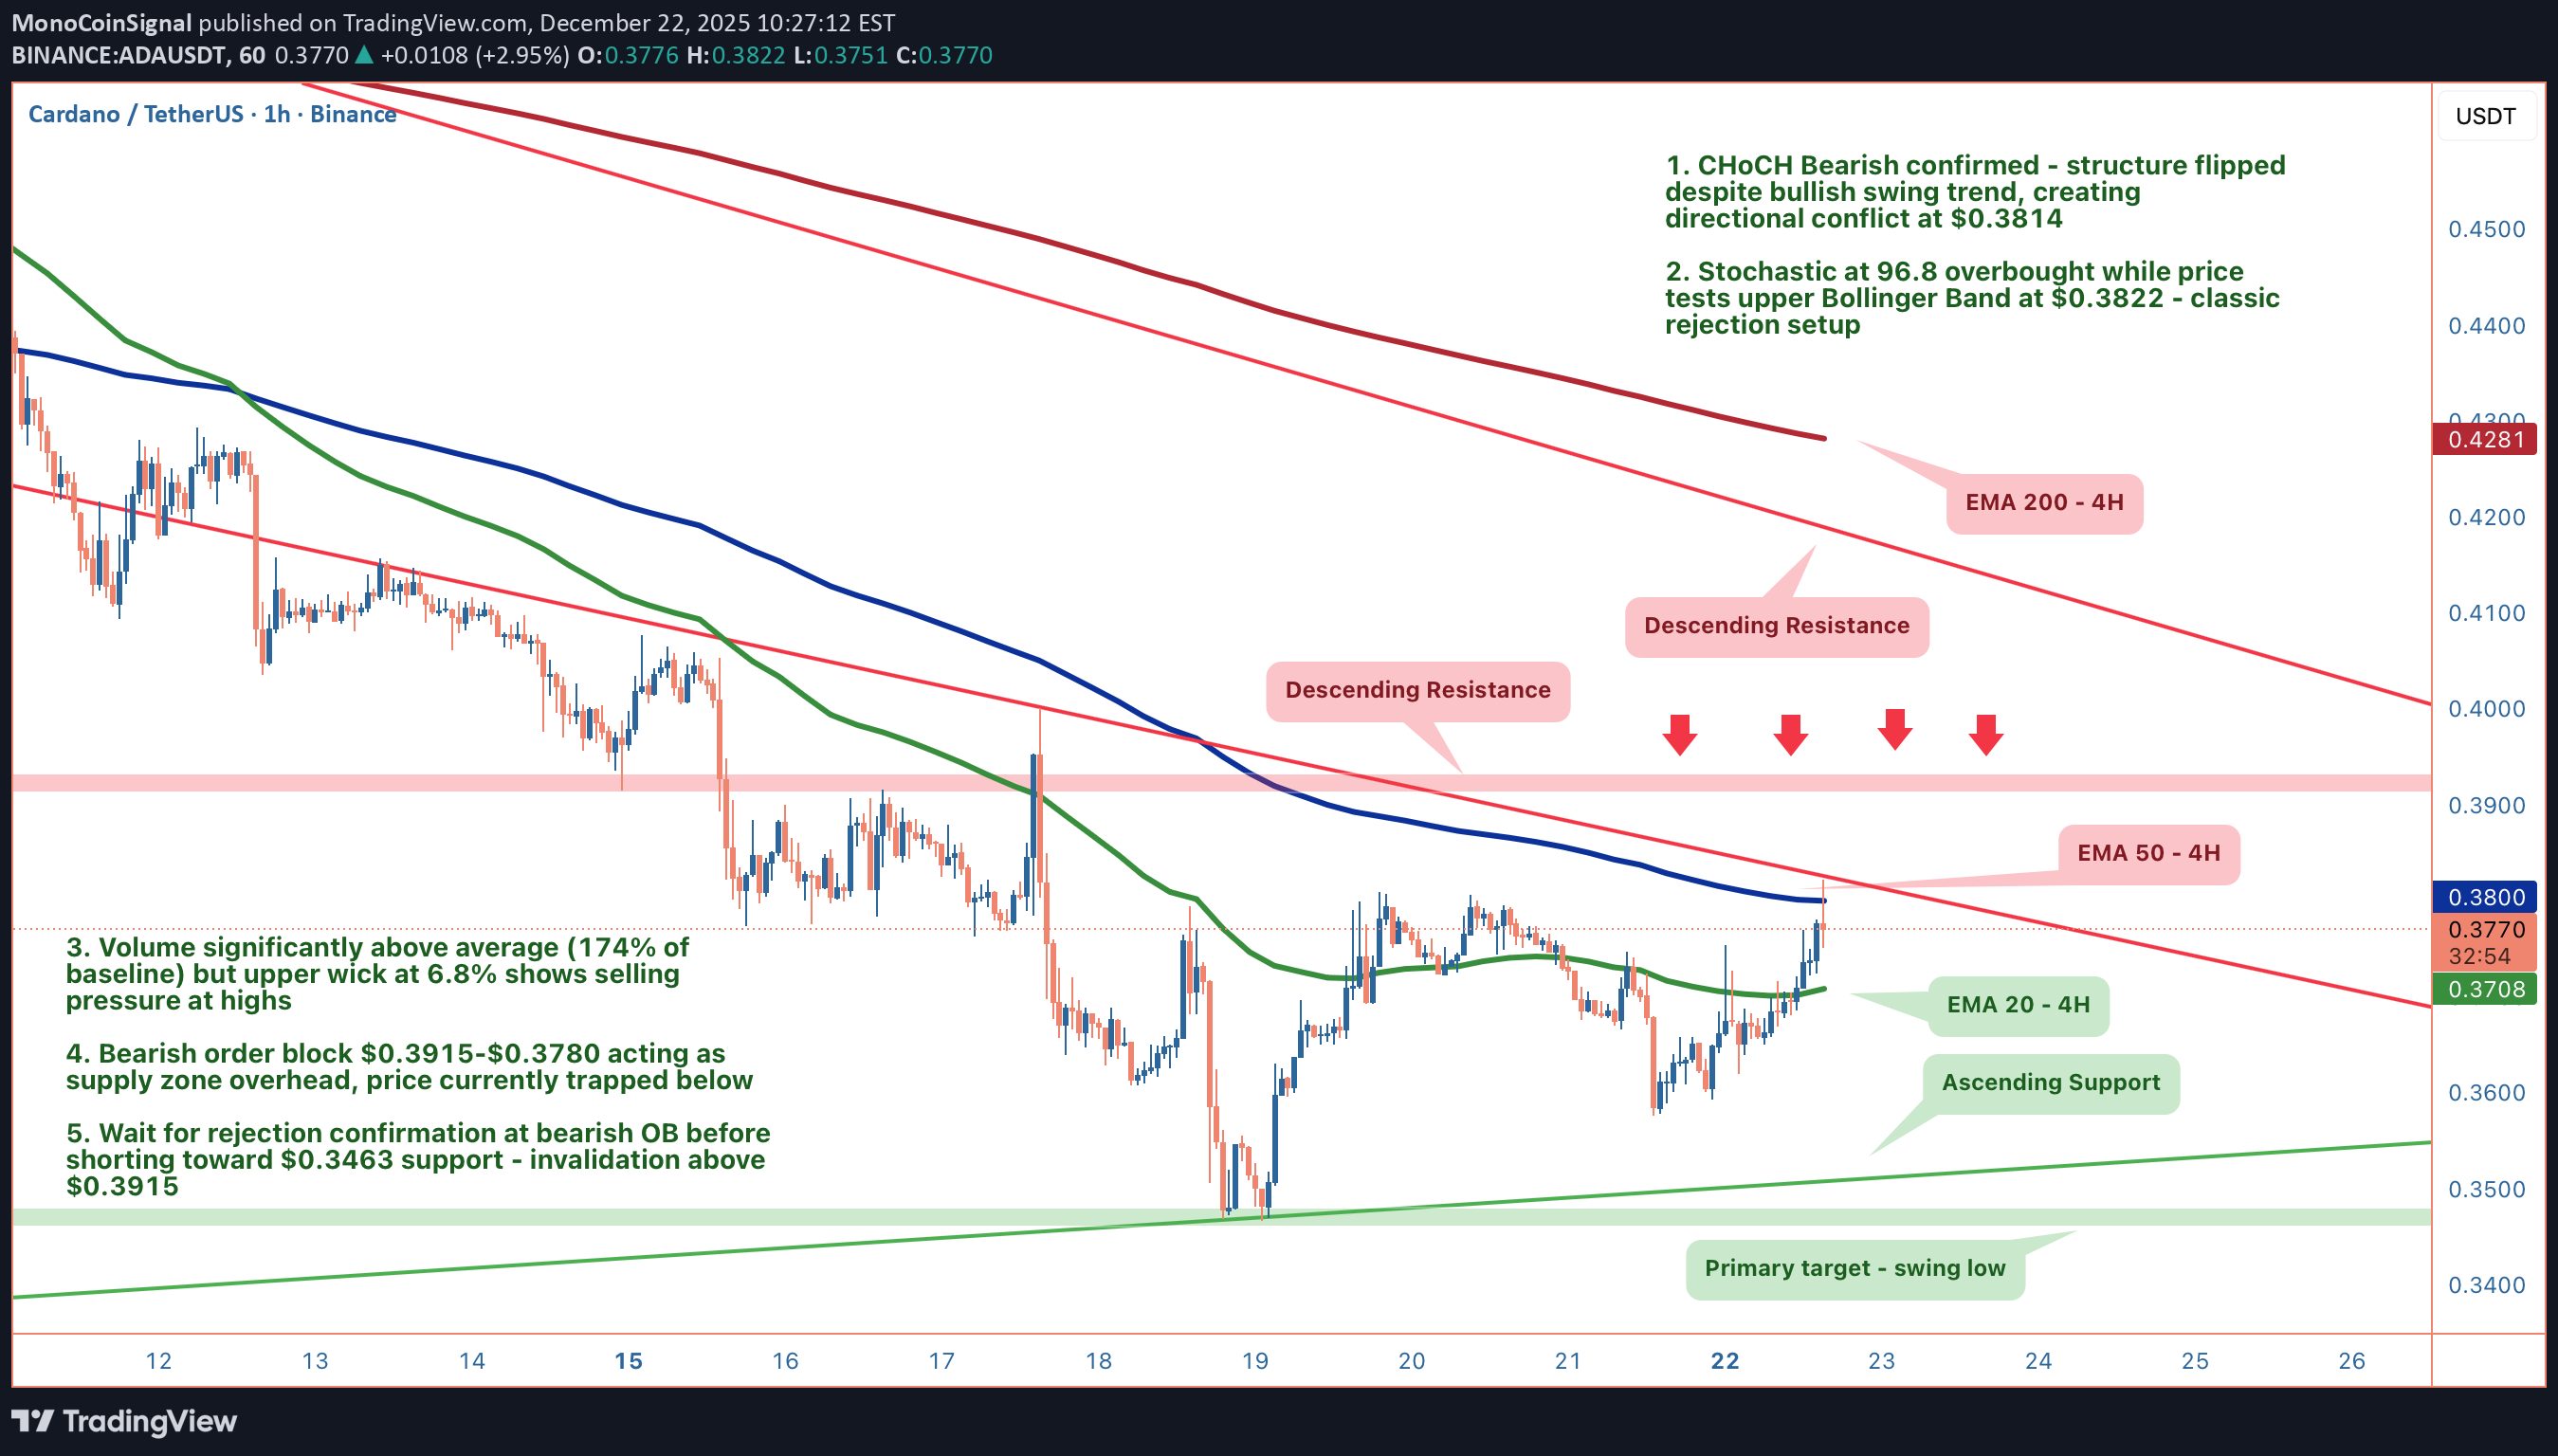
Fiyat az önce %5,89 artışla 0,3814 dolara yükseldi, bu da görünüşte yükselişe işaret ediyor. Ancak çelişki şu: Onaylanmış bir CHoCH Ayı sinyali aldık; salınım trendi hala yükseliş eğilimi göstermesine rağmen yapı aşağı doğru döndü. Yapı ve trend uyuşmadığı zaman yapıya dikkat ediyorum. Bize 20 bar önce olanları değil, şu anda olanları anlatıyor. 1. TEKNİK GERÇEKLİK 📉 • Stokastik 96,8'i vurdu; aşırı alım bölgesi • Üst Bollinger'ı Band öpen fiyat 0,3822$'dır • Mevcut mumun %6,8 üst fitili = satıcılar bu yüksek seviyelere geldi • Ortalamanın %174 üzerindeki hacim katılımı doğruluyor ancak fitil oluşumu birikime değil dağıtıma işaret ediyor • Dengenin (0,4271 $) altındaki indirim bölgesinde işlem yapmak, ancak bu yükselişi sağlamıyor; bu sadece yeni, daha düşük bir aralığın üst yarısı olabilecek bir aralığın alt yarısında olduğumuz anlamına geliyor 2. GÖSTERGELER ⚖️ Ayı Sinyalleri: • CHoCH Ayı teyit edildi; piyasa yapısı aşağıya doğru döndü • Stokastik 96,8 (aşırı alım) • Fiyat Bollinger Band seviyesinde %6,8 fitil ile reddedildi • Ayı emri blok yükü 0,3915-0,3780$ (tedarik bölgesi) seviyesinde Boğa Sinyalleri: • RSI 57,6 (nötr, aşırı satım değil) • MACD yükseliş momentumunu gösteriyor (zayıf ama mevcut) • Fiyat hem EMA20'nin hem de EMA50'nin üzerinde • Swing trendi teknik olarak hala yükselişe işaret ediyor Çatışma: Yapı aşağı diyor, momentum yukarı diyor. Bu yüzden güvenim %85 değil %68. Kurulumun avantajları var, ancak onay gerektiriyor; reddetmeyi ön plana çıkarmayın. 3. TİCARET KURULUMU 🎯 🔴 Senaryo A: Reddetme ve Devam Etme Daha Düşük • Tetikleyici: 0,3915 dolarlık düşüş OB'sinde düşüş eğilimi reddi (yutan mumlara veya güçlü fitillere dikkat edin) • Giriş: Tedarik bölgesinde ret onayı 0,3915$-0,3780$ • Hedef: 0,3463 ABD doları (düşük destek) • Dur: 4 saatlik kapanış 0,3915 doların üzerinde (tez geçersiz kılındı) • İkincil Destek: 0,3463 dolar kırılırsa 0,3500 dolara yükselen trend çizgisi 🟢 Senaryo B: Yükselişin Geri Kazanımı • Tetikleyici: 4 saatlik kapanış 0,4554 doların üzerinde • Sonuç: CHoCH Yükselişi onaylandı; düşüş eğilimi masadan kalkıyor • Geçersiz kılma: Tüm düşüş tezi 0,3915 doların üzerine çıktı KARARIM Olasılık reddedilmeyi tercih eder ve move daha düşüktür. Azalan bir kanalın alt sınırını arz yükü ve dirençteki aşırı alım okumalarıyla işlem görüyoruz. Ancak bu bir smaç değil; fiyatın bu düşüş yönlü OB'de elini göstermesini bekleyin. Risk yönetimi kritik öneme sahiptir: geçersiz kılma durumunuz net bir şekilde 0,3915 ABD dolarıdır.
MonoCoinSignal
AAVE: The Squeeze Is On
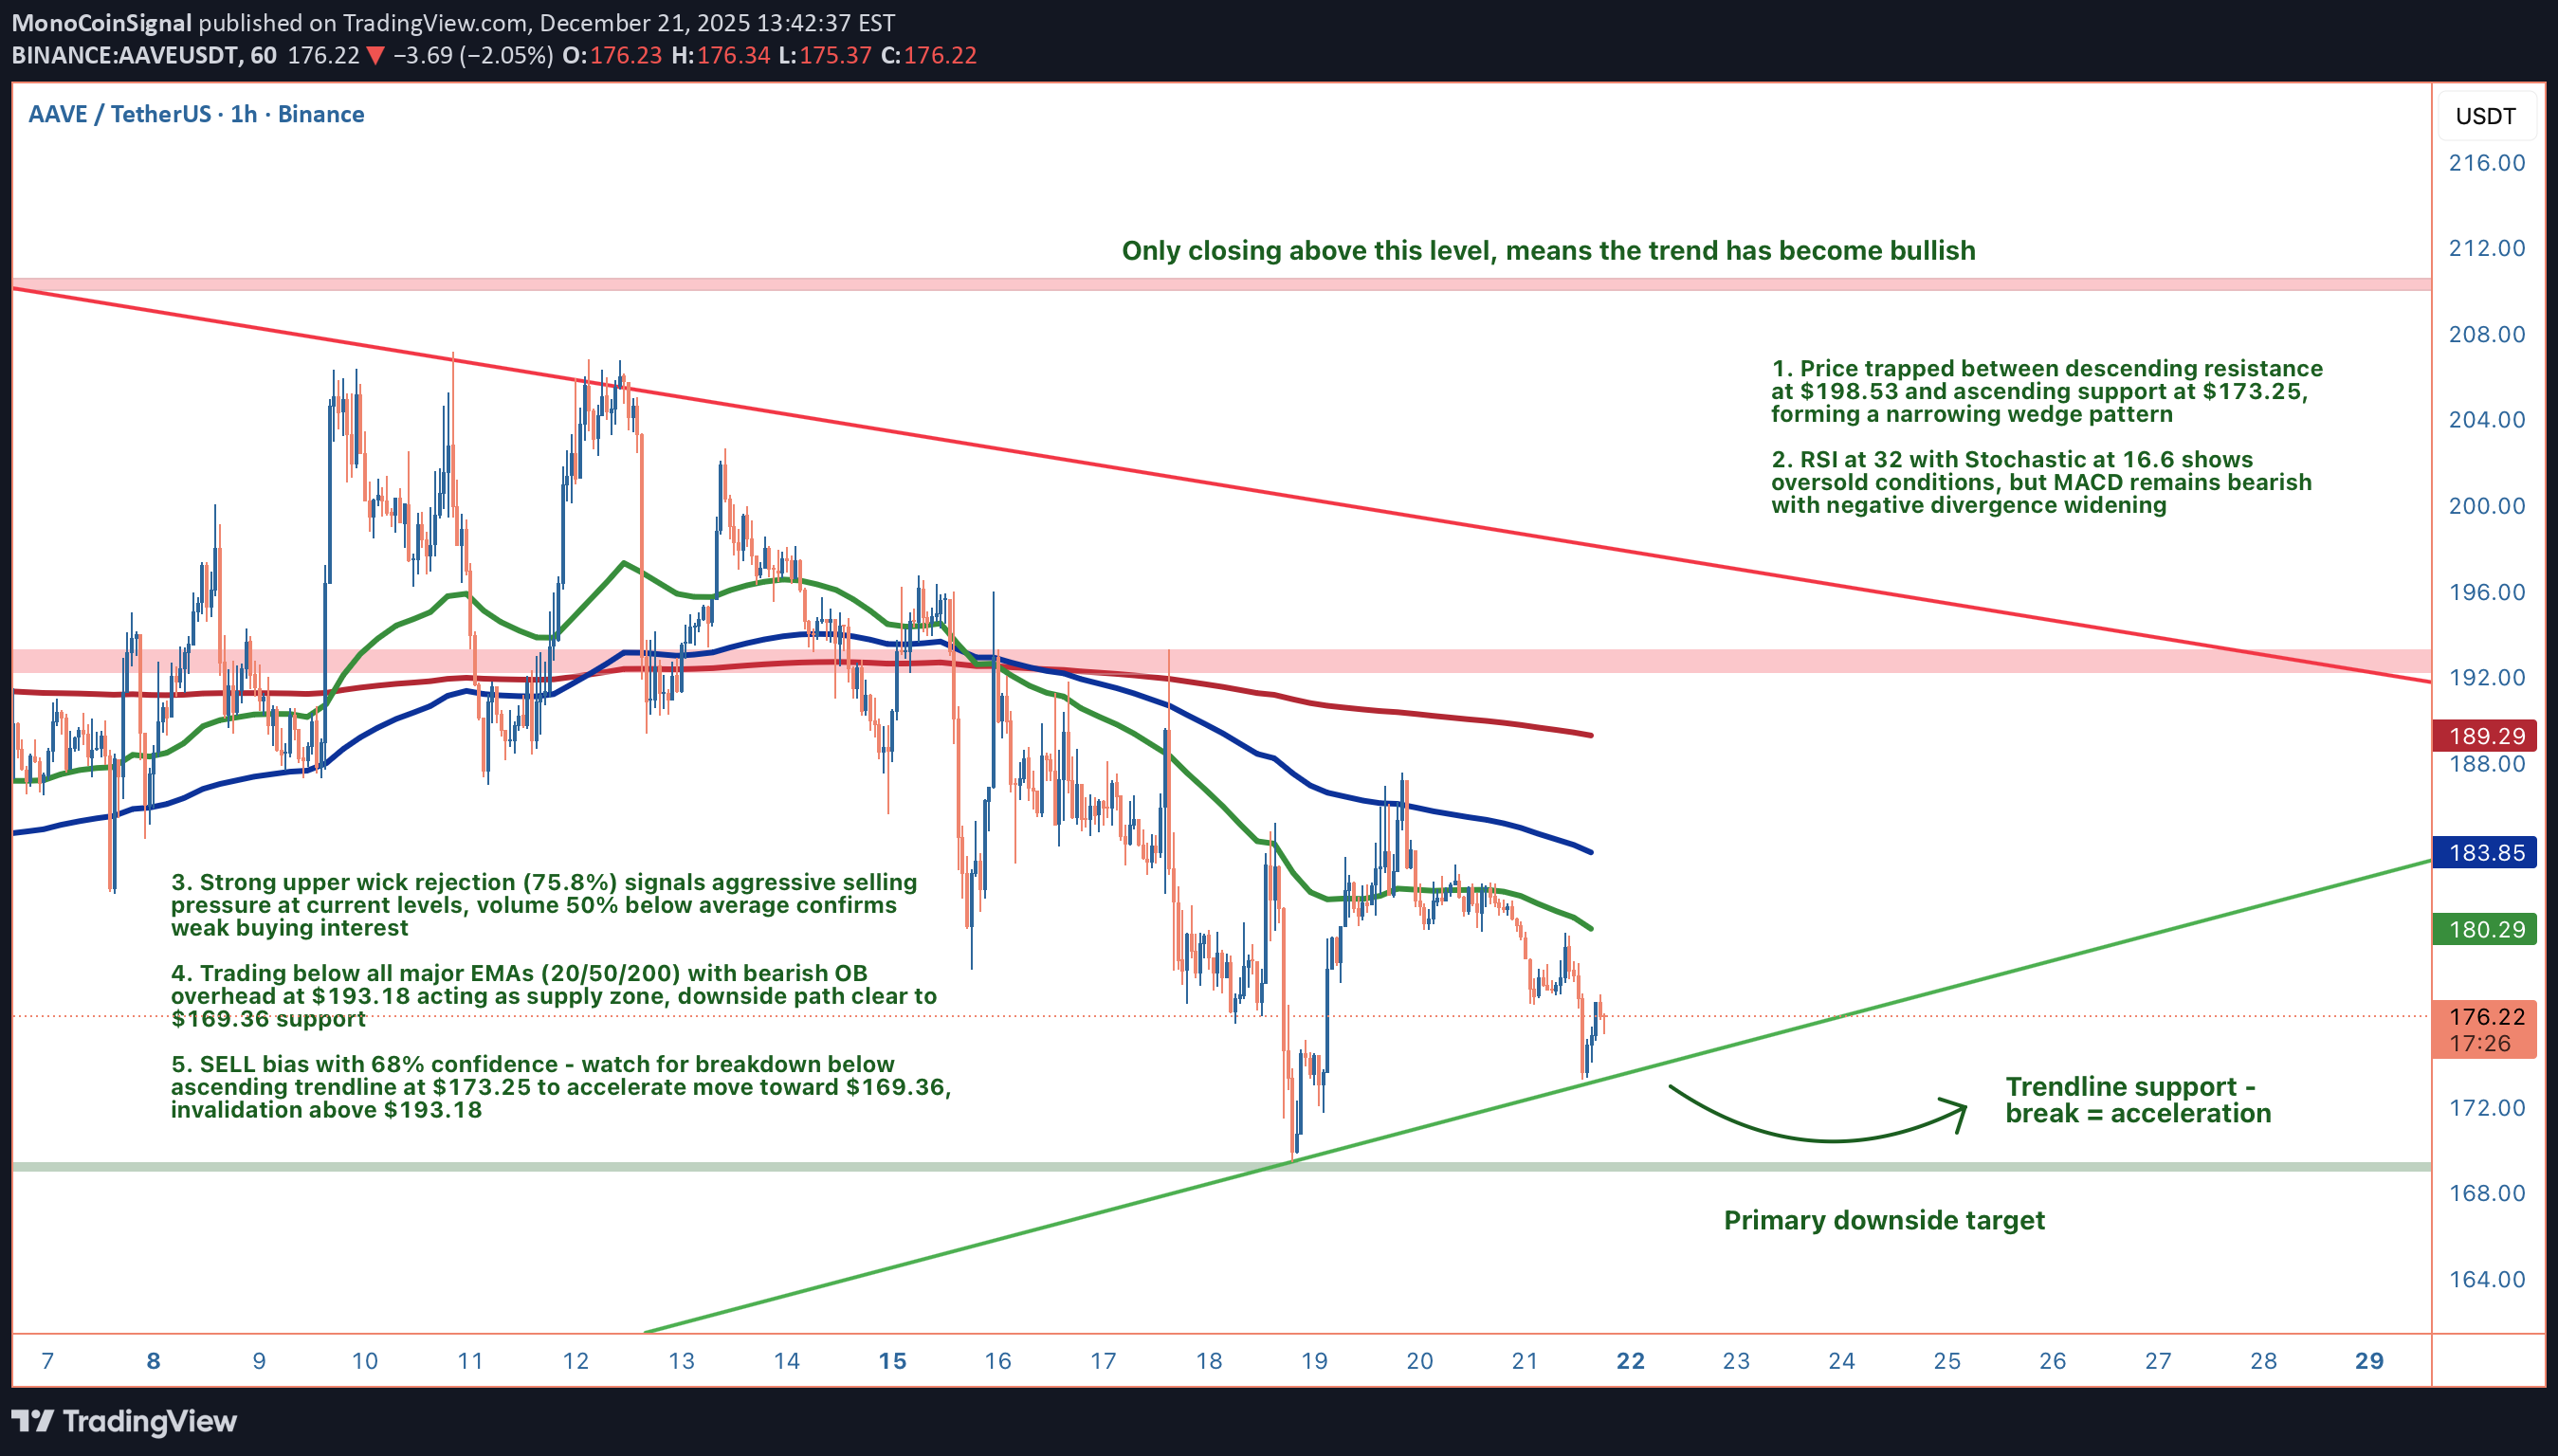
AAVE'de ders kitabına uygun bir sıkıştırma modeli izliyoruz; fiyat 173,25 dolarlık yükselen destek ile 198,53 dolarlık azalan direnç arasında sıkışmış durumda. Bu daralan takozlar sonsuza kadar sürmez. Sorun kırılıp kırılmayacağı değil, hangi yönde ve ne kadar şiddetli olduğudur. Şu anki fiyat: 175,48 dolar. 1. TEKNİK GERÇEKLİK 📉 • Kama Sıkıştırma: Yükselen destek 173,25 dolardan (80,01 dolardan 4 dokunuş) ve azalan direnç 198,53 dolardan (237,08 dolardan 8 dokunuş) • Trend Yapısı: Üç major EMA'nın (20/50/200) altında işlem yapmak — en az direnç yolu aşağı doğru • Reddetme Sinyali: %75,8'lik devasa üst fitil, yüksek fiyatları savunan agresif satış baskısını gösteriyor • Cilt İçeriği: Ortalamanın %50 altında (51 bin dolar vs 101 bin dolar) — geri dönme girişimlerinin ardında herhangi bir inanç yok 2. GÖSTERGELER ⚖️ Ayı Sinyalleri: • MACD düşüş eğilimi gösteriyor ve daha da olumsuz yönde ayrışıyor (-1,98 vs -1,70 sinyali) • 30,3'teki ADX, güneye işaret eden ılımlı trend gücünü teyit ediyor • Arz tavanı görevi gören 193,18$-186,41$ seviyesindeki ayı emri blok yükü • Momentumun bozulduğu daha düşük yüksek yapı Boğa Sinyalleri: • RSI 32'de aşırı satışta çığlık atıyor • Aşırı bölgede Stokastik 16,6 seviyesinde • 173,25$ seviyesindeki yükselen trend çizgisi aylardır sabit kaldı Çatışma: Aşırı satıştayız, ancak aşırı satış, trend halindeki bir piyasada aşırı satışta kalabilir. Zayıf hacim, herhangi bir sıçramanın ikna edici olmadığı anlamına gelir. Trend çizgisi son savunma hattıdır. 3. TİCARET KURULUMU 🎯 🔴 Senaryo A: Döküm (Birincil Yol - %68 Güven) • Tetikleyici: 177-179$ bölgesinde ret (EMA20 direnci) • Giriş: 173,25 $ seviyesindeki yükselen trend çizgisinin altına kırılma • Hedef 1: 169,36 $ (düşük salınım + OB zirvesi yükselişi) • Hedef 2: 162,19 Dolar (güçlü destek düşük) • Dur: 4 saatlik kapanış 193,18 doların üzerinde • R/R: İlk hedefte ~1:0,5, ancak olasılık ağırlıklı olumlu 🟢 Senaryo B: Yükselişin Tersine Dönüşü (Alternatif) • Tetikleyici: 4 saat 193,18 doların üzerinde kapandı (aşağı yönlü OB'yi desteğe çevirdi) • Giriş: Hacim onayı ile destek olarak 193,18 $'ın yeniden test edilmesi • Hedef: 210,36$ (yükseliş karakteri değişimi) • Geçersiz kılma: Yeniden testte 193,18$'ı tutamamak KARARIM Yüksek olasılıklı oyun 173,25 doların altındaki kırılmayı izliyor ve onu 169,36 dolara doğru sürüyor. Dengemiz var; düşüş eğilimi gösteren bir yapı, bozulan momentum, zayıf hacim, reddedilme fitilleri. Ancak bu yükselen trend çizgisi, ya yap ya da bitir seviyesidir. Hacim artışı devam ederse hızla yeniden değerlendiririm. O zamana kadar kurulum olumsuz tarafı destekliyor. Bu aşırı satış durumunu ortadan mı kaldırıyorsunuz yoksa çöküşü mü oynuyorsunuz? Bu 173,25 dolarlık trend çizgisinde ne okudunuz?
MonoCoinSignal
DOGE: Wedge Squeeze Play
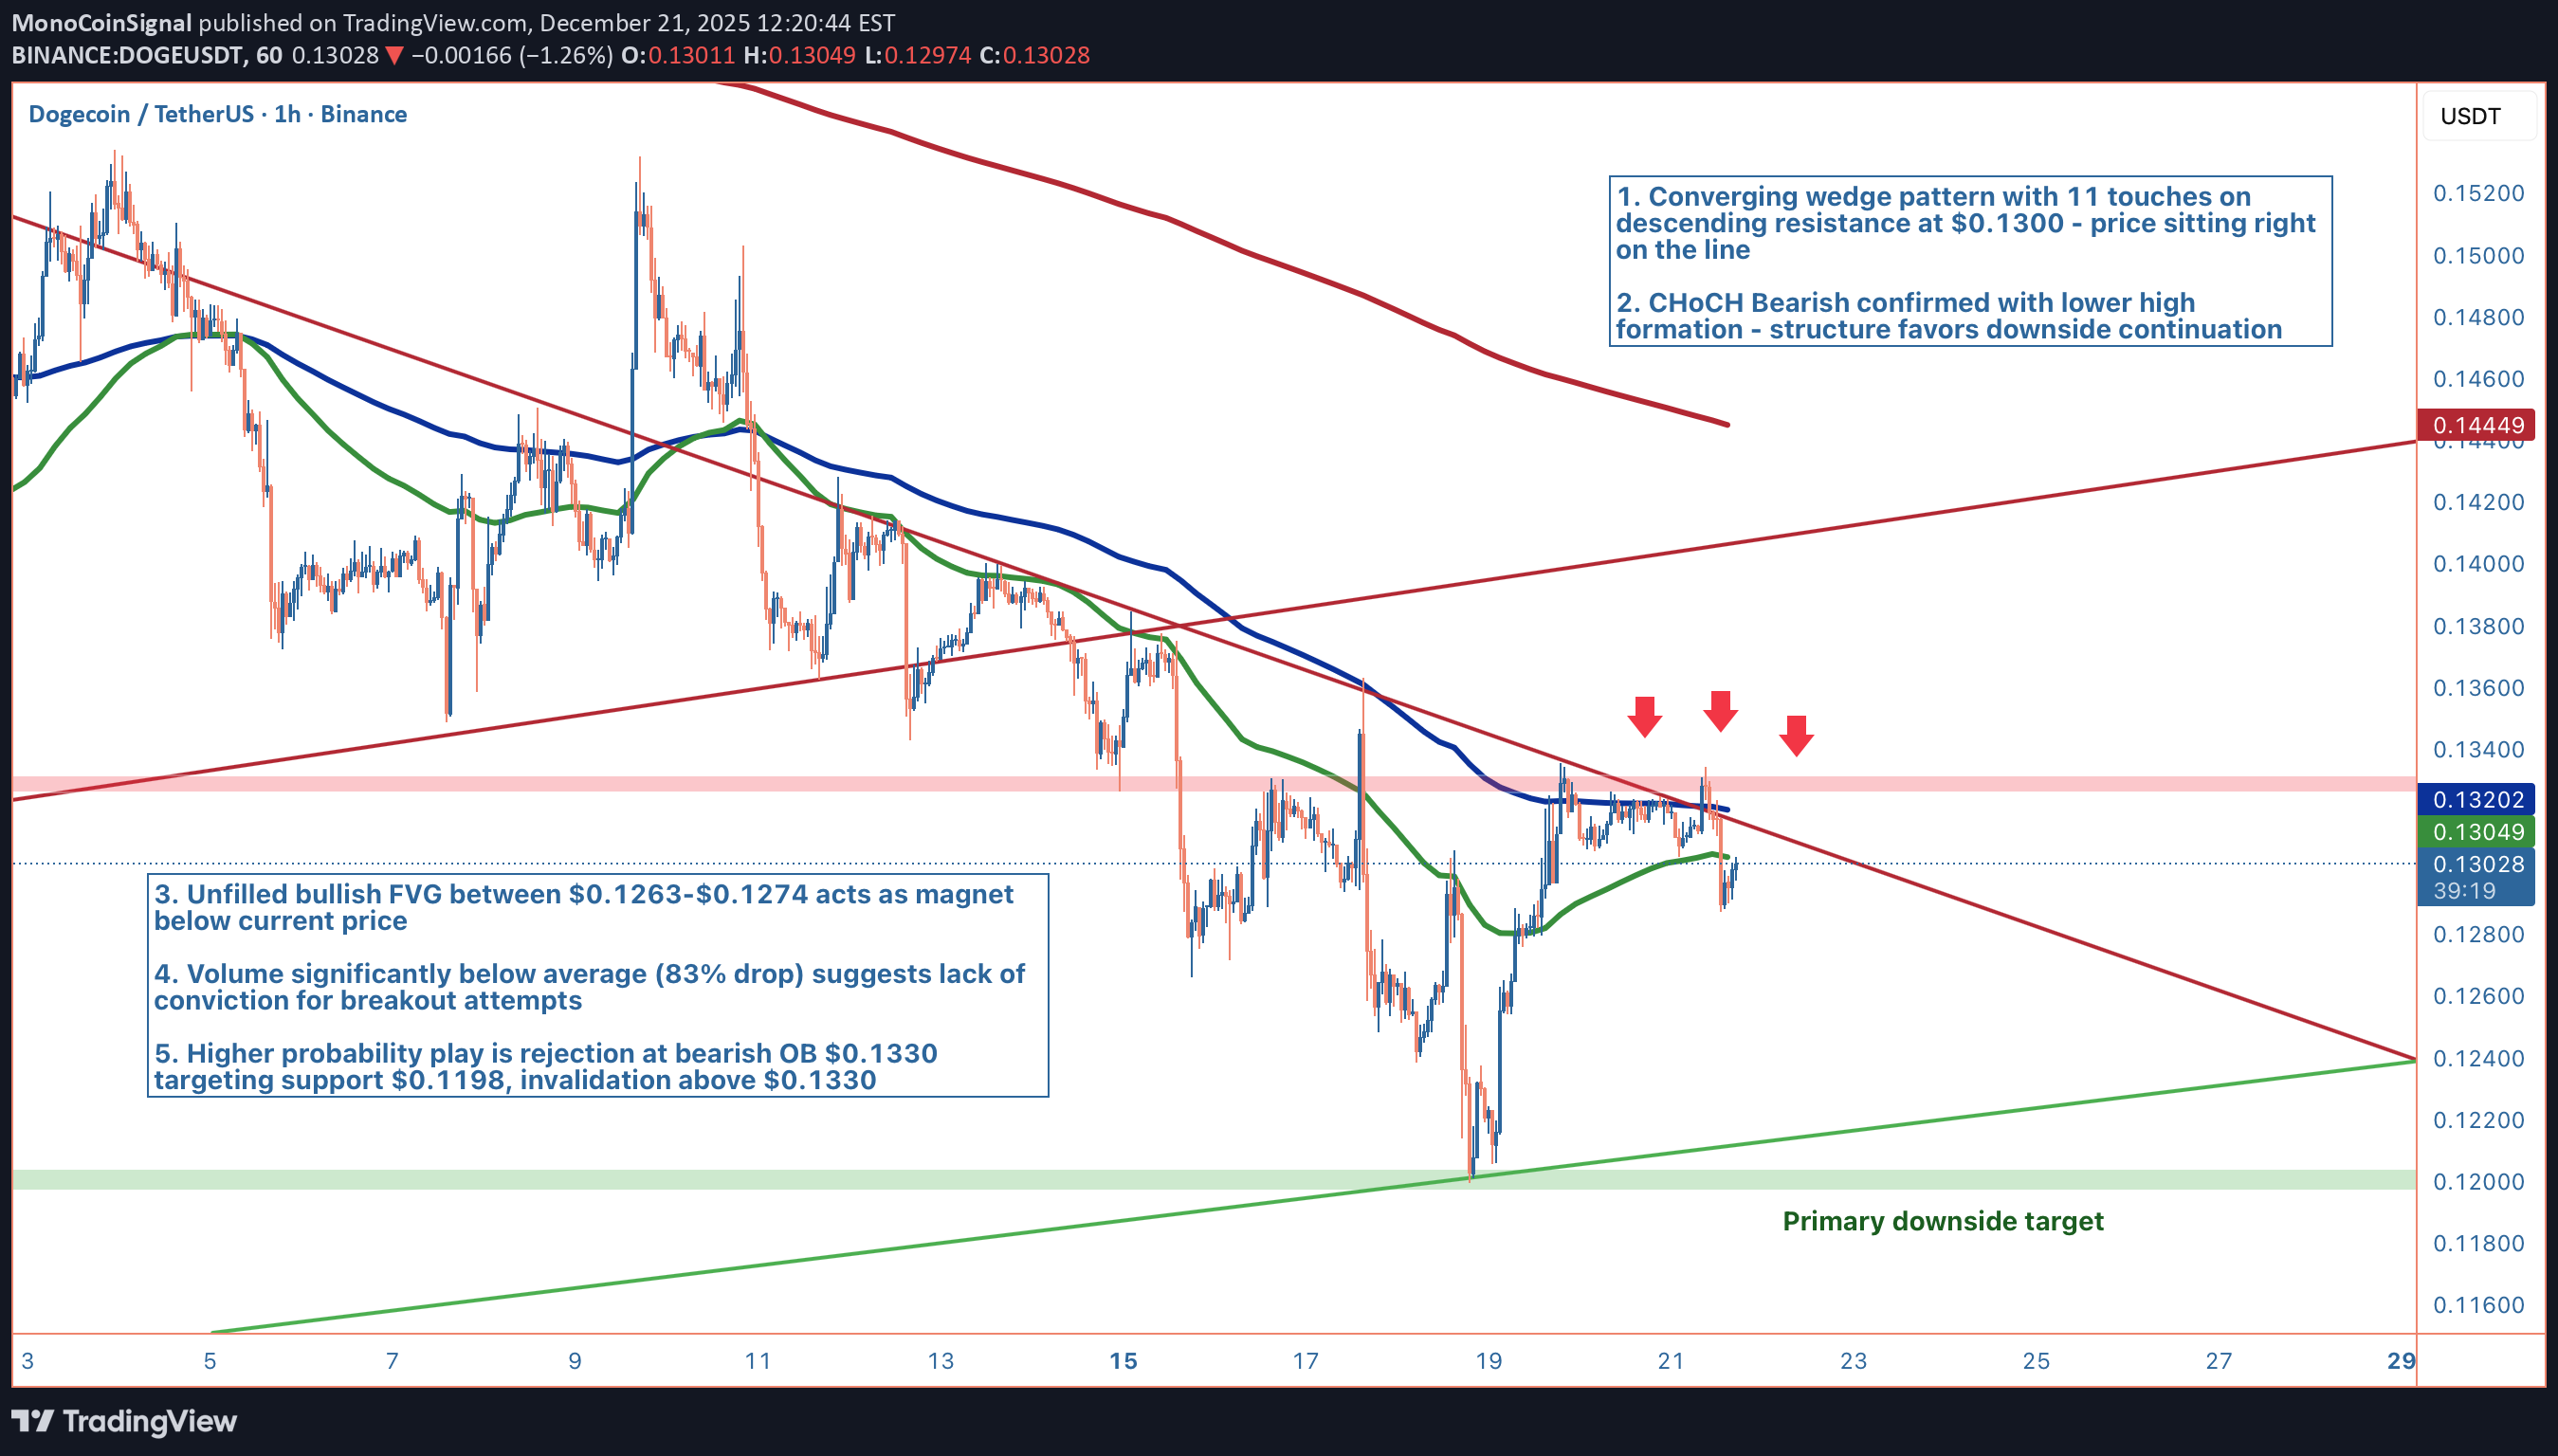
Karar noktasında oturuyoruz. DOGE, azalan dirence 11 dokunuşla yakınlaşan bir ders kitabına sıkıştırıldı ve fiyat şu anda kelimenin tam anlamıyla 0,1300 $ seviyesindeki çizgiye dokunuyor. Yapı zaten düşüş eğilimini kırdı (CHoCH doğrulandı) ve hacim %83 oranında düştüğünde, düzen tersine dönme yerine devam etmeyi tercih ediyor. Bu bir sabır oyunu, aradaki fark kısa sürede çözülüyor, ancak onaylanmadan önce ticareti zorlamak, tüccarların nasıl parçalanacağını gösteriyor. 1. TEKNİK GERÇEKLİK 📉 • Yakınsak kama tepe noktası: 0,1400 Dolardan (11 dokunuş) azalan direnç, 0,1200 Dolar – 0,01 Dolar sıkışma bölgesinde artan destekle buluşuyor • Yapı bozuldu: CHoCH Ayı düşük yüksek formasyonla doğrulandı, piyasa yapısı aşağı yönlü yönü destekliyor • Ayı emri bloğu: 0,1288-0,1330 dolar arz bölgesi görevi görüyor, fiyat şu anda zirveyi test ediyor • Hareketli ortalamalar düşüş yönünde yığılmış: EMA20 (0,1304 $), EMA50 (0,1319 $) ve EMA200 (0,1442 $) altındaki fiyat 2. GÖSTERGELER ⚖️ Ayı Sinyalleri: • Hacim çöküşü: Ortalama 121$M'a karşılık 728$M (%83 düşüş), çıkış girişimlerinin arkasında sıfır inanç • İndirim bölgesinde fiyat ticareti yapılıyor ancak prim geri alınamıyor • Düşük yükseklerle CHoCH düşüş eğilimi, yapı tezi bozulmamış Boğa Sinyalleri: • MACD yükseliş eğilimi (0,0002 vs 0,0000), en iyi ihtimalle marjinal • Fiyat HMA55'in (0,1292$) üzerinde ve Bollinger ortası band (0,1296$) • Mevcut mumda alt fitiller (%34,2) üst fitilleri (%14,5) aşıyor Çatışma: 58,3 seviyesindeki RSI nötr bölgede bulunuyor, geri dönüş sinyali verecek kadar aşırı satışta değil ancak aşırı alımda da yok. Tek mum fitili analizi satın alma baskısını gösteriyor ancak CHoCH'un düşüş eğilimine sahip daha geniş yapısı birden fazla bar önem taşıyor. 3. TİCARET KURULUMU 🎯 🔴 Senaryo A: Takoz Reddi (Daha Yüksek Olasılık) • Tetikleyici: Düşen direnç tutmasıyla birlikte 0,1330 dolarlık düşüş yönlü OB'de reddedilme • Giriş: Reddetme fitillerinde 0,1300 ila 0,1310 ABD Doları arasında ölçeklendirin • Hedef 1: 0,1263 $ (doldurulmamış yükseliş FVG'si, dengesizliğin doldurulması gerekiyor) • Hedef 2: 0,1198 ABD doları (düşük salınım + artan destek + yükseliş OB bölgesi) • Dur: 4 saatlik kapanış 0,1330 doların üzerinde (düşüş yönlü OB kırılmaları, tez geçersiz kılındı) 🟢 Senaryo B: Takozun Kırılması (Onay Gerektirir) • Tetikleyici: Güçlü 4 saatlik hacim artışıyla 0,1330 doların üzerinde kapanış • Giriş: Çıkışın ardından destek olarak 0,1330 doların yeniden test edilmesi • Hedef: 0,1505$ (CHoCH yükseliş dönüş seviyesi, premium bölgeye giriş) • Geçersiz kılma: Yeniden testte 0,1330 dolarda tutunamama, takoza geri dönüş reddedildi KARARIM Kurulum %62 güvenle Senaryo A'yı desteklemektedir. Yapı düşüş eğiliminde, hacim mevcut değil ve 0,1263 dolarlık doldurulmamış FVG mıknatıs görevi görüyor. Ancak takoz zirvesi, kırılmanın gerçekleşeceği anlamına geliyor soon... 0,1330 doların reddedilmesini veya bunun üzerinde teyit edilen kırılmayı bekleyin. Sermaye taahhüdünde bulunmadan önce piyasanın elini göstermesine izin verin. Bu sıkıştırma hakkında ne okuyorsunuz? Mola için mi bekliyorsunuz yoksa zaten bir senaryo için konumlanmış mısınız?
MonoCoinSignal
Bearish Trap or Real Breakdown?
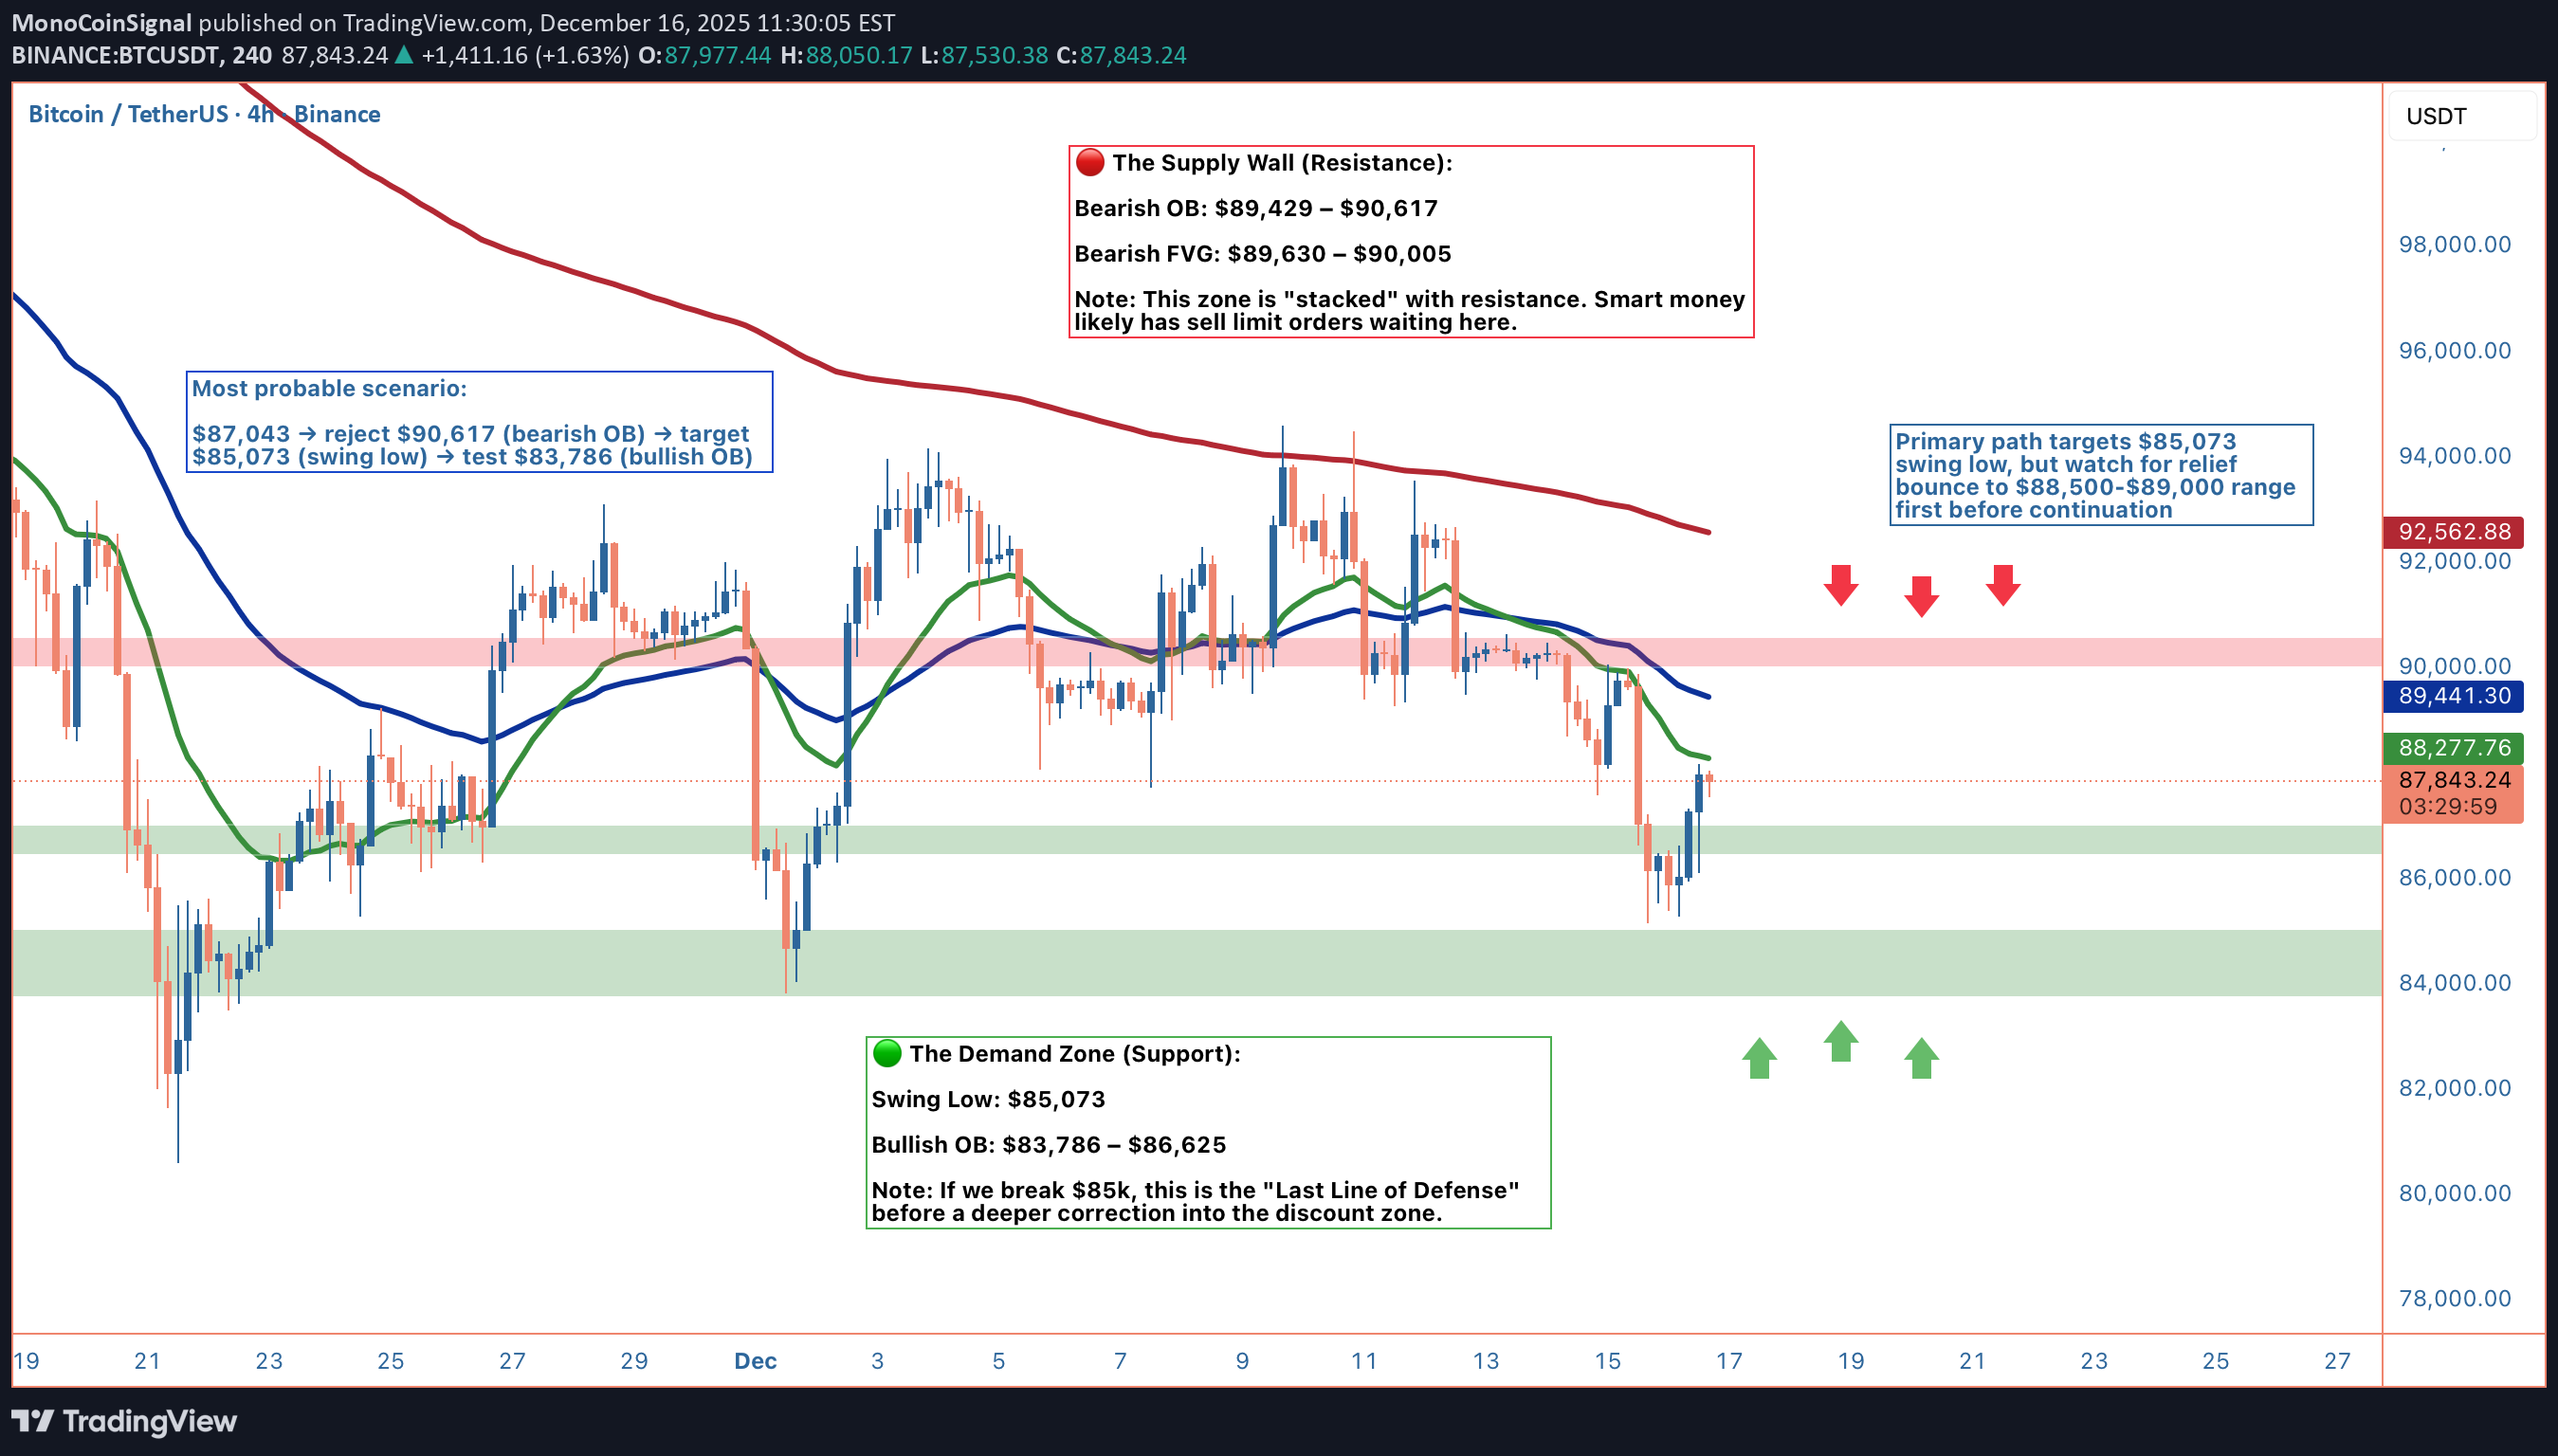
Şu anda 87.158 dolarda oturuyoruz, bu da bizi son yükseliş olan 94.555 dolar ile en düşük salınım olan 85.073 dolar arasındaki dengenin tam ortasına yerleştiriyor. Bu sadece grafikte rastgele bir nokta değil; piyasa yapısının bize belirgin ipuçları verdiği kritik bir karar noktasıdır. Buradaki en büyük gelişme, az önce onaylanan CHoCH Ayı Piyasası. Akıllı Para Konseptlerini takip edenler için bu, olumsuz yönde bir Karakter Değişikliğidir, bu da daha yüksek dipler dizisini kırdığımız anlamına gelir. Haftalardır devam eden yükseliş yapısı tersine döndü ve bizim de stratejimizi buna göre ayarlamamız gerekiyor. Teknik birleşimden bahsedelim, çünkü göstergeleri layer kullandığınızda, story çok spesifik hale gelir. Fiyat üç major EMA'nın (20, 50 ve 200) altında işlem görüyor ve genel olarak düşüş eğilimi yaratıyor. Bu şekilde hareketli ortalama yığınınızın altında olduğunuzda, en az dirençli yol genellikle aşağı doğru olur. MACD bunu -1087'lik derin bir düşüş okumasıyla doğruluyor ve sinyal çizgileri arasındaki boşluk genişliyor; momentum güneyi işaret ediyor. Ancak kurulumun zorlaştığı yer burasıdır ve neden iki hamle sonrasını düşünmeniz gerekir. RSI 34 civarında geziniyor, aşırı satış bölgesine yaklaşıyor ve en son mum %64,5'lik devasa bir düşük fitil bastı. Bu bize birisinin büyüklükte "gerçeğe uygun değer" satın almak için devreye girdiğini gösteriyor. Tam olarak panik seviyesinde değiliz, ancak bir rahatlama sıçramasının kesinlikle masada olmasına yetecek kadar yakınız. Bu piyasada bir gerilim yaratıyor: Yapı "sat" diyor ama anlık momentum "sıçrama" diyor. Burada eşitliği bozan, 62,7'de bulunan ADX'tir. Bu güçlü bir trend ortamına işaret ediyor. Bu değişken, yönsüz bir fiyat hareketi değil; ADX 60'ın üzerinde olduğunda trendler devam etme eğilimindedir. Dolayısıyla, RSI bir sıçrama konusunda uyarıda bulunurken, ADX net bir onay olmadan trende karşı mücadele etmeyin diyor. İşte yol haritası. Birincil senaryo direnişte reddedilmeyi tercih ediyor. Buradan herhangi bir rahatlama sıçraması muhtemelen 89.429 ila 90.617 dolar arasındaki Ayı Sipariş Bloğuna (Tedarik Bölgesi) doğru yönelecektir. Bu alan kesişme noktalarıyla doludur: yerine getirilmemiş satış emirleri, düşüş yönlü bir FVG içerir ve threshold premium bölgesinin hemen altında yer alır. Fiyatın 89 bin ila 90 bin dolar arasındaki bölgeye yükseldiğini görürsek, bu yüksek olasılıklı bir kısa fırsat haline gelir. 85.073 dolarlık salınımı hedeflemek için orada ret sinyalleri arıyoruz. Bu seviyeyi kırdığınızda, ciddi bir satın alma ilgisinin nihayet ortaya çıkmasını beklediğim 83.786 ila 86.625 dolar arasındaki Boğa Sipariş Bloğu talep bölgesine bakıyoruz. Bir ticaret yapmak istiyorsanız, burada sabır sizin avantajınızdır. Aşırı satış RSI ile 87 bin dolardaki deliğe kısa devre yapmak riskli. Daha iyi riske göre ayarlanmış oyun, 88.500-90.000 dolar aralığına sıçramayı bekliyor. Geçersiz kılma seviyeniz (zararı durdurma) 90.617 doların üzerinde 4 saatlik bir kapanış. Fiyatın bu seviyenin üzerinde kapanması aşağı yönlü emir bloğunu geçersiz kılar ve arz tezini geçersiz kılar. Öte yandan, eğer boğalar 91.066 doları (premium bölge threshold) geri almayı başarırsa, bu CHoCH Boğa Piyasasının tersine dönmesini tetikler. Bu, tüm yapıyı boğaların lehine çevirerek 94.185 doları hedefleyecektir. Ancak şu anda, hacmin ortalamanın 2 katı olması ve iç eğilimin nötr/düşüş eğiliminde olması nedeniyle bu daha düşük olasılıklı yol. Sonuç olarak: Yapı, aşağı yönlü devamı destekliyor ancak ancak potansiyel bir rahatlama sıçramasından sonra. Onaylanmış bir trend değişikliğimiz, düşüş eğilimi gösteren EMA yığınlarımız ve düşüşte güçlü bir hacmimiz var. Aralığın alt kısmına kısa devre yaparken tuzağa düşmeyin ve "ölü cat" sıçramayı özleyerek tuzağa düşmeyin. 90 bin dolarlık arz testini bekleyin, reddedilmeyi bekleyin ve en az direnç yolunda işlem yapın. Yapısal hasar nedeniyle düşüş eğiliminin devam edeceğine dair güven yaklaşık %75 seviyesinde bulunuyor ancak aşırı satış koşulları, daha iyi giriş fiyatları beklememizi gerektiriyor.
MonoCoinSignal
Bulls Flexing Strength
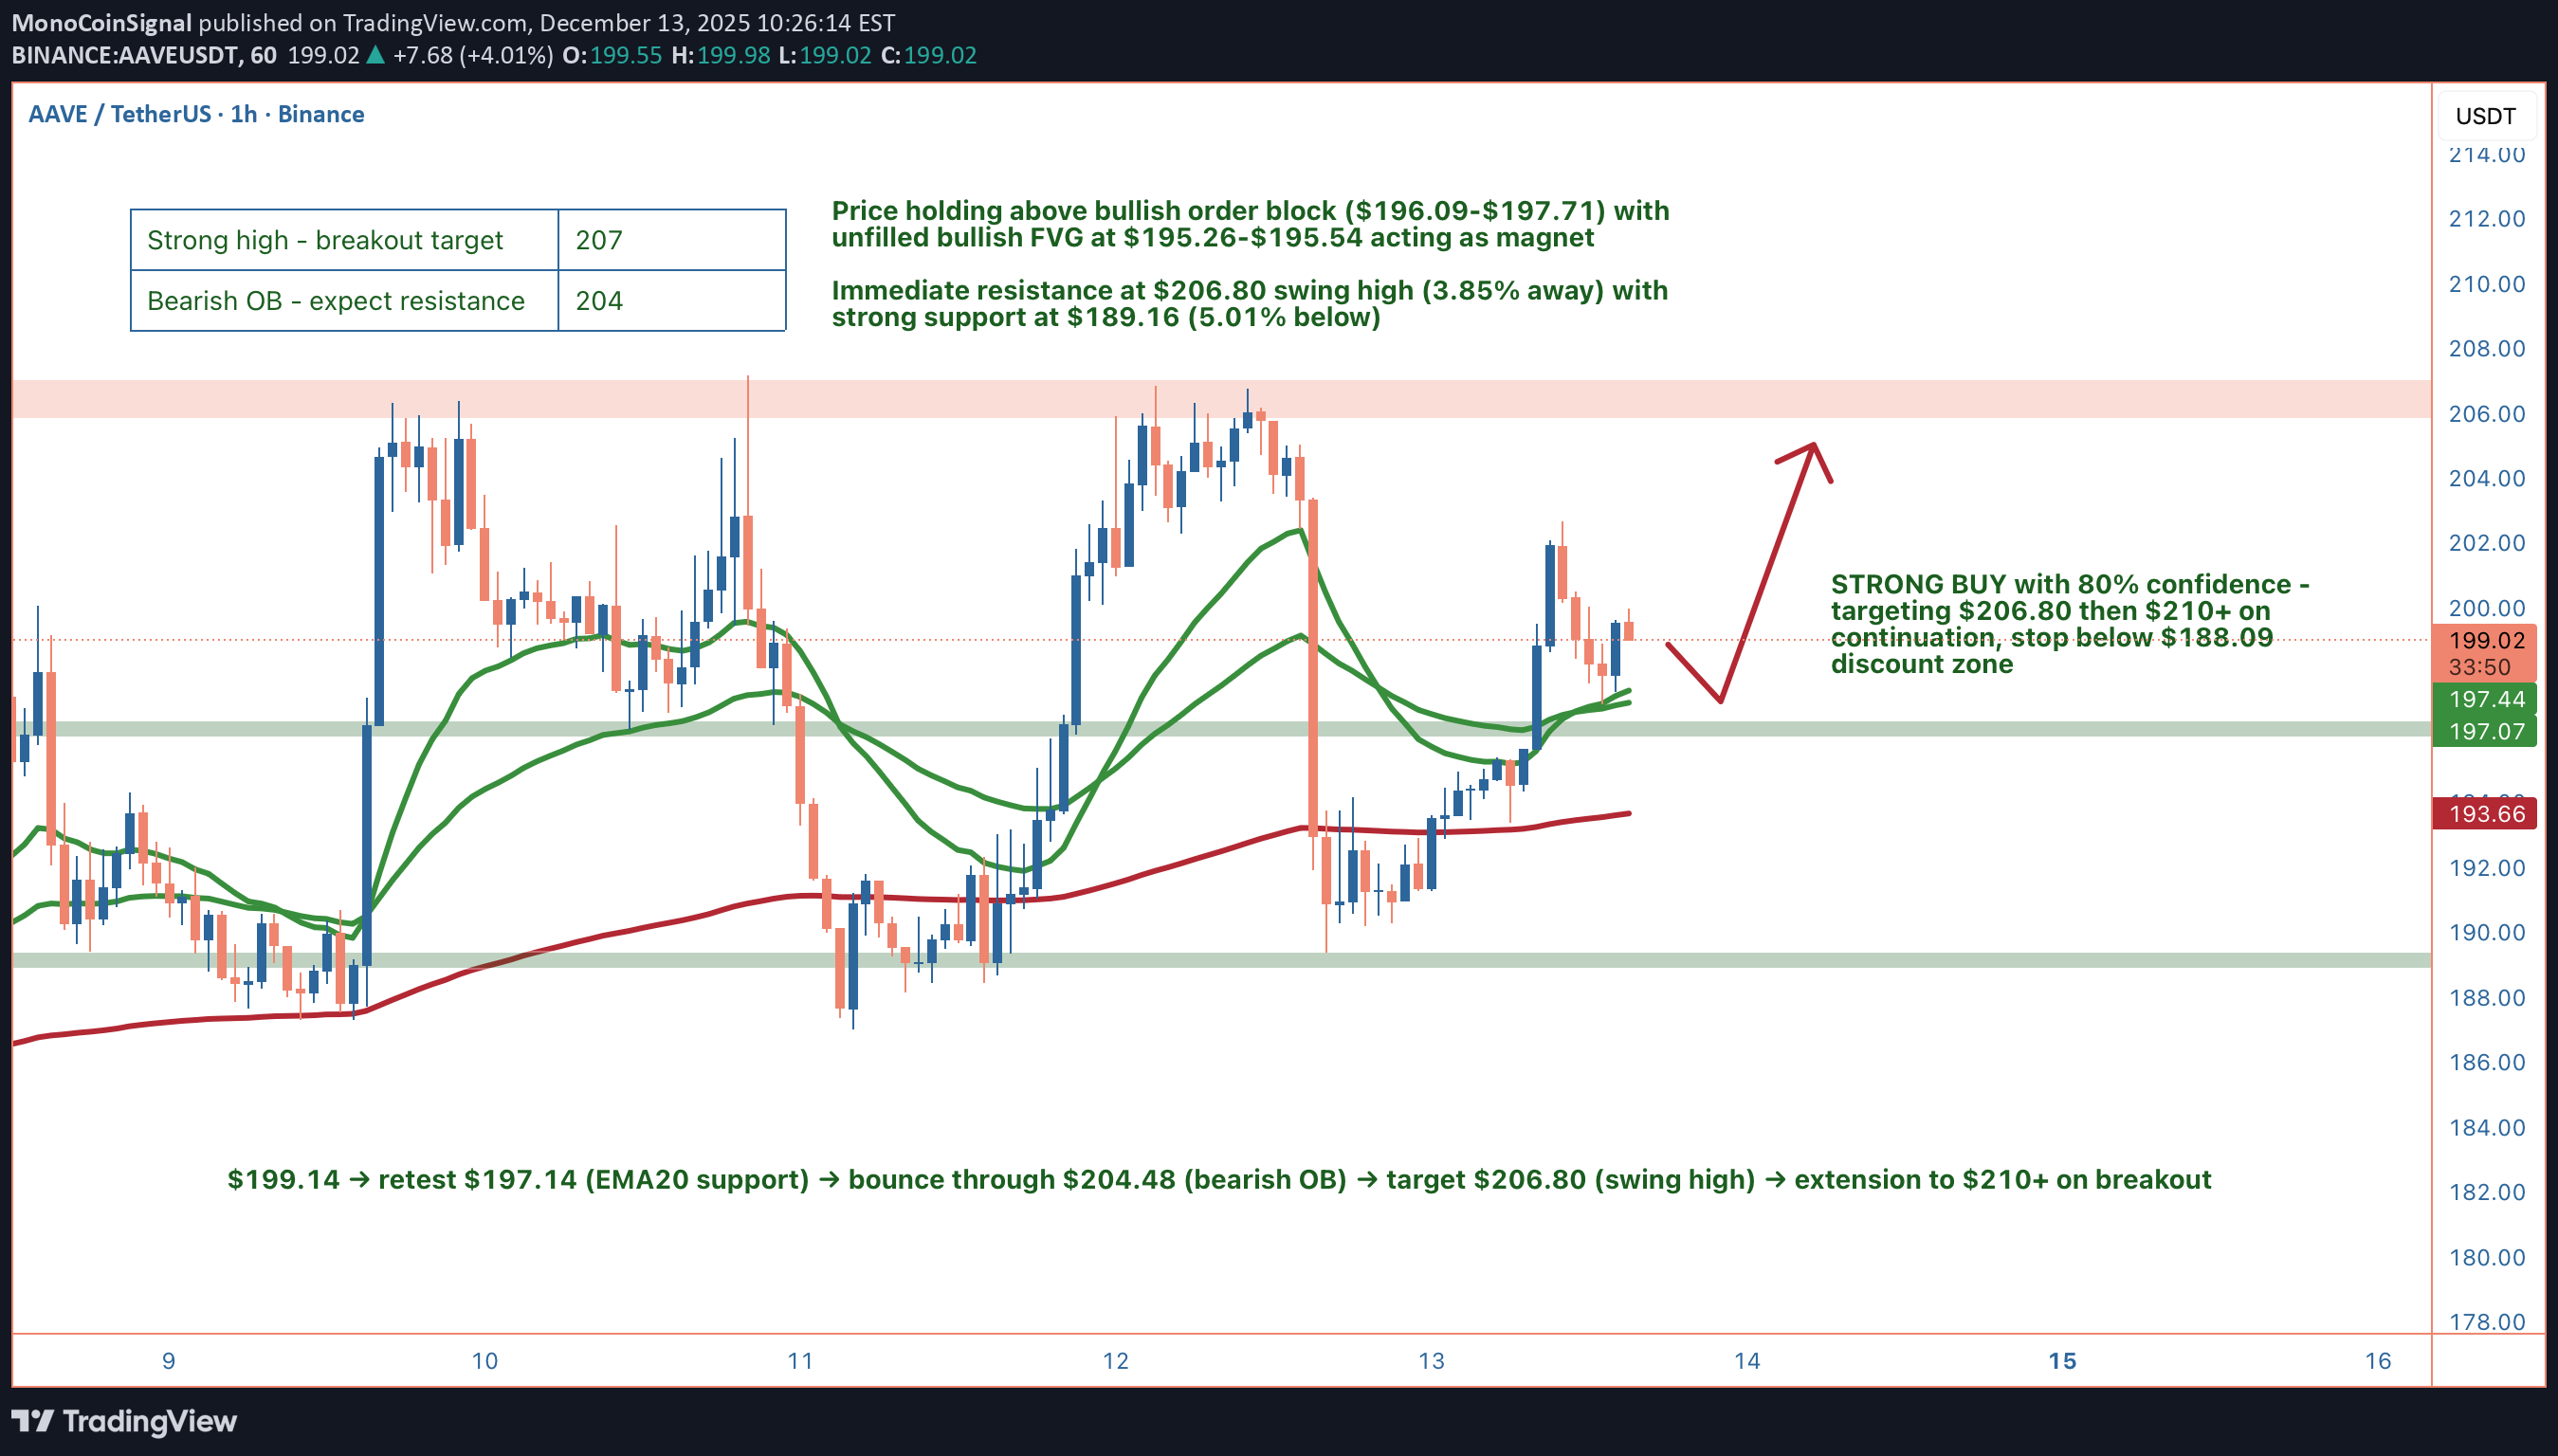
Hey guys, AAVE is setting up one of those textbook bullish continuation patterns that makes you sit up and pay attention. The current price of $199.14 sits right in the equilibrium zone, perfectly balanced between premium and discount levels. What's immediately striking is the clean higher low formation that's been confirmed, with price holding firmly above all major moving averages. The EMA20 at $197.14, EMA50 at $196.87, and EMA200 at $193.39 are all stacked bullishly beneath current price, creating a support ladder that's characteristic of strong uptrends. This alignment doesn't happen by accident - it's the result of sustained buying pressure and institutional accumulation. The ADX reading of 53.3 is absolutely critical to understanding the current market state. This indicator measures trend strength, and anything above 25 signals a trending market rather than choppy consolidation. At 53.3, we're looking at a strong, established trend that has momentum behind it. When you pair this with the MACD showing powerful bullish divergence (0.6012 vs 0.0205 signal line), the technical picture becomes crystal clear. The MACD histogram is expanding positively, indicating accelerating bullish momentum rather than a weakening trend. The RSI at 68.7 is approaching overbought territory but hasn't reached extreme levels yet. This is actually ideal for continuation setups - we want to see strength, not weakness. The RSI has room to push into the 70-80 zone during strong trending moves, so this reading suggests we're in the middle of a move rather than at an exhausted top. The MFI at 66.8 confirms that money flow is supporting this price action, with capital flowing into AAVE rather than exiting. From a Smart Money Concepts perspective, this setup gets even more interesting. Price is currently trading above a bullish order block that spans $196.09 to $197.71. This zone represents an area where institutions likely accumulated positions during the previous move up, and it's now acting as a demand zone. Order blocks are one of the most reliable SMC concepts because they mark areas where smart money has shown their hand. The fact that we're holding above this level suggests institutional support remains intact. There's also an unfilled bullish Fair Value Gap sitting at $195.26-$195.54. FVGs represent inefficiencies in price action where the market moved too quickly, leaving behind an imbalance. These gaps act as magnets - if we see any pullback, this $195.26-$195.54 zone would be an ideal area for smart money to add to positions. It's essentially a discount entry point within the broader uptrend. The bearish order block at $204.48-$199.70 represents the immediate supply zone we need to reclaim. This is where sellers previously showed strength, and reclaiming this zone with volume would be a significant bullish signal. A break above $204.48 with expanding volume would likely trigger stops and fuel a move toward the swing high at $206.80. The market structure is showing higher lows, which is the definition of an uptrend. The recent swing low at $189.16 held firm, and the even stronger low at $186.85 provides an additional backstop. The Bollinger Bands show price trading above the middle band at $195.32, with the upper band at $202.02 within striking distance. When price walks the upper Bollinger Band in a strong trend, it often signals continuation rather than reversal. Volume analysis reveals current levels at $19,995 versus an average of $22,867. While this is slightly below average, it's not concerning given we're in a consolidation phase. What we want to see is volume expansion as price approaches the $204.48 resistance zone. A breakout on declining volume would be suspect, but a breakout with volume above $25,000+ would confirm institutional participation. The 24h volume of $161 million shows healthy overall interest in AAVE. The wick analysis is particularly revealing. The lower wick represents 24.9% of the candle range, while the upper wick is only 11%. This asymmetry tells a story - buyers are aggressively defending lower prices (creating large lower wicks), while sellers aren't showing the same aggression at higher prices (small upper wicks). This imbalance in supply and demand dynamics typically precedes upside moves. For a complete trading setup, here's how I'd approach this: Entry zone is $197-199, with aggressive traders potentially entering at current levels given the strong technical backdrop. More conservative traders might wait for a pullback to the $195.26-$195.54 bullish FVG for a better risk-reward entry. The stop loss should be placed below $188.00 - a 4H close beneath the discount zone at $188.09 would invalidate the bullish market structure and break the higher low formation. This isn't just a random percentage-based stop; it's a structural level where the thesis breaks. Target the swing high at $206.80 for TP1, which represents a 3.85% move from current levels. If we get a clean breakout above $206.80 with volume confirmation, look for extension targets at $210 and potentially $215 based on measured moves. The risk-reward on this setup is approximately 1:2.5 from current levels, which is solid for a continuation play. If entering from the FVG around $195, the R:R improves to nearly 1:4. The confidence level on this setup is 78% - high conviction but not maximum. What keeps this from being a 90%+ setup is the slightly below-average volume and the fact that we're in equilibrium rather than deep discount. The ideal scenario would be a quick wick down to $195 on a volume spike (liquidity grab), followed by immediate reclaim and push through $204.48. That would be the textbook smart money playbook. Alternative scenarios to consider: if price rejects hard at the $204.48 bearish order block without volume confirmation, we could see a deeper pullback to the $195.26 FVG or even the $189.16 swing low. This wouldn't invalidate the bullish thesis unless we close below $188.00. Consolidation between $197-204 for another 12-24 hours would actually be healthy, allowing the RSI to cool off slightly before the next leg up. What are you thinking here? Are you waiting for a pullback to the FVG for a better entry, or taking the trade at current levels given the strong momentum?
MonoCoinSignal
Choppy Waters Ahead
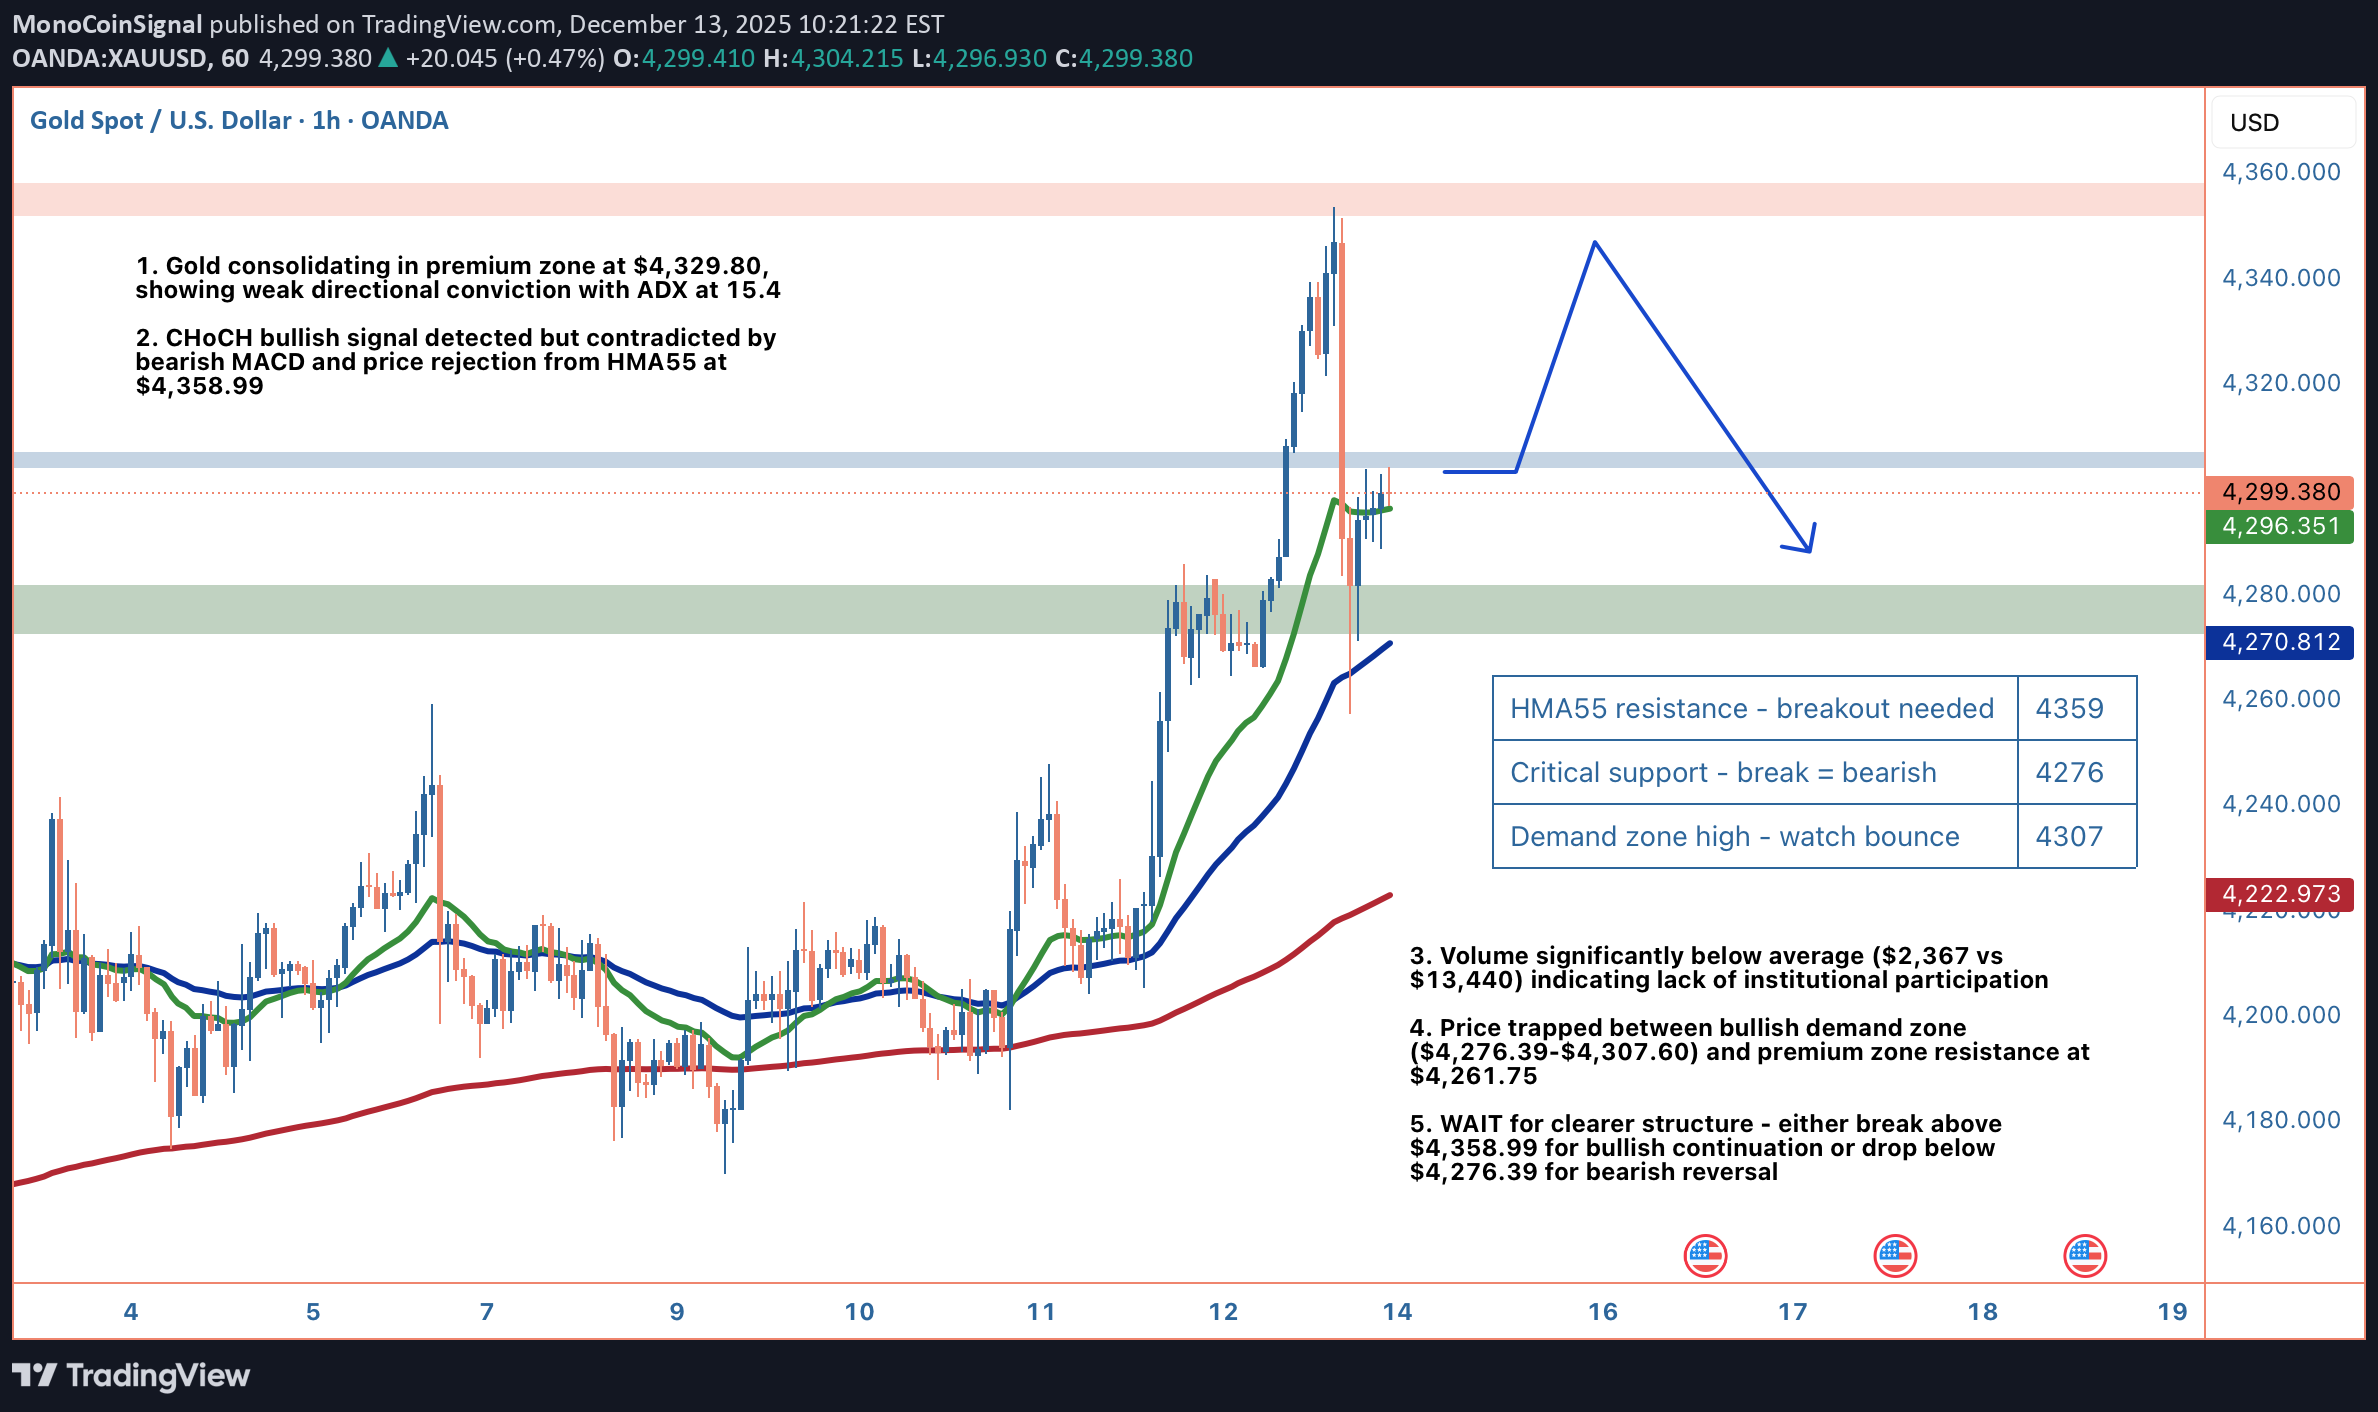
Hey traders, hope your charts are treating you better than this choppy gold action! Gold is serving up a classic case of market indecision at $4,329.80, and honestly, this is one of those moments where patience beats forcing a trade. We're sitting in premium territory, which typically favors sellers, but the price action is so lackluster that neither bulls nor bears have control. The ADX at 15.4 confirms what your eyes are probably telling you: this trend has zero strength right now. Let's break down what's actually happening here. Price is hovering just above the EMA20 at $4,328.00 and well above the EMA50 at $4,301.44, which would normally signal bullish momentum. But here's the kicker: we're still below the EMA200 at $4,329.79, creating this awkward middle ground where neither side can claim victory. The RSI at 53.5 is perfectly neutral, and the Stochastic at 54.6 mirrors that same indecision. Even the MACD is showing bearish divergence with the histogram trending down, yet it's not strong enough to trigger real selling pressure. The volume situation is what really concerns me. Current volume sits at $2,367 compared to an average of $13,440. That's an 82% drop, folks. When institutional money isn't participating, any moves we see are likely retail-driven and prone to quick reversals. This explains why we've been range-bound between $4,302.70 and $4,335.00 for the past 24 hours with virtually no net change. From a Smart Money Concepts lens, we've got some interesting dynamics at play. There's a bullish order block (demand zone) sitting between $4,276.39 and $4,307.60 that's been respected so far. This represents an area where smart money previously accumulated positions, and it's acting as a floor. Above us, the HMA55 at $4,358.99 is providing dynamic resistance, and price got rejected from this level recently. The bearish fair value gap from $4,326.50 to $4,339.29 has already been filled, so that imbalance is off the table. The market structure shows a CHoCH bullish signal, suggesting a potential trend reversal to the upside. However, I'm skeptical of this signal given the weak volume and conflicting indicators. For this bullish reversal to have legs, we'd need to see a decisive break above $4,358.99 with a surge in volume. That would open the door to the Bollinger upper band at $4,385.62 and potentially the recent swing high at $4,387.79. On the flip side, if we lose the bullish order block at $4,276.39, that's your signal that the bears are taking control. A breakdown there would target the equilibrium level at $4,233.00, which represents fair value in the current range. Below that, we're looking at the discount zone and potentially the swing low at $4,183.60, though that's a significant move that would require sustained selling pressure. The Bollinger Bands tell an interesting story too. We're trading below the middle band at $4,333.22, which adds to the neutral-to-slightly-bearish bias. The bands aren't particularly wide, suggesting low volatility, which aligns with our weak ADX reading. In these conditions, mean reversion trades often work better than trend-following strategies. Here's my trading plan for this setup. I'm not taking any immediate positions because the risk/reward simply isn't there. If you're itching to trade, wait for one of two scenarios. Scenario one: a break and 4-hour close above $4,358.99 with volume at least 50% above average. That would be your long entry signal, targeting $4,385.62 first, then $4,387.79. Your stop would go below $4,330.00, giving you about a 1:2 risk/reward ratio. Scenario two: a breakdown below $4,276.39 on a 4-hour close. That's your short entry, targeting $4,233.00 initially, with an extended target at $4,183.60 if momentum continues. Your stop would sit above $4,307.60, the top of the order block. This gives you a much better risk/reward of around 1:3 to the first target. The key invalidation level for any bullish thesis is $4,275.00. A close below that breaks the demand zone structure and confirms bearish control. For bears, a reclaim of $4,358.99 would invalidate the short setup and suggest the bulls are regaining strength. One more thing to watch: the wick analysis shows 83.9% lower wick versus 16.1% upper wick on the recent candle. This suggests buyers are stepping in at lower prices, but they're not strong enough to push price higher. It's defensive buying, not aggressive accumulation. That's another reason to wait for clearer signals. Bottom line: this is a WAIT situation. The market is in consolidation mode with weak trend strength, conflicting signals, and terrible volume. Forcing trades in these conditions is how accounts get chopped up. Let the market show its hand first. Either we get a clean breakout above $4,358.99 or a breakdown below $4,276.39. Until then, preserve your capital and wait for a high-probability setup. What's your take on gold right now - are you seeing something I'm missing, or are you also sitting on your hands waiting for clarity?
MonoCoinSignal
بیت کوین در آستانه انفجار است؟ تحلیل ساختار مخفی و سطوح کلیدی برای رشد صعودی
Hey guys, BTC's setting up an intriguing consolidation pattern at $92,350 after getting rejected from yesterday's $94,221 high, and the technical structure underneath is telling a pretty bullish story despite the surface-level chop. Let me break down what I'm seeing across multiple timeframes and why this could be gearing up for the next leg higher. On the 4-hour chart, we're dealing with a classic post-rejection consolidation phase. Price pulled back -1.40% from the 24h high but found solid support right at the EMA20 ($91,578) and has been coiling above it ever since. What's important here is the higher low structure that's forming, BTC bounced from $91,520 (24h low) and hasn't retested that level, instead building a base above $92,000. This is textbook bullish price action where dips are getting bought rather than cascading into lower lows. The moving average stack is giving us mixed signals but leaning constructive. Price is trading above both the EMA20 ($91,578) and EMA50 ($90,985), which is your first confirmation of short-term bullish momentum. However, we're still below the EMA200 at $93,911, which is acting as the major resistance ceiling right now. This creates a clear battleground zone between $92,000 support and $94,000 resistance. The HMA55 at $91,458 is providing additional support confluence, reinforcing that $91,400-$91,500 zone as a critical floor. Diving into the momentum indicators, the MACD is showing a bullish crossover with solid separation (MACD line at 523 vs Signal at 411). This 112-point spread indicates genuine upside momentum building beneath the surface, even though price action looks choppy. The histogram is expanding positively, which typically precedes price following momentum higher. Now, the ADX at 15.3 tells us we're in a weak trend environment, but don't mistake that for bearish. Low ADX during consolidation often means the market is coiling energy for the next directional move, and with MACD bullish, that move is more likely to be upward. RSI at 52.2 sits perfectly neutral with massive room to run before hitting overbought territory at 70. This is ideal for swing longs because you're not buying into extended conditions. The Stochastic at 57.0 mirrors this neutrality, while the MFI (Money Flow Index) at 42.8 is particularly interesting. MFI below 50 during a consolidation phase with price holding support suggests we're not seeing heavy distribution from smart money. If whales were dumping, MFI would be diving toward oversold while price breaks support, that's not happening here. Bollinger Bands are providing clear technical boundaries for this setup. Price is trading above the middle band at $91,404, which has flipped from resistance to support, a bullish development. The upper band sits at $93,744, just below that critical EMA200 at $93,911, creating a resistance cluster in the $93,700-$94,200 range. The lower band at $89,064 represents the extreme downside scenario, but we'd need to lose multiple support layers to get there. The current BB position (above middle, below upper) is typical of consolidation before continuation moves. Volume analysis is revealing. Current volume at $12,060 is significantly below the average of $26,267, sitting at roughly 46% of normal activity. In isolation, low volume might seem bearish, but context matters. When price consolidates on low volume above key support levels, it typically indicates larger players aren't actively selling, they're waiting. Distribution phases show high volume with price failing to make progress. This looks more like accumulation or at minimum, a lack of selling pressure. Once volume returns, if it comes with upside price action, that's your breakout confirmation signal. The wick analysis adds another layer of insight. Upper wicks at 33.9% versus lower wicks at 24.1% shows sellers are stepping in at higher prices (around that $93,700-$94,200 resistance zone), but buyers are absorbing that selling pressure without letting price collapse. This tug-of-war is creating the consolidation, but the fact that we're holding above $92,000 despite repeated upper wick rejections suggests demand is strong enough to eventually push through supply. Looking at support and resistance levels with precision: Immediate support sits at $92,000 (psychological level), then $91,578 (EMA20), followed by $91,404 (BB middle). The critical support that must hold for bulls is $90,985 (EMA50), with final line in the sand at $90,800. Below $90,800, the higher low structure breaks and we'd likely see a flush toward $89,064 (BB lower) or even $88,500. On the upside, resistance layers at $93,744 (BB upper), $93,911 (EMA200), and $94,221 (24h high). A break and hold above $94,200 would be significant, flipping the EMA200 from resistance to support and likely triggering momentum algorithms. For a concrete trading setup, here's what I'm watching: Entry zone is $92,000-$92,500, essentially current levels where we're consolidating. This gives you a defined risk entry rather than chasing breakouts. Stop loss goes at $90,800, which represents the invalidation point where the bullish structure breaks (losing EMA50 and higher low pattern). That's roughly a 1.6% risk from current price. Take profit targets: TP1 at $94,200 (2.0% gain, 1:1.25 R/R) for the conservative BB upper breakout, TP2 at $95,500 (3.4% gain, 1:2.1 R/R) for the EMA200 reclaim with extension, and TP3 at $97,000 (5.0% gain, 1:3.1 R/R) for those riding momentum. Scale out at each level to lock profits while leaving room to catch a larger move. The key trigger to watch is volume returning on the breakout attempt. If BTC pushes toward $93,700-$94,000 and volume surges above the $26,267 average, that's your confirmation to add to positions or enter if you missed the initial setup. Conversely, if we approach resistance on weak volume (sub $15,000), that's a fade opportunity rather than a buy signal, expect rejection back to $92,000 support. Risk-reward clearly favors the long side here with 1:2 to 1:3 setups available, solid moving average support underneath, bullish MACD momentum, and neutral oscillators with room to run. The main risk is a macro catalyst or sudden volume spike that breaks $90,800 support, but technically, the path of least resistance appears to be higher once this consolidation resolves. What are you thinking here, are you playing this consolidation for the breakout or waiting for clearer confirmation above $94,000?Got another rejection from EMA200 (Red line on the chart)BTC's grinding sideways at $90,092 after 15 hours of choppy price action, and the technical setup remains bearish despite oversold conditions. We're still trapped below all major EMAs (20/50/200) with MACD deeply negative at -285.18, but the real story is the trend exhaustion - ADX collapsed to just 11.7, signaling we're in a weak, directionless environment. 📉 The Stochastic hit 19.4 (oversold) and that 27.4% lower wick shows buyers defending current levels, but the 72.4% upper wick and collapsed volume ($160 vs $2,718 avg) tell us sellers are still in control on any bounce attempts. From a Smart Money perspective, we've got an unfilled bearish FVG from $92,044 to $90,666 acting as supply overhead, and price is sitting in the bullish order block between $90,528 and $89,500. The immediate support at $89,480 (24h low) looks vulnerable if we lose this demand zone, with the next major level at $87,719 (strong swing low in the discount zone). That's where I'd expect real buyers to step in aggressively. 🎯 The trade setup favors shorts from current levels ($90,000-$90,500) with stops above $92,044 (bearish FVG top - that's the invalidation level). First target is $89,480 (TP1), then $87,719 (TP2) for a 1:2.3 risk/reward. Just be aware that with ADX this low, we could chop around in this range for a while before making the next decisive move. If we get a 4H close above $92,044, the bearish thesis is off and you need to reassess.
Sorumluluk Reddi
Sahmeto'nun web sitesinde ve resmi iletişim kanallarında yer alan herhangi bir içerik ve materyal, kişisel görüşlerin ve analizlerin bir derlemesidir ve bağlayıcı değildir. Borsa ve kripto para piyasasına alım, satım, giriş veya çıkış için herhangi bir tavsiye oluşturmazlar. Ayrıca, web sitesinde ve kanallarda yer alan tüm haberler ve analizler, yalnızca resmi ve gayri resmi yerli ve yabancı kaynaklardan yeniden yayınlanan bilgilerdir ve söz konusu içeriğin kullanıcılarının materyallerin orijinalliğini ve doğruluğunu takip etmekten ve sağlamaktan sorumlu olduğu açıktır. Bu nedenle, sorumluluk reddedilirken, sermaye piyasası ve kripto para piyasasındaki herhangi bir karar verme, eylem ve olası kar ve zarar sorumluluğunun yatırımcıya ait olduğu beyan edilir.