10.12.2025 tarihinde sembol BTC hakkında Teknik MonoCoinSignal analizi

MonoCoinSignal
بیت کوین در آستانه انفجار است؟ تحلیل ساختار مخفی و سطوح کلیدی برای رشد صعودی
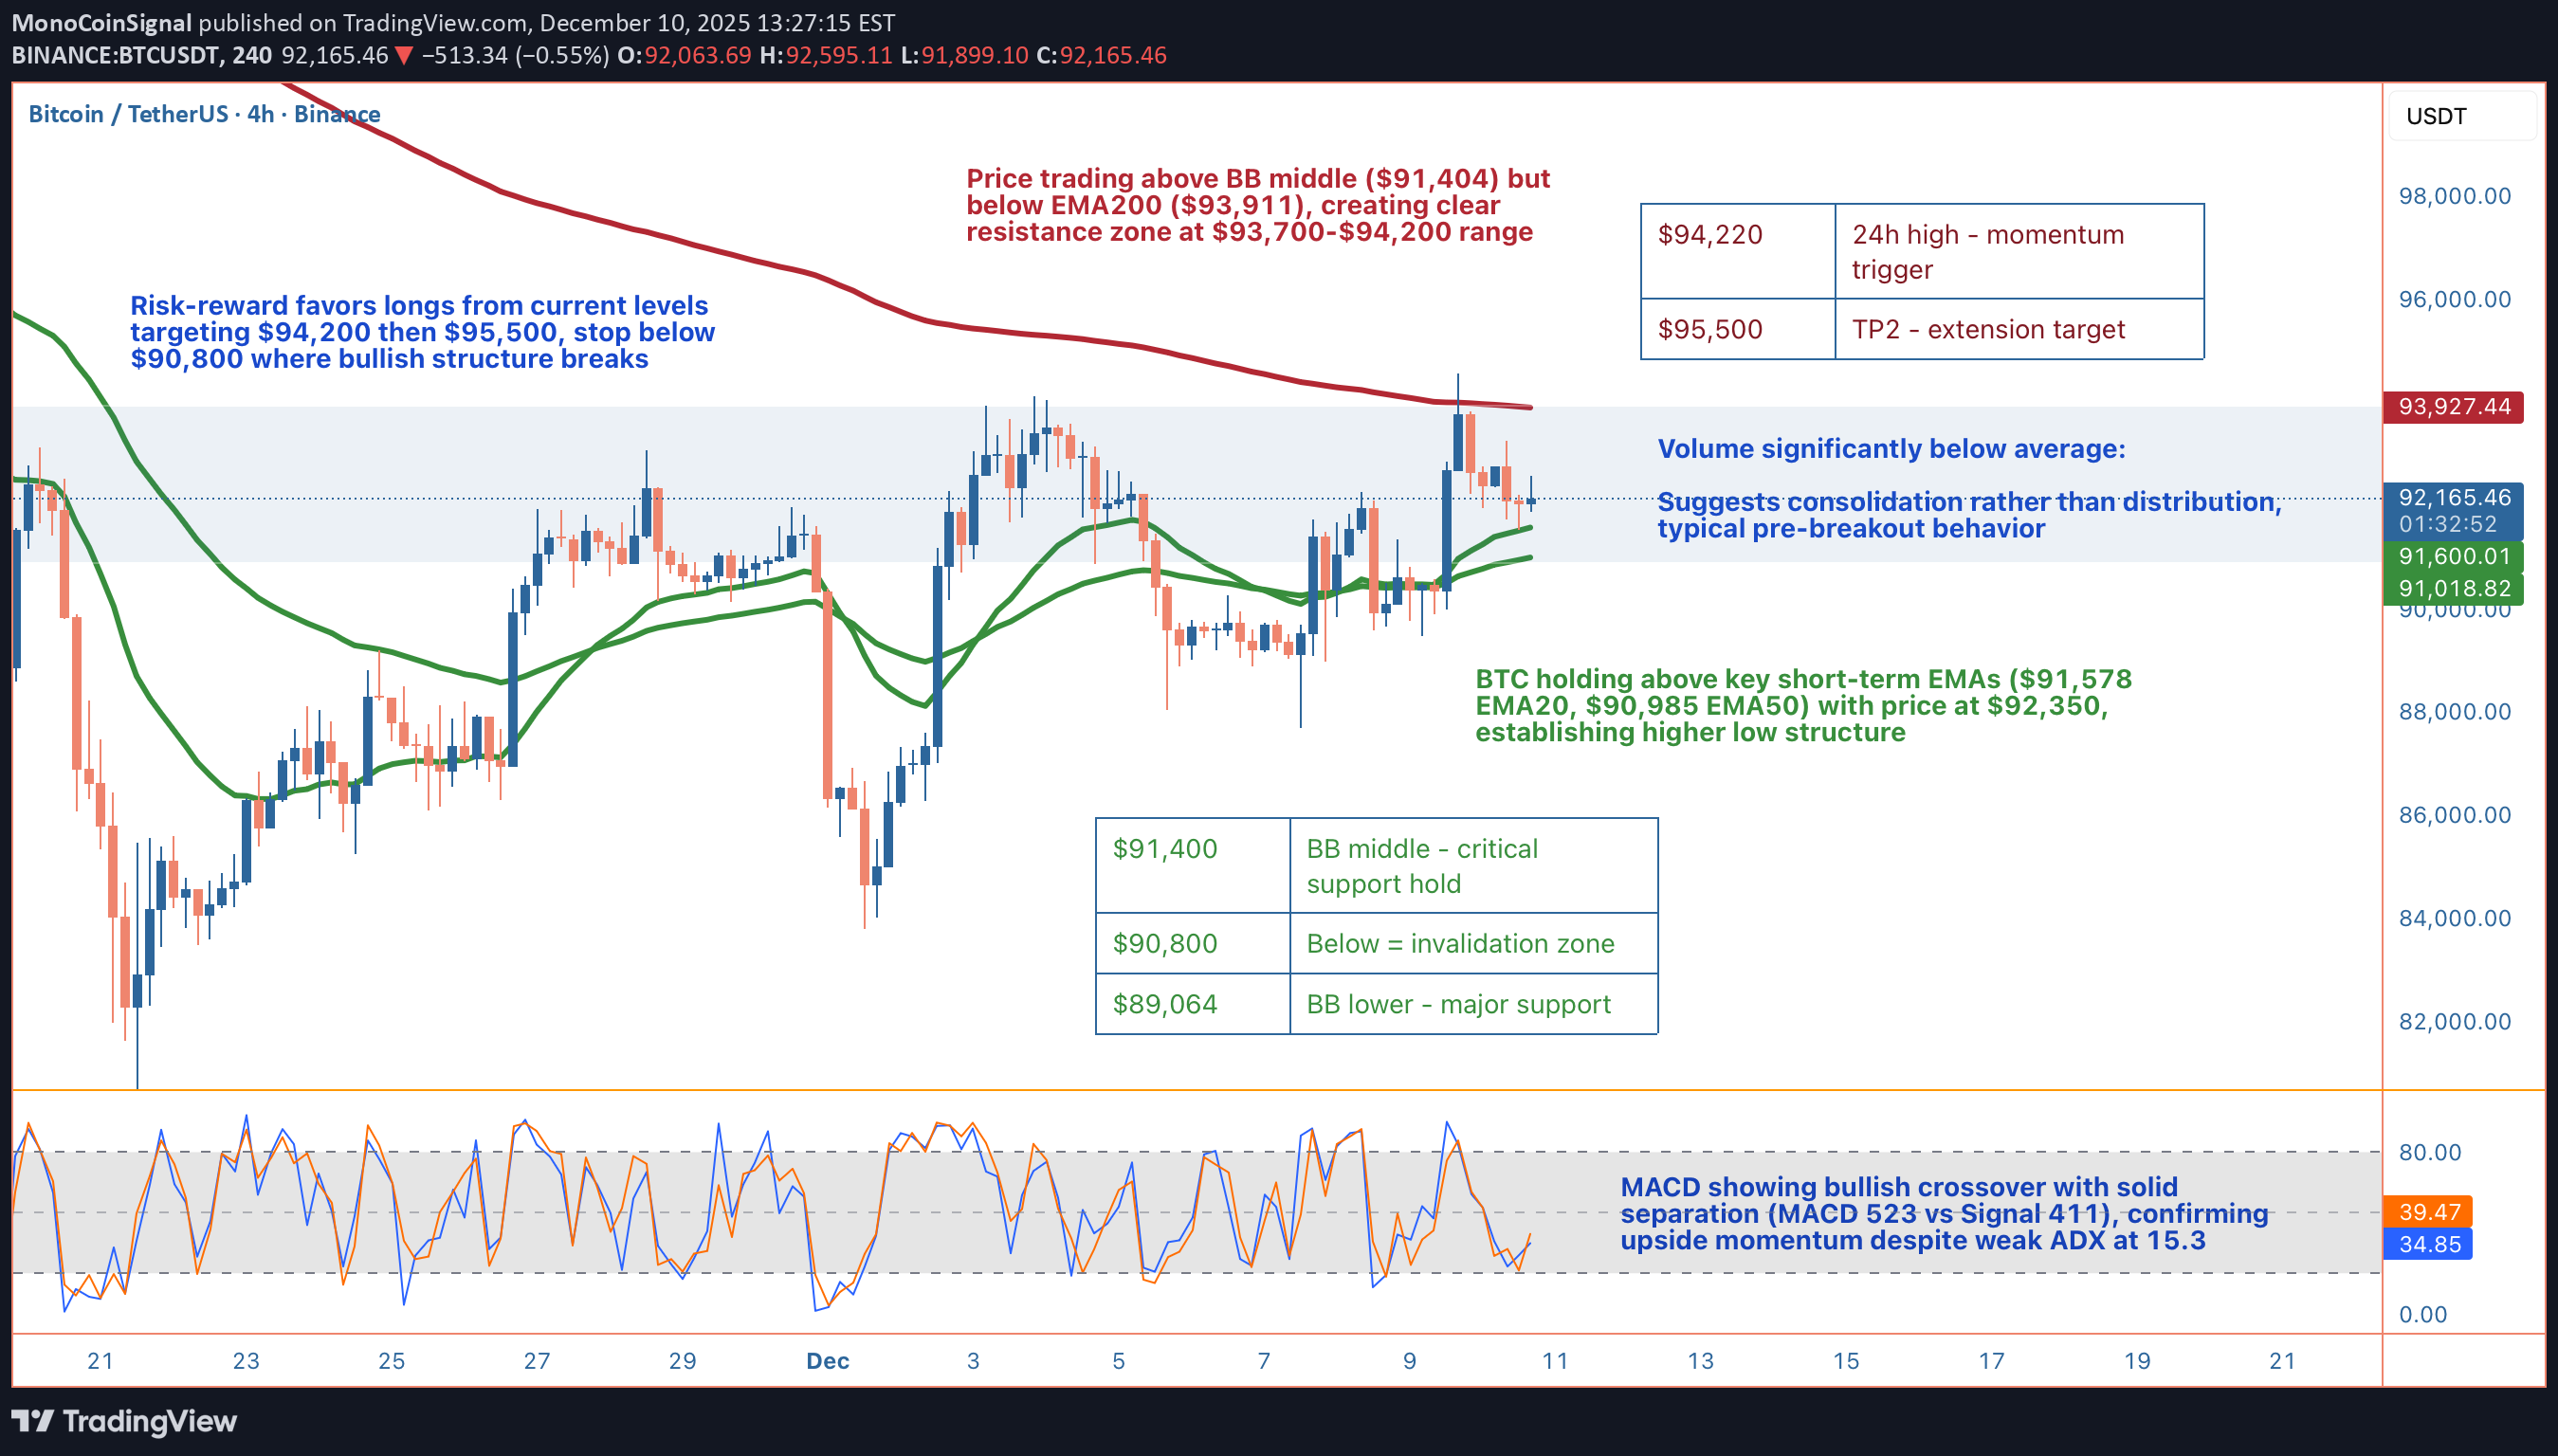
Hey guys, BTC's setting up an intriguing consolidation pattern at $92,350 after getting rejected from yesterday's $94,221 high, and the technical structure underneath is telling a pretty bullish story despite the surface-level chop. Let me break down what I'm seeing across multiple timeframes and why this could be gearing up for the next leg higher. On the 4-hour chart, we're dealing with a classic post-rejection consolidation phase. Price pulled back -1.40% from the 24h high but found solid support right at the EMA20 ($91,578) and has been coiling above it ever since. What's important here is the higher low structure that's forming, BTC bounced from $91,520 (24h low) and hasn't retested that level, instead building a base above $92,000. This is textbook bullish price action where dips are getting bought rather than cascading into lower lows. The moving average stack is giving us mixed signals but leaning constructive. Price is trading above both the EMA20 ($91,578) and EMA50 ($90,985), which is your first confirmation of short-term bullish momentum. However, we're still below the EMA200 at $93,911, which is acting as the major resistance ceiling right now. This creates a clear battleground zone between $92,000 support and $94,000 resistance. The HMA55 at $91,458 is providing additional support confluence, reinforcing that $91,400-$91,500 zone as a critical floor. Diving into the momentum indicators, the MACD is showing a bullish crossover with solid separation (MACD line at 523 vs Signal at 411). This 112-point spread indicates genuine upside momentum building beneath the surface, even though price action looks choppy. The histogram is expanding positively, which typically precedes price following momentum higher. Now, the ADX at 15.3 tells us we're in a weak trend environment, but don't mistake that for bearish. Low ADX during consolidation often means the market is coiling energy for the next directional move, and with MACD bullish, that move is more likely to be upward. RSI at 52.2 sits perfectly neutral with massive room to run before hitting overbought territory at 70. This is ideal for swing longs because you're not buying into extended conditions. The Stochastic at 57.0 mirrors this neutrality, while the MFI (Money Flow Index) at 42.8 is particularly interesting. MFI below 50 during a consolidation phase with price holding support suggests we're not seeing heavy distribution from smart money. If whales were dumping, MFI would be diving toward oversold while price breaks support, that's not happening here. Bollinger Bands are providing clear technical boundaries for this setup. Price is trading above the middle band at $91,404, which has flipped from resistance to support, a bullish development. The upper band sits at $93,744, just below that critical EMA200 at $93,911, creating a resistance cluster in the $93,700-$94,200 range. The lower band at $89,064 represents the extreme downside scenario, but we'd need to lose multiple support layers to get there. The current BB position (above middle, below upper) is typical of consolidation before continuation moves. Volume analysis is revealing. Current volume at $12,060 is significantly below the average of $26,267, sitting at roughly 46% of normal activity. In isolation, low volume might seem bearish, but context matters. When price consolidates on low volume above key support levels, it typically indicates larger players aren't actively selling, they're waiting. Distribution phases show high volume with price failing to make progress. This looks more like accumulation or at minimum, a lack of selling pressure. Once volume returns, if it comes with upside price action, that's your breakout confirmation signal. The wick analysis adds another layer of insight. Upper wicks at 33.9% versus lower wicks at 24.1% shows sellers are stepping in at higher prices (around that $93,700-$94,200 resistance zone), but buyers are absorbing that selling pressure without letting price collapse. This tug-of-war is creating the consolidation, but the fact that we're holding above $92,000 despite repeated upper wick rejections suggests demand is strong enough to eventually push through supply. Looking at support and resistance levels with precision: Immediate support sits at $92,000 (psychological level), then $91,578 (EMA20), followed by $91,404 (BB middle). The critical support that must hold for bulls is $90,985 (EMA50), with final line in the sand at $90,800. Below $90,800, the higher low structure breaks and we'd likely see a flush toward $89,064 (BB lower) or even $88,500. On the upside, resistance layers at $93,744 (BB upper), $93,911 (EMA200), and $94,221 (24h high). A break and hold above $94,200 would be significant, flipping the EMA200 from resistance to support and likely triggering momentum algorithms. For a concrete trading setup, here's what I'm watching: Entry zone is $92,000-$92,500, essentially current levels where we're consolidating. This gives you a defined risk entry rather than chasing breakouts. Stop loss goes at $90,800, which represents the invalidation point where the bullish structure breaks (losing EMA50 and higher low pattern). That's roughly a 1.6% risk from current price. Take profit targets: TP1 at $94,200 (2.0% gain, 1:1.25 R/R) for the conservative BB upper breakout, TP2 at $95,500 (3.4% gain, 1:2.1 R/R) for the EMA200 reclaim with extension, and TP3 at $97,000 (5.0% gain, 1:3.1 R/R) for those riding momentum. Scale out at each level to lock profits while leaving room to catch a larger move. The key trigger to watch is volume returning on the breakout attempt. If BTC pushes toward $93,700-$94,000 and volume surges above the $26,267 average, that's your confirmation to add to positions or enter if you missed the initial setup. Conversely, if we approach resistance on weak volume (sub $15,000), that's a fade opportunity rather than a buy signal, expect rejection back to $92,000 support. Risk-reward clearly favors the long side here with 1:2 to 1:3 setups available, solid moving average support underneath, bullish MACD momentum, and neutral oscillators with room to run. The main risk is a macro catalyst or sudden volume spike that breaks $90,800 support, but technically, the path of least resistance appears to be higher once this consolidation resolves. What are you thinking here, are you playing this consolidation for the breakout or waiting for clearer confirmation above $94,000?Got another rejection from EMA200 (Red line on the chart)