
sofex
@t_sofex

تریدر چه نمادی را توصیه به خرید کرده؟
سابقه خرید
تخمین بازدهی ماه به ماه تریدر
پیام های تریدر
فیلتر
نوع پیام
راز ساخت استراتژیهای معاملاتی برنده: ۵ گام حیاتی که باید بدانید!
As the title says, I want to share knowledge & important insights into the best practices for creating robust, trustworthy and profitable trading Strategies here on TradingView. These bits of information that my team I have gathered throughout the years and have managed to learn through mostly trial and error. Costly errors too . Many of these points more professional traders know, however, there are some that are quite innovative for all levels of experience in my opinion. Please, feel free to correct me or add more in the comments. There are a few strategic and tactical changes to our process that made a noticeable difference in the quality of Strategies and Indicators immediately. Firstly and most importantly, we have all heard about it, but it is having the most data available. A good algorithm, when being built NEEDS to have as many market situations in its training data as possible. Choppy markets, uptrends, downtrends, fakeouts, manipulations - all of these are necessary for the strategy to learn the possible market conditions as much as possible and be prepared for trading on unknown data. Many may have heard the phrase "History doesn't repeat itself but rhymes well" - you need to have the whole dictionary of price movements to be able to spot when it rhymes and act accordingly. The TradingView Ultimate plan offers the most data in terms of historical candles and is best suited for creating robust strategies. ___ Secondly, of course, robustness tests. Your algorithm can perform amazingly on training data, but start losing immediately in real time, even if you have trained it on decades of data. These include Monte-carlo simulations to see best and worst scenarios during the training period. Tests also include the fundamentally important out-of-sample checks . For those who aren’t familiar - this means that you should separate data into training sets and testing sets. You should train your algorithm on some data, then perform a test on unknown to the optimization process data. It's common practice to separate data as 20% training / 20% unknown / 20% training etc. to build a data set that will show how your algorithm performs on unknown to it market movements. Out of sample tests are crucial and you can never trust a strategy that has not been through them. Walk-forward simulations are similar - you train your algorithm on X amount of data and simulate real-time price feeds and monitor how it performs. You can use the Replay function of TradingView to do walk-forward tests! When you are doing robustness tests, we have found that a stable strategy performs around 90% similarly in terms of win rate and Sortino ratio compared to training data. The higher the correlation between training performance and out of sample performance, the more risk you can allocate to this algorithm. ___ Now lets move onto some more niche details. Markets don’t behave the same when they are trending downward and when they are trending upwards. We have found that separating parameters for optimization into two - for long and for short - independent of each other, has greatly improved performance and also stability. Logically it is obvious when you look at market movements. In our case, with cryptocurrencies, there is a clear difference between the duration and intensity of “dumps” and “pumps”. This is normal, since the psychology of traders is different during bearish and bullish periods. Yes, introducing double the amount of parameters into an algorithm, once for long, once for short, can carry the risk of overfitting since the better the optimizer (manual or not), the better the values will be adjusted to fit training data. But if you apply the robustness tests mentioned above, you will find that performance is greatly increased by simply splitting trade logic between long and short. Same goes for indicators. Some indicators are great for uptrends but not for downtrends. Why have conditions for short positions that include indicators that are great for longs but suck at shorting, when you can use ones that perform better in the given context? ___ Moving on - while overfitting is the main worry when making an algorithm, underoptimization as a result of fear of overfitting is a big threat too . You need to find the right balance by using robustness tests. In the beginning, we had limited access to software to test our strategies out of sample and we found out that we were underoptimizing because we were scared of overfitting, while in reality we were just holding back the performance out of fear. Whats worse is we attributed the losses in live trading to what we thought was overfitting, while in reality we were handicapping the algorithm out of fear. ___ Finally, and this relates to trading in general too, we put in place very strict rules and guidelines on what indicators to use in combination with others and what their parameter range is. We went right to theory and capped the values for each indicator to be within the predefined limits. A simple example is MACD . Your optimizer might make a condition that includes MACD with a fast length of 200, slow length of 160 and signal length of 100. This may look amazing on backtesting and may work for a bit on live testing, but these values are FUNDAMENTALLY wrong (Investopedia, MACD). You must know what each indicator does and how it calculates its values. Having a fast length bigger than the slow one is completely backwards, but the results may show otherwise. When you optimize any strategy, manually or with the help of a software, be mindful of the theory. Mathematical formulas don’t care about the indicator’s logic, only about the best combination of numbers to reach the goal you are optimizing for - be it % Return, Profit Factor or other. Parabolic SAR is another one - you can optimize values like 0.267; 0.001; 0.7899 or the sort and have great performance on backtesting. This, however, is completely wrong when you look into the indicator and it’s default values (Investopedia, Parabolic SAR). To prevent overfitting and ensure a stable profitability over time, make sure that all parameters are within their theoretical limits and constraints, ideally very close to their default values. Thank you for reading this long essay and I hope that at least some of our experience will help you in the future. We have suffered greatly due to things like not following trading theory and leaving it all up to pure mathematical optimization, which is ignorant of the principles of the indicators. The separation between Long / Short logic was also an amazing instant improvement. View the linked idea where we explain the psychology of risk management and suggest a few great ways to calculate and manage your risk when trading - just as important as the strategy itself! What do you think? Do you use any of these methods; Or better ones? Let us know in the comments.
اتریوم در راه ثبت رکورد جدید؛ منتظر سکون بیت کوین باشید!
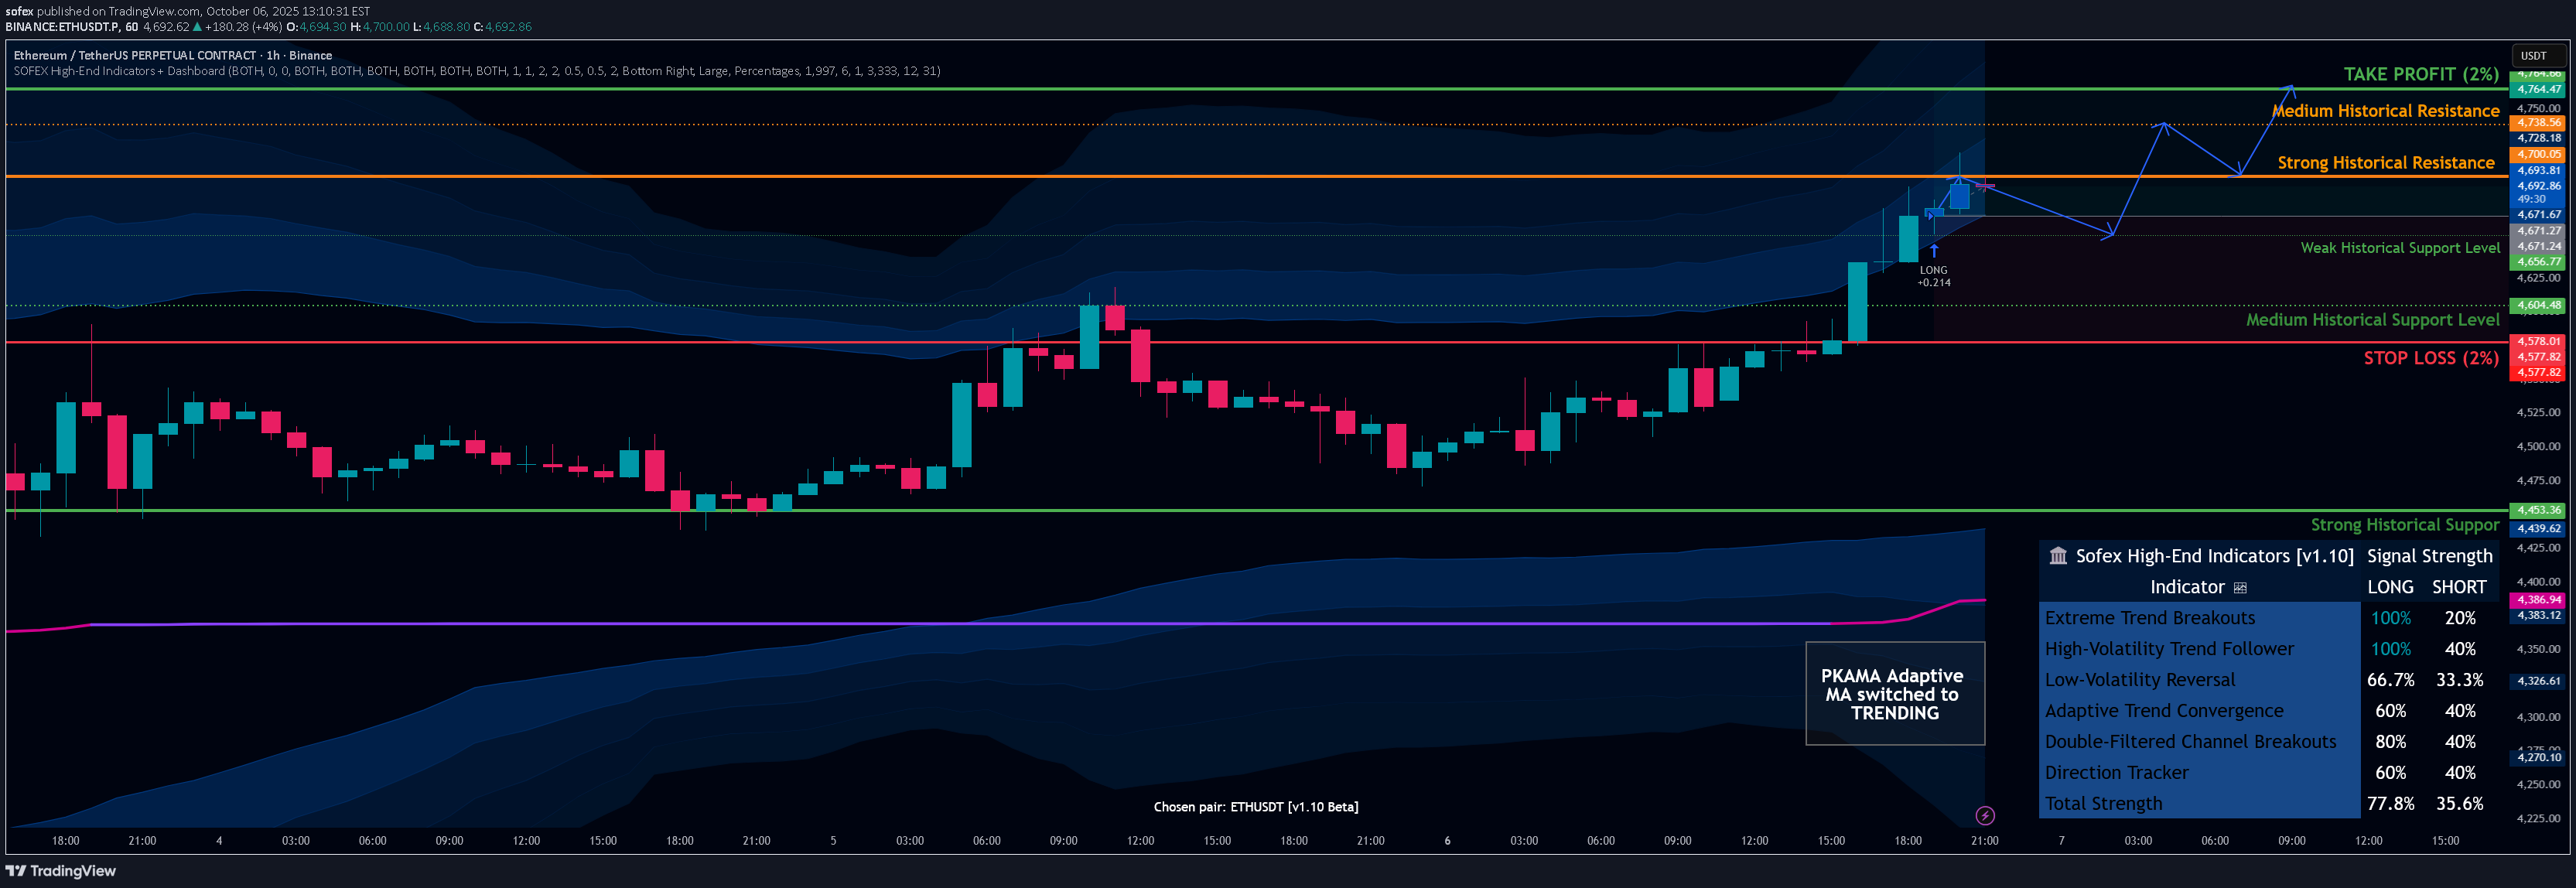
ما Ethusdt.p الگوریتم باعث ایجاد موقعیت طولانی شد. تمام شاخص های فنی ما یک قدرت سیگنال بلند متوسط 77.8 ٪ را محاسبه می کنند بشر مهمترین قطعه "شواهد" برای ما حدس و گمان مبنی بر اینکه Ethereum در یک ماه آینده به سطح جدید ATH رسید این واقعیت است که شکستن روند شدید و پیرو روند بالایی بالا شرایط باعث ایجاد تجارت در کنار هم شد و در زمان نوشتن در 100 ٪ قدرت سیگنال طولانی قرار گرفت. شرایط دیگر برک آوت ما - شکستن کانال دو فیلتر در قدرت سیگنال طولانی 80 ٪ نیز قرار دارد. چرا این همه مرتبط است؟ از آنجا که این شرایط (از هر یک از شاخص های فنی 5-6 ساخته شده است) به دنبال این است که به دنبال روند از همان ابتدا ، تشخیص و ورود به شکستن را وارد کنید. در حالی که برنامه ریزی شده برای خروج 2 ٪ است ، ما معتقدیم که بزرگتر move در حال آماده سازی است. ما اخیراً دیدیم btcusdt.p رسیدن به اوج بی سابقه ای. از نظر تاریخی ، هنگامی که Bitcoin رشد پارابولیک را متوقف می کند و پول شروع می شود به فیات و سایر رمزنگاری ها - در ابتدا از مزایای آن استفاده می کند. اساساً ، Ethereum ستون فقرات Smart-Contract و Web3 Revolution است. Solana ، Polkadot ، BNB و سایر سکه های Alt همه از دستگاه Ethereum virtual گرفته شده و الهام گرفته شده اند. این باعث می شود این سؤال را بپرسیم - چرا Ethereum خیلی عقب مانده است Bitcoin؟ خوب ، چند پاسخ احتمالی وجود دارد و همه آنها به همان نتیجه گیری منتهی می شوند: - سولانا با داشتن موانع کمتری برای ورود ، بیشترین سود را از هیجان خرده فروشی در اطراف سکه های Meme کسب کرد. زبان برنامه نویسی آسان و وب سایت های ساده ، اما کاربردی و ارزان برای ایجاد این "خاطرات" یک تکه بزرگ از حجم خرده فروشی را از بین برد که در غیر این صورت به سمت Ethereum می رود. -سوئیچ Ethereum از اثبات کار به اثبات سهام در حال حاضر به اتمام رسیده است. انتشار پیش از POPOS era stack ETH به سرمایه گذاران بزرگ در طی سال گذشته سرانجام به یک نقطه از زمان و قیمت می رسد که در آن سودآورتر برای افراد بزرگ ETH است که برای شروع سرمایه گذاری اصلی خود انگیزه بیشتری پیدا می کنند. اصولاً - انگیزه کمتری برای فروش شما Ethereum و انگیزه های بیشتر برای جمع آوری بیشتر (و بنابراین خرید در محل) وجود دارد. از تصویر بالا می بینیم که سطح 4700 دلار سطح مقاومت major است. پس از شکسته شدن ، ما برای آنچه ممکن است اتفاق بیفتد ، منابع تاریخی بسیار کمی داریم. یا به عبارت دیگر - 4700 سطحی است که ما پس از اینکه امیدوارم به پشتیبانی تبدیل شویم ، به کشف قیمت می پردازیم. زمان زیادی در این چرخه رمزنگاری باقی نمی ماند. و Ethereum تمایل به افزایش پارابولیک آن به پایان چرخه 4 ساله کلاسیک است.
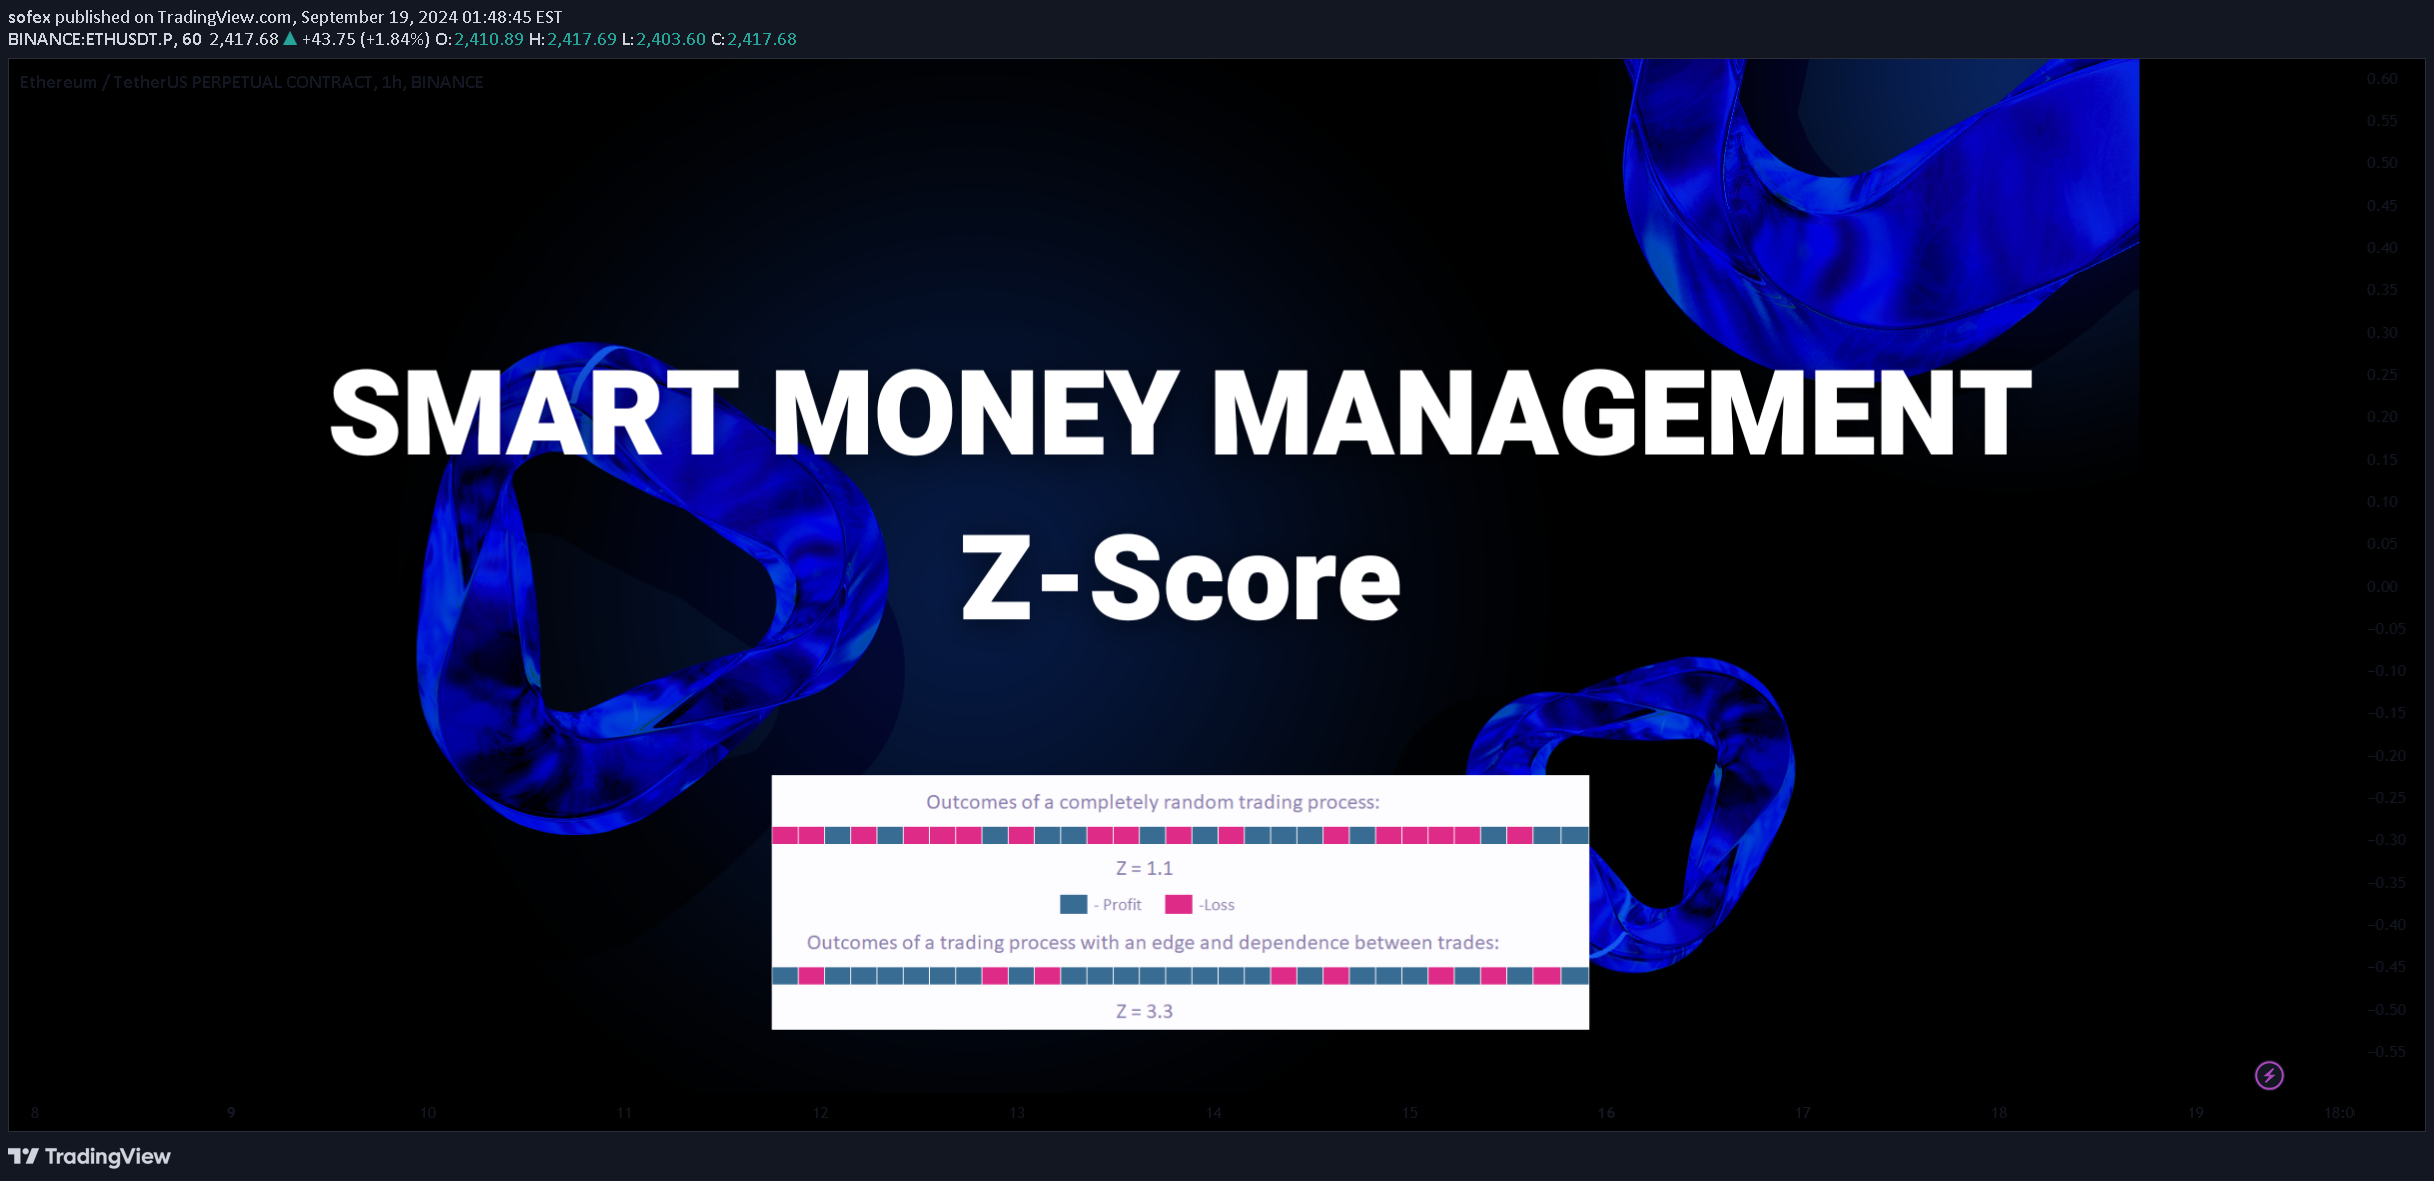
How to Use Z-Score for Smarter Trading Strategies In trading, success often depends on your ability to predict market movements and manage your capital efficiently. One of the tools that can give traders an edge is the Z-score, a statistical measure that helps identify patterns in win and loss streaks. This article breaks down what the Z-score is, how it works in trading, and how you can use it to optimize your strategies. What is Z-Score in Trading? In simple terms, Z-score measures the distance between an observed outcome (like a win or loss) and the average result in a set of data. In the context of trading, this data set typically represents your wins and losses over time. The Z-score is most commonly found in the range of -3 to +3, with higher scores indicating a greater probability of consecutive wins followed by losses, and lower scores representing more random, unpredictable outcomes. A high Z-score suggests that your trading strategy is likely to go through a series of wins, followed by a series of losses . This information can help you adjust your capital allocation and manage risk better. Conversely, a low Z-score points to a more chaotic trading environment where wins and losses alternate with little predictability. How Z-Score Can Improve Your Trading Decisions 1 • Understanding Random vs. Strategic Trading Traders who act without a strategy tend to experience unpredictable results — one win here, one loss there. This type of trading is driven by randomness and typically has a low Z-score, meaning there is no clear pattern of consecutive wins or losses. On the other hand, traders who use strategic approaches — like the ones developed by SOFEX —tend to see more predictable outcomes. These strategies often have a higher Z-score, signaling that you can expect a string of wins, followed by a string of losses. 2 • Capital Management Based on Z-Score The Z-score provides crucial insights into when to adjust your capital. The general rule of thumb is: • After a streak of wins, reduce your capital. The Z-score indicates that a loss is likely to follow after a series of wins. • After a loss or streak of losses, increase your capital, as a win is statistically more likely to follow. For example, if you start with $1,000 and win multiple times in a row, your first instinct might be to increase your capital to $2,000 or even $3,000. However, this is where most traders make a critical mistake . Based on the Z-score model, it's better to decrease your capital after consecutive wins, as losses are statistically imminent. Conversely, increase your capital after a loss to benefit from the upcoming win streak. 3 • Avoid Overconfidence After Wins Traders often fall into the trap of increasing their stake after a series of wins, assuming that the market will continue to favor them. However, the Z-score suggests that after 3-5 wins, you should lower your risk and decrease the amount you're trading. By doing so, you protect your profits from the losses that typically follow a winning streak. 4 • How to Apply This in Practice Let’s walk through a typical trading scenario: You start with $1,000. You win multiple trades, so you might be tempted to increase your capital. However, if you understand the Z-score, you’ll know that after several wins, a loss is likely coming soon . Instead of increasing capital, reduce your stake, say, to $500 or $800. When the inevitable loss comes, you’ve minimized your risk. After this loss, you can now increase your capital back to $1,500 or $2,000, as the Z-score suggests that a win streak is more probable after a loss. By following this approach, you avoid major losses after a win streak, and you’re well-positioned to capitalize on the next string of wins. Key Takeaways for Traders • Z-score predicts patterns in trading, with high Z-scores indicating win streaks followed by losses, and low Z-scores indicating a more random, unpredictable pattern. • After consecutive wins, lower your capital to protect your profits, as losses are statistically likely to follow. • After consecutive losses, increase your capital to take advantage of the upcoming win streak. Managing your capital based on Z-score predictions allows you to minimize losses and maximize profits, even during market fluctuations. Final Thoughts Trading is as much about managing risk as it is about making profits. The Z-score strategy can help traders anticipate win and loss streaks, allowing them to adjust their capital allocation more effectively. By following this model, you can protect yourself from large losses and make smarter decisions about when to scale up or down your trades. In summary, to optimize your trading: • Lower capital after multiple wins to avoid large losses. • Increase capital after losses to take advantage of win streaks. Implementing these strategies based on the Z-score will not only improve your trading outcomes but also help you build long-term, sustainable profitability. So the next time you're riding a win streak, remember: it's not the time to increase your stake—it's time to strategically lower it and lock in your profits. View our video on the subject here . Thank you for reading. Read our article on the Kelly Criterion in the Related Ideas section! Z-Score diagram taken from EarnForex .
In the rapidly evolving world of cryptocurrency, the European Union has taken a significant and important step forward with the introduction of the Markets in Crypto-Assets Regulation (MiCA). This groundbreaking regulatory framework marks a pivotal moment for the crypto market within the EU, promising to bring much-needed clarity and stability to an industry that has long been likened to the Wild West due to its volatility and lack of standardization. The European Union is a leader in creating legislation for emerging technologies. This became clear with the introduction of GDPR, which protects internet users’ personal data, the AI Act that aims to protect citizens of the EU from malpractice, such as cognitive manipulation of people and social scoring, and now - MiCA. Paving the way forward for others, the EU is evolving its digital legislation frameworks faster than other unions or countries. This article delves into how MiCA will reshape the landscape for EU traders, impacting everything - from the way they interact with crypto assets to the broader market dynamics they navigate daily. Why do we need regulations like MiCA? If there are no regulations, markets can run wild and experience giant increases, however when the fun is over and people lose money to fraud and even large-scale bankruptcy of exchanges - investors, especially institutional ones, will not dare place their money in crypto projects and companies. And since for investors, money is trust - the cryptocurrency market is doomed without proper regulation. On the flip side, extremely stringent and disorganized legislation can lead to the same outcome. Countries struggle with the abstract nature of cryptocurrencies, and many have expressed an outright desire to ban them, seeing as it is the easier option. That is why MiCA is a well-devised framework for others to follow - It is focused and comprehensive. Some may argue that cryptocurrencies are meant to be decentralized, unregulated and follow a laissez-faire approach. While this is possible, more so for some cryptocurrencies than others, there can be no growth in these markets as new projects need to have banking and investors behind them to realize their blockchain-based ideas. It is also unrealistic to think that such a clandestine financial system will never cross paths with the regular banking system. What exactly is MiCA? The inception of the Markets in Crypto-Assets Regulation (MiCA) is rooted in the European Union's recognition of the growing significance of cryptocurrencies and the associated risks in an unregulated environment. The primary catalyst for MiCA's development was the need for regulatory clarity in the burgeoning crypto market, which had been expanding rapidly without a standardized regulatory framework since the birth of Bitcoin in 2009. This lack of regulation posed risks such as fraud, market manipulation and financial instability. These concerns were heightened by incidents like the surge in initial coin offerings (ICOs), the capitulation of multiple large exchanges and the ironic instability of stable-coins. MiCA was proposed to provide a harmonized regulatory framework for crypto-assets that are not covered under existing EU financial legislation. The objective was to safeguard investors, maintain financial stability, and promote innovation within a secure and transparent environment. By introducing clear rules, MiCA aims to legitimize the crypto market, making it safer and more attractive for investors and consumers while mitigating the potential for financial crime and market manipulation. This move towards regulation reflects a global trend of governments and financial authorities worldwide striving to balance the benefits of innovation in the digital asset space with the need for consumer protection and market integrity. As such, MiCA represents a significant step by the EU in establishing a comprehensive regulatory regime for crypto-assets, setting a precedent that could influence global standards in cryptocurrency regulation. Key Points of MiCA MiCA introduces several key provisions that are set to transform the crypto-asset landscape in the European Union. The areas that are discussed and regulated the most are the areas where incidents have happened and people have lost their funds. It is important not to make the same mistakes as before. Exchanges & Brokerages One of the primary aspects of MiCA is the establishment of stringent authorization requirements for crypto-asset service providers. Under MiCA, any entity aiming to offer services related to crypto-assets, including trading, custody, or advisory services, must obtain authorization from one of the EU's national financial regulators. This process is designed to ensure that providers adhere to high standards of operational conduct, governance, and consumer protection outlined in the legislation. Crypto exchanges have gone bankrupt, been hacked or shut down abruptly in crypto’s short history. The aim of legislatures is to prevent these collapses or stop them in their tracks. Initial Public / Coin Offerings Another fundamental component of MiCA is the regulation of public offerings of crypto-assets. Companies intending to offer crypto-assets to the public are required to publish a detailed white paper. This document must provide clear, fair, and comprehensive information about the risks involved, ensuring that potential buyers are well-informed. The regulations aim to prevent misleading practices and enhance transparency in the market. Until now, many ICOs do publish white papers, however they can be purely fictional, written to trick the untrained eye into thinking the project is professionally done. Furthermore, this official process of submitting a white paper will ensure that the people behind the project are known. This will prevent people from faking their identities in order to anonymously scam their clients. Stablecoins MiCA also specifically addresses the regulation of stablecoins, which are categorized as either e-money tokens (EMTs) or asset-referenced tokens (ARTs). EMTs are stablecoins pegged to the value of a fiat currency, such as USDT, USDC and BUSD. ARTs are linked to other assets, such as WETH, WBTC. MiCA mandates that stablecoins must maintain adequate reserves and adhere to governance standards. Furthermore, there are stringent rules for stablecoins not pegged to EU currencies, including a cap on the number of transactions per day, aimed at preventing these assets from undermining the Euro. This approach to stablecoins is a response to concerns about their potential impact on financial stability and monetary policy. These concerns are justified, following the collapse of a few large market cap stable-coins during 2022. Through these provisions, MiCA aims to establish a secure and transparent environment for the trading and use of crypto-assets, ensuring that the rights of investors are protected while fostering innovation in the sector. Conclusion The introduction of MiCA by the European Union represents a watershed moment for the crypto-asset market. By establishing a harmonized regulatory framework, MiCA seeks to provide clarity, enhance market integrity, and protect investors, all while fostering an environment conducive to innovation. For EU traders, these regulations offer a more secure and transparent trading landscape, albeit with increased compliance obligations. The provisions on stablecoins, in particular, demonstrate a nuanced approach to different types of crypto-assets. As MiCA comes into full effect, its influence is expected to extend beyond the EU, potentially setting a precedent for global crypto-asset regulation. For traders and investors, staying informed and adapting to these regulatory changes will be key to navigating the evolving crypto market landscape.
The difference between trading and gambling. This article will shine a light on the most frequent mistakes that traders make. These mistakes blur the thin line between trading and gambling. Many people have spoken on this topic, but we truly believe that it is still not sufficient, and traders should be better educated on how to avoid gambling behaviour and emotional outbursts. When we speak about trading versus gambling, we define gambling as the act of making irrational, emotional and quick decisions. Most of the time, these decisions are based on greed, and sometimes fear of the trader. Let’s dive into the exact problems we have personally experienced thousands of times, and want to help others avoid. 1 ♠ Bad Money Management This is something that everyone has heard at least once, but seems to naively ignore in the hopes that it is not that important . It is the most important . When a trader enters trades, it is exceptionally alluring to enter with all of their money, or close to all of it. In gambling terms, that is going “All in”, or “All or nothing”. As a rule of thumb, both traders and gamblers should only place or bet money that they can afford to lose. Thankfully, at least in trading one can limit their loss for that specific trade, by placing a stop loss or exiting before total liquidation. In Poker, you can’t fold when you are “All in” and take a portion of your money back. However, that does not mean entering trades with full capital, even with a stop-loss, is going to give you exponential returns and feed your greed for profits. Traders should enter positions with a small amount of their full capital, to limit the damage from losses. Yes, you also limit the possibility that you win a few trades in a row with all of your money and… There goes the greed we mentioned. The “globally perfect” percent of equity you need to enter trades to reach that balance between being too cautious and too greedy does not exist. There are methods, like the Kelly Criterion, as described in our previous Idea (see related ideas below), that help you optimize your money management. Always ask yourself, “How much can I afford to lose?”. Aim for a balanced approach. This way you can position yourself within the market for a long and a good time, not just for a few lucky wins. Greedy money management, or lack thereof, ends in liquidations and heartbreak. 2 ♣ The Use of Leverage Anyone who has tried using leverage, knows how easy it is to lose your position (or full) capital in seconds. Using leverage is mainly sold to retail traders as a tool for them to loan money from the exchange or broker and bet with it. It is extremely profitable for institutions, since it multiplies the fees you pay them ten to one hundred-fold. In our opinion, leverage isn’t something that should be entirely avoided. However, it should be limited as much as possible. We cannot deny that using 1-5x leverage can be beneficial for people with small accounts and a thirst for growth, however as the leverage grows, the more of a gambler you become. We often see people share profits made using 20+ times leverage. Some even use ridiculous leverages within the range of 50-125x. If you are doing that, do you truly trust your entry so much that you believe the market won’t move 1% against your decision and liquidate you immediately? At this point, the gambling aspect should be evident, and it goes without saying that you should not touch this “125x Golden Apple”, like Eve in the Garden of Eden. Especially when you see a snake-exchange promote it. If you use a low amount of leverage, and grow your account to the point where you don’t need it for your personal goals in terms of monetary profit. You should consider stopping the use of it, and at least know you’ll be able to sleep at night. 3 ♥ Always Being In A Position Always being either long or short leads to addiction and becomes gambling. While we don’t have scientific proof of that, we can give you our own experience as an example. To be a profitable trader, you do not need to always be in a position, or chase every single move on the market. You need to develop the ability just to sit back and watch, analyse and make conscious decisions. Let the bad opportunities trick someone else, while you patiently wait for all your pre-defined conditions to give you a real signal. When you think of trading, remember that the market has a trend the minority (around 20-30%) of the time. If you are always in a position, this means that 70-80% of the time you are hoping that something will happen in your favour. That, by definition, is gambling. Another aspect, that we have experienced a lot, is that while you remain in a position, especially if you have used leverage, you are constantly paying your exchange fees. You can be in a short position for a week and pay daily fees which only damage your equity, and therefore margin ratio. So why not just sit back, be patient and define some concrete rules for entering and exiting? Avoid risky situations, and let the market bring the profits whenever it decides to. 4 ♦ Chasing Huge Profits Hold your horses, Warren Buffett. Through blood, sweat and tears, we can promise you that you cannot seriously expect to make 100% every month, no matter what magical backtesting or statistics you are calculating your future fortune on. Moreover, you will realise that consistently making 2-5% a month is an excellent career for a trader. Yes, the markets can be good friends for a while, you may stumble into a bull-run and start making double-digit profits from a trade from time to time. Double-digit losses will also follow if you lose your sight in a cloud of euphoria and greed. Many times, you can follow the “profit is profit” principle, and exit at a small win if the risk of loss is increasing. 5 ♠ Being Sentimental Towards Given Assets You may have a fondness for Bitcoin and Tesla, and we understand that because we too have our favourites. Perhaps you’re deeply attached to the vision, community and purpose of certain projects. On the flip side, there may be projects that you completely despise and hope their prices plummet to zero. What you personally like and dislike, should not interfere with your work as a trader. Introducing such strong emotions into your trading will lead you into a loop of irrational decisions. You may find yourself asking, “Why isn’t this price going parabolic with how good the project is?”. This sounds, from personal experience, quite similar to sitting at a Roulette table and asking: “Why does it keep landing on red when I’ve been constantly betting black? It has to change any moment now”. First and foremost, you may be completely wrong, but most importantly – it could go parabolic, but trying to predict the exact time or expecting it to happen immediately and placing your “bet” on that is again, gambling. Don’t get attached to projects when trading. If you are an investor who just wants to hold their shares in an awesome company, or cryptocurrency, that is perfectly fine, hold them as much as you want. The key is to make an important distinction between trading and investing, and to base your strategy on the hand that the market provides you with. 6 ♣ Putting Your Eggs In One Basket We all have heard of diversification, but how you approach it is crucial. A trader should always have their capital spread between at least a few assets. Furthermore, the trading strategy for each asset must be distinct, or in other words – they should not rely on the same entry and exit conditions for different assets. The markets behave differently for each asset, and you cannot be profitable with some magical indicator or strategy with a “one-size-fits-all” style. Divide your trades into different pairs and asset classes, and study each market individually to properly diversify. Manage the equity you put into each trade carefully! Conclusion The takeaway we want you as a reader to have from this article is that trading without consciously controlling your emotions inevitably leads to great loss and most importantly, a lot of stress. We hate stress. Trading and life in general is exponentially harder when you are under stress. Control your risk, sleep easy, and let the market bring you profits. Reaching this level of Zen will not be easy, but it is inevitable. Be happy when you make a profit, no matter how small or big. A lot of small profits and proper money management complete the vision you have of a successful business. Ultimately, trading is just that – work, not gambling or a pastime activity. Treat it as work and always remember to never rely on luck. The advice we’ve included here is written by a few experienced gamblers… Oops, I meant traders 😉. We hope that some of the lessons we’ve had to painstakingly learn through trial and error can now be shared with those who are interested. Of course, none of this constitutes investment advice. It’s merely a friendly heads-up.
موقعیتسنجی چیست و چرا مهم است؟ اندازه موقعیت به میزان ریسکی اشاره دارد - پول، قراردادها، سهام و غیره - که یک معاملهگر هنگام ورود به یک موقعیت در بازار مالی استفاده میکند. برای سهولت، فرض میکنیم که معاملهگران انتظار دارند ۱۰۰٪ سود یا زیان در نتیجه از دست دادن سود داشته باشند. روشهای رایج برای تعیین اندازه موقعیت عبارتند از: استفاده از مقدار معینی سرمایه در هر معامله. برای مثال، یک معاملهگر هر بار با ۱۰۰ دلار وارد میشود. این بدان معناست که مهم نیست موقعیت چیست، حداکثر ریسک آن سرمایه تعیینشده بود. این سادهترین راه برای تعیین اندازه موقعیتها است و هدف آن تولید linear در پورتفوی آنها است. استفاده از مقدار معینی قرارداد در هر معامله. یک معاملهگر با ۱ قرارداد از دارایی معین در هر معامله وارد میشود. برای مثال، هنگام معامله بیت کوین، این به معنای ۱ قرارداد برابر با ۱ Bitcoin است. این رویکرد میتواند برای آزمایش و تجزیه و تحلیل دشوار باشد، زیرا ارزش دلاری قرارداد با گذشت زمان تغییر میکند. معاملهای که در زمان معینی انجام شده است که قیمت دلار بالا است، ممکن است به عنوان win بزرگتر یا ضرر نشان داده شود، و معاملهای در زمانی که قیمت دلار قرارداد کمتر است، میتواند به عنوان win کوچکتر یا ضرر نشان داده شود. درصد از کل سهام - این روش توسط معاملهگرانی استفاده میشود که تصمیم میگیرند با درصد معینی از کل سهام خود در هر موقعیت وارد شوند. معمولاً برای دستیابی به "رشد نمایی" اندازه پورتفوی استفاده میشود. با این حال، سناریوی تخیلی زیر نشان میدهد که چگونه شانس نقش major مهمی در نتیجه چنین روش اندازهگیری ایفا میکند. فرض کنیم که معاملهگر تصمیم گرفته است با ۵۰٪ از کل سرمایه خود در هر موقعیت وارد شود. این بدان معناست که با داشتن ۱۰۰۰ دلار سهام، یک معاملهگر برای اولین بار با ۵۰۰ دلار وارد میشود. این میتواند منجر به دو موقعیت برای معامله اول شود: - موقعیت سودآور است و کل سهام اکنون ۱۵۰۰ دلار است - موقعیت زیانده است و کل سهام اکنون ۵۰۰ دلار است. وقتی به این دو مورد نگاه میکنیم، میتوانیم عمیقتر به فرآیند معاملات برویم و به موقعیتهای دوم و سوم که وارد میشوند نگاه کنیم. اگر معامله اول زیانده باشد و فرض کنیم که دو معامله دوم سودآور هستند: الف) 500 * 0.5 = 250 ورودی، کل سرمایه در صورت سودآوری 750 دلار است ب) 750 * 0.5 = 375 ورودی، کل سرمایه در صورت سودآوری 1125 دلار است از طرف دیگر، اگر معامله اول سودآور باشد و فرض کنیم که دو معامله دوم نیز سودآور هستند: الف) 1500 * 0.5 = 750 ورودی، کل سرمایه در صورت سودآوری 2250 دلار است ب) 2250 * 0.5 = 1125 ورودی، کل سرمایه در صورت سودآوری 3375 دلار است بیایید خلاصه کنیم: معاملهگر با ۵۰٪ سرمایه وارد میشود و بر اساس نتیجه معامله اول، حتی اگر دو معامله بعدی سودآور باشند، تفاوت بین سهام نهایی این است: الف) معامله اول باخت: ۱۱۲۵ دلار ب) معامله اول برد: ۳۳۷۵ دلار این اختلاف شدید ۲۲۵۰ دلاری ناشی از معامله اول است و اینکه سودآور است یا خیر. این نشان میدهد که شانس هنگام معامله با درصد سهام بسیار مهم است، زیرا آن معامله اول میتواند به هر طریقی پیش برود. https://www.tradingview.com/x/qHhX6jyo/ معاملهگران اغلب عامل شانس را که برای دستیابی به رشد نمایی به آن نیاز دارند، در نظر نمیگیرند. این منجر به انتظارات بسیار غیرواقعی از عملکرد استراتژی معاملاتی آنها میشود. معیار کلی چیست؟ استراتژی درصد سهام، همانطور که دیدیم، به شانس بستگی دارد و بسیار مشکل است. معیار کلی بر اساس آن روش ساخته شده است، اما عوامل استراتژی معاملهگر و عملکرد تاریخی را برای ایجاد روش جدیدی برای تعیین اندازه موقعیتها در نظر میگیرد. این فرمول ریاضی توسط سرمایهگذارانی به کار گرفته میشود که به دنبال ارتقای اهداف رشد سرمایه خود هستند. این فرض میکند که سرمایهگذاران مایل به سرمایهگذاری مجدد سود خود و قرار دادن آنها در معرض خطرات احتمالی در معاملات بعدی هستند. هدف اصلی این فرمول تعیین تخصیص بهینه سرمایه برای هر معامله است. معیار کلی دو جزء اساسی را در بر میگیرد: *فاکتور احتمال برد (W): این فاکتور نشان دهنده احتمال بازده مثبت یک معامله است. در زمینه استراتژیهای TradingView، این به درصد سودآور اشاره دارد. *نسبت سود/زیان (R): این نسبت با تقسیم حداکثر پتانسیل سود بر حداکثر پتانسیل زیان محاسبه میشود. میتوان آن را به عنوان نسبت Take Profit / Stop-Loss در نظر گرفت. همچنین میتوان آن را به عنوان بزرگترین معامله برنده / بزرگترین معامله بازنده از تب تست برگشتی در نظر گرفت. نتیجه این فرمول راهنماییهایی را در اختیار سرمایهگذاران قرار میدهد در مورد اینکه چه نسبتی از کل سرمایه خود را به هر تلاش سرمایهگذاری اختصاص دهند. معمولاً به عنوان استراتژی کلی، فرمول کلی یا شرط کلی شناخته میشود، این فرمول را میتوان به صورت زیر بیان کرد: درصد کلی = W - (1 - W) / R جایی که: درصد کلی = درصد سهامی که معاملهگر باید در یک معامله قرار دهد W = فاکتور احتمال برد R = نسبت سود/زیان این درصد کلی، درصد پیشنهادی سهامی است که یک معاملهگر باید بر اساس این فرمول اندازهگیری در موقعیت خود قرار دهد. با تغییر احتمال برد و نسبت سود/زیان، معاملهگران قادر به استفاده مجدد از فرمول برای تنظیم اندازه موقعیت خود هستند. بیایید یک مثال از این فرمول را ببینیم. فرض کنیم نسبت سود/زیان ما (R) نسبت میانگین Win / میانگین زیان از آمار تست برگشتی TradingView است. فرض کنیم نسبت سود/زیان 0.965 است. همچنین، فرض کنیم که فاکتور احتمال برد، آمار درصد سودآور از پنجره تست برگشتی TradingView است. فرض کنیم 70٪ است. با این دادهها، درصد کلی ما این بود: درصد کلی = 0.7 - (1 - 0.7) / 0.965 = 0.38912 = 38.9٪ بنابراین، بر اساس این مثال تخیلی، معاملهگر باید حدود 38.9٪ از سهام خود را اختصاص دهد و نه بیشتر، تا طبق معیار کلی، اندازه موقعیت بهینه داشته باشد. فرمول کلی، در اصل، به این سوال پاسخ میدهد که "چه درصدی از سهام خود را باید در یک معامله استفاده کنم، تا بهینه باشد". در حالی که هیچ روشی کامل نیست، اما به طور گسترده در صنعت به عنوان راهی برای اندازهگیری دقیقتر موقعیتهایی استفاده میشود که از درصد سهام برای ورودیها استفاده میکنند. سلب مسئولیت احتیاط اگرچه پیروان معیار کلی ممکن است انتخاب کنند که فرمول را به روش مرسوم خود اعمال کنند، اما ضروری است که معایب احتمالی مرتبط با تخصیص بخش بیش از حد قابل توجهی از پورتفوی خود به یک دارایی واحد را تصدیق کنند. در پی تنوع، سرمایهگذاران باید در هنگام در نظر گرفتن سرمایهگذاریهایی که از 20٪ از کل سهام آنها فراتر میرود، احتیاط کنند، حتی اگر معیار کلی تخصیص قابل توجهتری را تایید کند. منبع اطلاعات در مورد معیار کلی https://www.investopedia.com/terms/k/kellycriterion.asp
"repainting" چیست؟ چرا مهم است که اسکریپت مورد استفاده شما آن را انجام ندهد؟ به طور کلی ، بازپرداخت مجدد یا تغییر خصوصیات بصری است. در زمینه تجزیه و تحلیل فنی و نمودار ، بازپرداخت به معنای تغییر داده های تاریخی مانند سیگنال ها و توطئه های بصری با flow زمان است. نتایج تاریخی ، که توسط اسکریپت هایی که رنگ آمیزی می شوند ، تولید می شوند ، اغلب کاملاً جذاب و حتی عالی به نظر می رسند. این به راحتی می تواند بسیاری از کاربران و معامله گران را در انتظارات خود گمراه کند و تجزیه و تحلیل کاذب data را ارائه دهد. در نتیجه ، کاربران ممکن است تصمیمات تجاری غیر منطقی بگیرند. چیزهای زیادی در مورد موضوع بازپرداخت نوشته شده است. در این مقاله ، ما 3 روش آسان برای بررسی اینکه آیا یک اسکریپت دوباره رنگ آمیزی نمی کند ، نشان داد. در طول جامعه TradingView ، یکی از پرسیده ترین سؤالات این است: "آیا دوباره رنگ آمیزی می کند؟" روش 1 به سادگی اسکریپت را به یک نمودار اضافه کنید و شروع به ایجاد هشدار دهید. در تنظیمات هشدار ، شرط را به عنوان فیلمنامه مورد نظر انتخاب کنید. اگر اسکریپت رنگ آمیزی شود ، متوجه یک علامت تعجب زرد در کنار عنوان پنجره هشدار شد. برای دیدن هشدار TradingView روی آن کلیک کنید. فیلمنامه با هشدار مجدد فیلمنامه بدون هشدار مجدد استثناء در بعضی موارد ، اسکریپت ها ممکن است حاوی داشبورد یا سایر توطئه های مختلف بصری باشد ، به استثنای تجزیه و تحلیل فنی داخلی. هشدار نشان داده شده است ، زیرا چنین عناصر بصری به اسکریپت نیاز دارند تا گزینه `calc_on_every_tick` را فعال کند. این گزینه تصاویر ، مانند داشبورد را در هر کنه به روز می کند و باعث می شود آنها در زمان واقعی data را نشان دهند. از طرف دیگر ، ممکن است سیگنال های "داخل نوار" تولید کند ، همچنین به عنوان سیگنال های تأیید نشده شناخته می شود. سیگنال های تأیید شده و تأیید نشده چیست؟ یک سیگنال تأیید نشده به گونه ای است که در طول شمع فعلی تولید می شود. داخل نوار است و می تواند با نوسانات قیمت فعلی ظاهر شود و از بین برود. این می تواند هشدارها را نیز ایجاد کند ، زیرا این یک مجرد مانند سایر موارد است. یک سیگنال تأیید شده فقط در هنگام بسته شدن شمع و قیمت قفل شده در تاریخ ایجاد می شود. در حالی که شمع (بگذارید بگوییم 1 ساعته) هنوز ادامه دارد ، نمی تواند تحریک و ناپدید شود. اگر از یک اسکریپت فقط دعوت شده استفاده می کنید ، همیشه می توانید برای نسخه ای بدون چنین عناصر بصری و بدون هشدار با ارائه دهنده تماس بگیرید. به این ترتیب می توانید با مقایسه مجدد خود را مجدداً تأیید کنید. شفافیت باید اولویت اصلی هر ارائه دهنده باشد. روش 2 برای بررسی مجدد از عملکرد "پخش مجدد" در نمودار استفاده کنید. قبل از انجام هر کاری ، عکس بگیرید یا ضبط کنید که سیگنال های موجود در نمودار وجود دارد. روی دکمه پخش مجدد در عنوان نمودار کلیک کنید و به یک زمان برگشت در تاریخ بروید. "بازی" را فشار داده و معاملات را در هنگام پخش مجدد با موارد بدون پخش مقایسه کنید. اگر ناسازگاری هایی وجود داشته باشد ، مانند معاملات مفقود شده یا اضافه شده در هنگام پخش مجدد ، این بدان معنی است که این اسکریپت دوباره رنگ آمیزی می کند. روش 3 یک هشدار ساده با اسکریپت به عنوان شرایطی در منوی تنظیمات ایجاد کنید. هیچ پیام ، وب سایت یا اعلان ها را ضمیمه نکنید. سپس فعالیت آن را در منوی "هشدارها ورود به سیستم" کنترل کنید. مواردی را که هشدار با زمان با سیگنال های موجود در نمودار ایجاد شده است ، مقایسه کنید. اگر ناسازگاری وجود داشته باشد ، این بدان معنی است که سیگنال ایجاد شده است اما از تاریخی data حذف شده است. این نشان می دهد که فیلمنامه رنگ آمیزی می کند. پایان در اینجا ، سه ساده ترین و سریعترین راه برای تشخیص مجدد یک فیلمنامه نشان داده شده است. همیشه هنگام استفاده از اسکریپت های مختلف ، احتیاط کنید ، به خصوص اگر به شما در تصمیم گیری در مورد تجارت یا تجزیه و تحلیل عملکرد تاریخی کمک کنند.
سلب مسئولیت
هر محتوا و مطالب مندرج در سایت و کانالهای رسمی ارتباطی سهمتو، جمعبندی نظرات و تحلیلهای شخصی و غیر تعهد آور بوده و هیچگونه توصیهای مبنی بر خرید، فروش، ورود و یا خروج از بازارهای مالی نمی باشد. همچنین کلیه اخبار و تحلیلهای مندرج در سایت و کانالها، صرفا بازنشر اطلاعات از منابع رسمی و غیر رسمی داخلی و خارجی است و بدیهی است استفاده کنندگان محتوای مذکور، مسئول پیگیری و حصول اطمینان از اصالت و درستی مطالب هستند. از این رو ضمن سلب مسئولیت اعلام میدارد مسئولیت هرنوع تصمیم گیری و اقدام و سود و زیان احتمالی در بازار سرمایه و ارز دیجیتال، با شخص معامله گر است.