
readCrypto
@t_readCrypto

تریدر چه نمادی را توصیه به خرید کرده؟
سابقه خرید
تخمین بازدهی ماه به ماه تریدر
پیام های تریدر
فیلتر
نوع پیام
readCrypto
Trading Methods to Increase Your Coin (Token) Holdings

با سلام خدمت شما بازرگانان ما را دنبال کنید تا سریع ترین اطلاعات را دریافت کنید. روز خوبی داشته باشید! ------------------------------------ افزایش ذخایر سکه (توکن) خود با حفظ سکه ها (توکن) که نشان دهنده سود هستند، یک روش مفید در بازارهای سرمایه گذاری است که در آن اعشار معامله می شود. برای استفاده از این روش، آشنایی با معاملات روزانه مزیت دارد. آشنایی با معاملات آتی نیز درک اصول را آسان تر می کند. - اصل تجارت ساده است. 1. اگر بر اساس قیمت خرید سود ایجاد شد، مبلغ خرید اصلی را بفروشید تا سکه (توکن) مربوط به سود حفظ شود. 2. اگر بر اساس قیمت خرید سود ایجاد شد، سکه (توکن) موجود را قبل از شروع کاهش قیمت بفروشید و سپس مقدار آن را با قیمت مناسب بفروشید تا تعداد سکه هایی (توکن) که در حال حاضر دارید افزایش یابد. - (نمودار ETHUSDT 1D) روش اصلی معاملات خرید در محدوده DOM(-60) ~ HA-Low و فروش در محدوده HA-High ~ DOM(60) است. با استفاده از این روش معاملاتی پایه، می توانید تعداد سکه ها (توکن ها) مربوط به سود را افزایش دهید. با این حال، از آنجایی که تجارت بر اساس حرکات نمودار 1 بعدی دشوار است، توصیه می شود که بر روی نمودار تایم فریم پایین تر معامله کنید (مثلاً 15 متر، 30m). - (نمودار 15m) می توانید با استفاده از روش معاملاتی پایه در نمودار 15m معامله کنید. با این حال، زمانی که محدوده HA-High ~ DOM(60) کاهش مییابد، بفروشید، و زمانی که شاخصهای DOM(-60) و HA-Low ملاقات کردند، خرید کنید تا دارایی سکه (توکن) خود را افزایش دهید. بنابراین، درک موقعیت های LONG و SHORT در معاملات آتی ضروری است. در ابتدا، بهتر است سعی نکنید که دارایی سکه (توکن) خود را به یکباره به شدت افزایش دهید. این به این دلیل است که اگر هنوز با معامله راحت نیستید، ممکن است معاملات ناخواسته انجام دهید. - هنگامی که قیمت در حال افزایش است، اندیکاتورهای StochRSI، TC و OBV روند صعودی داشت. در این زمان، اندیکاتور StochRSI نباید وارد منطقه اشباع خرید شود. نشانگر TC باید بالای 0 باقی بماند. نشانگر OBV باید بالای High Line باقی بماند. اگر اینطور نیست، به احتمال زیاد حفظ روند صعودی دشوار بود، بنابراین هنگام معامله احتیاط توصیه می شود. - برعکس، زمانی که قیمت در حال کاهش است، اندیکاتورهای StochRSI، TC و OBV روند نزولی را نشان داد. در این حالت، نشانگر TC باید زیر 0 باقی بماند. نشانگر OBV باید زیر خط پایین باقی بماند. اندیکاتور StochRSI تنها زمانی معتبر است که روند صعودی نباشد. - هنگام تعیین زمان معامله، سطوح حمایت از اندیکاتورهای نمایش داده شده در بخش قیمت را به همراه حرکت اندیکاتورهای کمکی در طول روندهای صعودی و نزولی بررسی کنید. به عبارت دیگر، مهم ترین عامل در معاملات این است که آیا اندیکاتورهای موجود در قسمت قیمت، نزدیک به خط افقی پشتیبانی می کنند یا خیر. اگر سود فقط 1 سکه (توکن) افزایش یابد، استراتژی معاملاتی قابل توجهی نیست. با این حال، افزایش تعداد سکه ها (توکن ها) نشان دهنده سود از طریق تراکنش های متعدد، در نهایت تعداد سکه ها (توکن ها) با اصل خرید صفر را افزایش می دهد و بار معاملات با صندوق های سرمایه گذاری موجود را کاهش می دهد. صرف نظر از میزان سرمایه گذاری شما، افزایش تعداد سکه ها (توکن ها) نشان دهنده سود روشی است که می تواند در بلندمدت سود قابل توجهی ایجاد کند. روش معاملاتی اصلی خرید و فروش تمام سود برای ایجاد سود نقدی ممکن است گزینه بهتری باشد. با این حال، از آنجایی که هیچ تضمینی برای سود در هنگام شروع یک تراکنش جدید وجود ندارد، احتمالاً بار معاملات جدید افزایش می یابد. با این حال، افزایش تعداد سکه ها (توکن ها) نشان دهنده سود این بار را کاهش می دهد. این به این دلیل است که معاملات از طریق دارایی های موجود (سکه ها، توکن ها) به جای شروع یک معامله جدید انجام می شود. - ممکن است مواردی وجود داشته باشد که شما یک سکه (توکن) موجود را بفروشید، زیرا انتظار دارید قیمت آن کاهش یابد، و سپس سعی کنید آن را با قیمت معقولی دوباره بخرید، اما متوجه می شوید که قیمت کاهش نمی یابد. برای کاهش این خطرات، باید حرکات نشانگرهای کمکی در نمودار 1 بعدی مانند StochRSI، TC و OBV را کنترل کنید. به عبارت دیگر، بهتر است زمانی که قیمت در یک روند نزولی قرار دارد، بفروشید و سپس خرید کنید تا زمانی که روند صعودی دارد. - ممنون که خواندید. برای شما آرزوی تجارت موفق دارم. ------------------------------------------------
readCrypto
Happy New Year!

Hello, traders! If you "Follow" us, you'll always get the latest information quickly. Have a great day. ------------------------------------- (BTCUSDT 12M Chart) The pattern of a 3-year uptrend and a 1-year downtrend appears to have undergone a slight change, with the 2025 bearish candlestick closing. The key areas to consider are the 69K-73K range and the 42K-44K range. Prices below the 42K-44K range are expected to be unseen again. Therefore, as the price approaches these levels, it's a good time to buy from a long-term perspective. If the price declines near the Fibonacci level of 1.618 (89050.0), it could touch the 69K-73K range. However, just as it failed to reach the expected target level of 2.618 (133889.92), the decline could also fall short of the 69K-73K range. Therefore, if the price declines from 1.618 (89050.0), we need to check for support near 1.414 (79902.66). Considering the previous pattern of three-year upswings and one-year downswings, 2026 is expected to be a challenging year, so caution is advised when trading. The Fibonacci ratios currently displayed on the chart are based on the second wave. Therefore, the Fibonacci level 3.618 (178729.84), which appears to be the end of the second wave, is expected to be the target area for the next bullish trend. - (1M chart) Since the HA-High indicator on the 1M chart formed at 110105.69, a decline is likely until it meets the DOM (-60) or HA-Low indicators. Currently, the price is positioned near the StochRSI 50 indicator and the M-Signal indicator on the 1M chart, and the StochRSI 20 indicator is showing signs of forming a new line. Therefore, support near the Fibonacci level 1.618 (89050.0) is crucial. If the price declines, the DOM (-60) indicator and the HA-Low indicator are expected to form a low soon. Therefore, we need to check for support near the previously mentioned levels: 1st: Fibonacci 1.414 (79902.66), 2nd: 69K ~ 73499.86. For the price to rise at a key point or range and continue the uptrend, the StochRSI, TC, and OBV indicators must show upward trends. Currently, the StochRSI indicator is showing signs of entering an oversold zone, the TC indicator is showing a downward trend below 0, and the OBV indicator is showing a downward trend between the Low Line and High Line. - (1W Chart) Since this is currently a volatile week, we need to monitor the movements below this week. The next volatile week is expected to occur around the week of January 26th. Therefore, the key is whether the price can rise along the uptrend line and remain above the M-Signal indicator on the 1M chart. If it fails to do so and falls, a downward trend is expected, as mentioned earlier. My basic trading strategy is to buy in the DOM(-60) ~ HA-Low range and sell in the HA-High ~ DOM(60) range. Therefore, a decline in the HA-High ~ DOM(60) range can be considered a normal decline, and it is difficult to determine a buy point at this time. Therefore, I recommend waiting until the DOM(-60) or HA-Low indicators are met. - (1D Chart) The HA-Low indicator on the 1D chart is forming at 87944.84, so the key question is whether it can find support near this level and rise. However, since the M-Signal indicator on the 1M chart is passing, it's crucial to see if the price can rise above it and maintain its upward momentum. Including these factors, a rise in the 84739.74 ~ 93.5K range is highly likely to trigger an uptrend. The next period of volatility is expected to be around January 10th, so we should monitor whether the price rises along the rising trendline (1) after this period. We should also monitor whether the price can break above the rising trendline (2). The TC indicator is above zero, and the OBV indicator is rising above the High Line to see if it can be sustained. The StochRSI indicator is falling in the overbought zone. Therefore, I believe that for the uptrend to continue, the StochRSI, TC, and OBV indicators must show upward trends. If the price finds support in the 84739.74 to 87944.84 range (DOM(-60) to HA-Low range on the 1D chart) and rises, and the StochRSI, TC, and OBV indicators show upward trends, the uptrend is expected to continue. As mentioned in the 12M chart explanation, this year is expected to be a difficult year. Therefore, when trading spot, it's important to increase the number of coins (tokens) corresponding to profits. When trading futures, it's important to minimize losses by trading short positions. This will prevent you from missing opportunities due to insufficient funds when the trend turns upward. It's best to increase the number of coins (tokens) representing profit during a stepwise downtrend. This is because a stepwise downtrend usually ends in an uptrend. A stepwise downtrend occurs when the price falls between DOM (-60) and HA-Low. However, because it's difficult to predict the end of a downtrend, you must carefully distribute your purchase amounts. Furthermore, when profit is generated by each purchase price, you should sell the amount equal to the purchase price, leaving the coins (tokens) representing profit. This will quickly convert to profit when the price rises. - Thank you for reading to the end. We wish you successful trading. --------------------------------------------------#BTCUSDT The key is whether the price can rise above the M-Signal indicator on the 1M chart and maintain its upward momentum. To sustain the uptrend by breaking above a key point or range, the StochRSI, TC, and OBV indicators must show upward trends. We need to see if the price can rise along the uptrend line and rise above the M-Signal indicator on the 1W chart. The key is whether the price can find support near 89294.25 and rise above the left Fibonacci level of 3 (92026.52) to 3.14 (93570.28). Currently, the StochRSI indicator is in an overbought zone, so upside is likely to be limited. Since the TC indicator has reached its all-time high, there's a high possibility of a decline soon. Therefore, I believe the support level around 89294.25 will be crucial. If buying pressure continues to flow in and the OBV indicator remains above the High Line, the upward trend will likely be broken.
readCrypto
How to interpret charts and trade...

Hello, fellow traders! If you "Follow" me, you'll always get the latest information quickly. Have a great day. ------------------------------------- The Trend Check (TC) indicator is a comprehensive evaluation of the PVT, OBV, and StochRSI indicators. Therefore, a breakout above the zero level indicates strong buying pressure and a high probability of a price increase. The StochRSI indicator is a coincident indicator that can be used as a trading signal by quickly detecting overbought and oversold levels in a stock price. The OBV indicator is a volume indicator that measures buying and selling pressure by adding the trading volume on days when the price is rising and subtracting the trading volume on days when the price is falling. It was developed based on the assumption that trading volume precedes the price. The PVT indicator is a technical analysis tool that analyzes buying and selling pressure and trends in the market by reflecting both stock price movements and trading volume. It combines accumulated trading volume with price volatility to sensitively reflect market supply and demand and trends. By comprehensively evaluating these indicators, it can be used to determine trading timing. However, since the trend may fluctuate depending on whether the StochRSI indicator is in the overbought or oversold zone, the StochRSI indicator has been displayed accordingly. If the StochRSI indicator enters the overbought zone, upside is likely to be constrained, and if it enters the oversold zone, downside is likely to be constrained. Therefore, it is recommended to check the StochRSI indicator's fluctuations along with the TC indicator. If the On-Bottom Volume (OBV) indicator is between the Low Line and High Line, the price is likely to move sideways. Furthermore, if it rises above the High Line, it is likely to be bullish, and if it falls below the Low Line, it is likely to be bearish. To confirm this, the On-Bottom Volume (OBV) indicator has been added separately. In summary, if the TC indicator shows an upward trend or remains above 0, the price is likely to rise. However, the movements of the StochRSI and OBV indicators are checked to determine whether the upward trend can be maintained or whether a downtrend will occur. Therefore, for the price to continue its upward trend, 1. the TC indicator must show an upward trend above 0, 2. the StochRSI indicator must show an upward trend without entering an overbought zone, and 3. the OBV indicator must remain above its High Line or show an upward trend. For the price to continue its downward trend, this is the opposite of the above conditions for a sustained upward trend. If the StochRSI or OBV indicators show a different trend than the TC indicator, the price is likely to move sideways, so be mindful of this when trading. - Since most indicators are based on 1D charts, it's important to first check the movements of the 1D chart. Next, it's best to trade by reflecting the movements of the 1D chart with the movements of the timeframe chart you're trading. In other words, if the 1D chart shows an upward trend, you should trade based on the expectation that the price will rise on the timeframe chart you're trading. Therefore, when prices are falling, it's best to trade with a smaller investment amount and a shorter investment period to react quickly (with a short stop-loss point). When prices are rising, it's best to trade with a larger investment amount and a longer investment period (with a more generous stop-loss point). - Auxiliary indicators should be considered as supplementary indicators, as their name suggests, in interpreting charts. The key is to identify support and resistance points or ranges for the price and the movements of the M-Signal indicator on the 1M, 1W, and 1D charts. To determine the overall chart movement, check the movements of the M-Signal indicator on the 1M, 1W, and 1D charts. For the price to continue its upward trend, it must remain above the M-Signal indicator on the 1M chart. If it fails to do so, a downward trend is highly likely, so you should consider a strategy to counter a bearish market. If the price is below the M-Signal indicator on the 1M chart, it is recommended to shorten the investment period. Consequently, it is also recommended to set a shorter stop-loss point. For this purpose, the HA-MS indicator includes indicators designed to indicate support and resistance points. The most representative indicators are the HA-Low and HA-High indicators. The HA-Low and HA-High indicators are designed for trading using the Heikin-Ashi chart. The HA-Low indicator indicates the low range, so if it encounters support, it's a buy signal. The HA-High indicator indicates the high range, so if it encounters resistance, it's a sell signal. To make this more clear, the DOM(60) and DOM(-60) indicators have been added. The DOM(-60) indicator, like the HA-Low indicator, indicates the low range. The DOM(60) indicator, like the HA-High indicator, indicates the high range. Therefore, if support is found within the established DOM(-60) ~ HA-Low or HA-Low ~ DOM(-60) range, it's a buy signal. If resistance is found within the established HA-High ~ DOM(60) or DOM(60) ~ HA-High range, it's a sell signal. - When assessing support at these points or intervals, adding the interpretation of the auxiliary indicators mentioned above will be a significant aid in determining support. In other words, if price movements indicate support, but the auxiliary indicators do not support it, the price is likely to decline. - If you trade based on indicator movements, you may suddenly find yourself trading against them. This happens because you prejudge the indicators' movements based on your own thinking and then trade accordingly. To prevent this problem, it's important to ensure that all auxiliary indicators are moving in the same direction. Also, while you can buy to some extent in spot trading, you should never initiate a trade based on price movements when trading short positions in futures. This is because price volatility is higher when prices are falling. Therefore, when starting a short position, it's best to initiate the trade at support and resistance levels. - We begin trading based on indicator movements or chart analysis, but we lose something. That's our trading strategy. When actually trading, we must first determine: 1. How long will the trading period be? 2. How much capital will we invest? 3. How will we conduct the trade? If we simply analyze the indicator movements and charts without deciding on these factors, we are likely to trade in a state of constant anxiety. This is because maintaining a stable mental state is more important than profit when trading. A stable mental state during a trade increases the likelihood of a successful trade. This is because it allows us to respond more effectively. Therefore, establishing a basic trading strategy that suits your investment style is paramount. By considering the investment period for the stock or coin you're considering, you can determine your investment amount accordingly and choose a detailed trading method. Therefore, 1. Investment Period 2. Investment Size 3. Trading Method When conducting a trade, consider the three factors above. When investing for a medium- to long-term or longer, it's important to carefully manage your purchases to lower your purchase price. If your average purchase price is high, it can be psychologically burdensome to trade with a medium- to long-term investment horizon. Therefore, in this case, you should trade for shorter periods of time, generating cash profits while lowering your average purchase price. Lowering your average purchase price isn't easy in the stock market. This is because trading is done on a weekly basis. However, the coin market allows for decimal trading, so you can lower your average purchase price by increasing the number of coins corresponding to your profit. For coins corresponding to profit, you trade by purchase price. When profits are generated for each purchase price, you sell the amount equivalent to the purchase price (including transaction fees) for each purchase price, thereby retaining the remaining coins. Since the purchase price of these remaining coins is 0, as the number of these coins increases, the average purchase price will decrease. - Investment size is crucial, as it determines how you allocate your total investment capital to conduct your trading. If your investment is misallocated, even with high returns, actual profits may be small, and even with low loss rates, actual losses may be large. Furthermore, the most important aspect of investment size is always maintaining a reserve fund. The amount of reserve fund you should keep will vary depending on your individual investment style. I recommend approximately 20% of your total investment capital. This reserve fund is used for emergencies. If you start trading with this reserve fund, you must sell it quickly to secure the reserve fund. Failure to do so can lead to extreme anxiety and the inadvertent execution of unintended trades. Depending on your investment size, you should consider how many stocks (coins) you will trade at a time. Investing in too many stocks (coins) can lead to a small purchase amount or simultaneous trading, which can hinder your ability to execute your trades effectively. Therefore, you should always consider the number of stocks (coins) you can manage simultaneously. Typically, the number of stocks (coins) you can manage simultaneously is 1-3. Long-term investments, even if managed concurrently, often require time to respond, so they don't need to be included in the number of concurrent investments. However, it's recommended to include mid-term and shorter investments in your concurrent management count. - Once you've chosen a stock (coin) based on your investment horizon and investment size, you can then proceed to detailed trading based on chart analysis and indicator movements. Therefore, it's best to keep chart analysis as short as possible. This is because prolonged chart analysis increases the likelihood of your subjective opinions incorporating them into your analysis, which can result in inaccurate chart analysis. Furthermore, prior to chart analysis, if you first review non-chart-related issues (such as company news, politics, or the economy) and then analyze the chart based on those, you may end up basing your analysis on your own subjective opinions. Therefore, it's important to be mindful of this. It's important to remember that over-information can actually be detrimental to your trading. - When developing a detailed trading strategy, I outlined the basic trading strategy of buying in the DOM(-60) ~ HA-Low range and selling in the HA-High ~ DOM(60) range. By adhering to this principle, even if you don't achieve significant returns, I believe you'll be able to ensure consistent profits. Looking at the basic trading strategy broadly, it follows a trading pattern within a box range. However, the length of that box range is unknown. To achieve significant profits, it is necessary to break beyond the box range. Therefore, if the price rises within the HA-High ~ DOM(60) range, a stepwise upward trend is likely, transitioning into a trend trade. Conversely, if the price falls within the DOM(-60) ~ HA-Low range, a stepwise downward trend is likely, transitioning into a trend trade. However, it's important to note that a stepwise upward trend ends in a decline, while a stepwise downward trend ends in a rise. In other words, while a stepwise upward trend is likely to lead to a significant upward trend, it also means a significant downward trend. Therefore, when entering a trade during a stepwise upward trend, it's important to respond quickly to minimize losses. Failure to do so could result in a significant decline, resulting in losses that are difficult to recover from. Conversely, a continuous step-down trend is more likely to lead to a significant decline, but it also carries the potential for a significant rise. Therefore, we must consider how to implement tranche purchases during a step-down trend to lower the average purchase price or secure more stocks (coins). Therefore, we should execute more trades during a step-down trend. However, in the stock market, tranche purchases during an actual downtrend can lead to a loss of purchases, so caution is advised. In the coin market, transactions are processed in decimals, reducing the burden of trading. This means that trades can be organized by purchase price and executed at each purchase price. Therefore, in a step-down trend, it's important to execute trades at each purchase price to retain a profit-making number of coins (tokens). This can lower the average purchase price or increase the number of coins (tokens). There are two ways to retain a profit-making number of coins (tokens): buying and then selling, or selling and then selling. Any method is fine, but if possible, it's best to trade using a buy-then-sell method. This is because a cascading downtrend ends in an uptrend. Therefore, in a cascading downtrend, you should trade less aggressively and execute more trades. Downtrends are more likely to exhibit volatility than uptrends, so buying and then selling may actually feel easier. However, you should avoid being greedy. The root cause of all losses stems from greed. - If you can consistently generate profits, regardless of the trading method, then that's the best trading method. We invest a lot of time and money in finding this, and remain in the investment market. Charts ultimately represent the movement of money. Therefore, charts should always be the top priority. The main problem with the stock market is that issues outside of the charts dominate the market. This problem prevents investors from seeing the movement of money, and they are constantly being misled by things outside of the charts. As the coin market is being incorporated into the stock market, I believe that many people are dragging the main problems of the stock market into the coin market, leading to a rise in new losses. The biggest difference between the stock and coin markets is that coins are relatively unusable in real life. Therefore, I don't think analyzing them like the stock market is appropriate. In the stock market, too, capital movements are often reflected in charts, so it's best not to check news outside of the charts first. Such news can be toxic to individual investors who lack the ability to gather and analyze information. - Thank you for reading. I wish you successful trading. --------------------------------------------------
readCrypto
Next Volatility Period: Around January 10, 2026

با سلام خدمت شما تاجران برای دریافت سریع آخرین به روز رسانی ها، ما را دنبال کنید. روز خوبی داشته باشید! ------------------------------------ #BTCUSDT این دوره نوسانات در 29 دسامبر به پایان می رسد. سوال کلیدی این است که آیا قیمت می تواند حمایت نزدیک به 87944.84 را حفظ کند و بالاتر از اندیکاتور M-Signal در نمودار 1M افزایش یابد؟ بنابراین، ما باید بررسی کنیم که آیا قیمت می تواند بالاتر از این باشد و حمایت نزدیک به 90588.23 را پیدا کند. اگر قیمت از خط روند افزایشی (1) پایین نیاید، یک روند صعودی انتظار می رود. برای تعیین این موضوع، باید بررسی کنیم که قیمت پس از دوره بعدی نوسانات، در حدود 10 ژانویه، چگونه حرکت می کند. - بر اساس موقعیت فعلی قیمت، خط روند افزایشی (1) یک خط روند کلیدی است. اگر قیمت در امتداد خط روند افزایشی (1) حرکت کند، در حدود 20 ژانویه از سطح 87944.84 بالاتر رفت. بنابراین، تمرکز ما بر این است که آیا قیمت می تواند پشتیبانی نزدیک به 90588.23 را پیدا کند یا خیر. اگر نشانگر M-Signal در نمودار 1W در بالا شکسته شود، ما معتقدیم که افزایش شدید بسیار محتمل است. - اگر قیمت به زیر خط روند صعودی (1) سقوط کرد، باید پشتیبانی حدود 79-81 هزار هزار تومان را بررسی کند. اگر نتواند حمایت پیدا کند، ممکن است به سطح حیاتی 69000-73499.86 سقوط کند. اگر به زیر 69000-73499.86 برسد، احتمالاً زمان زیادی طول کشید تا افزایش یابد. این می تواند به تدریج به سطح 42K-43K نزدیک شود، سطحی که احتمالاً دیگر هرگز به آن رسید. با این حال، احتمال چرخش صعودی در حدود 56204.13 وجود دارد. - محدوده 56K-65K مربوط به اوج موج اول است که روند صعودی شدیدی را آغاز کرد. بنابراین، حتی اگر این بار کاهش یابد، احتمالاً در محدوده 56K-65K افزایش می یابد. برای توضیح تصویر بزرگ، لطفاً به بخش زیر مراجعه کنید. با این حال، به دلیل نوسانات قیمت، من معتقدم که بازار نزولی major احتمالاً در سه ماهه اول سال 2026 آغاز می شود. جالب است که ببینیم آیا کندل های امسال می توانند به عنوان شمع های صعودی بسته شوند تا یک بازار گاوی سه ساله و یک الگوی بازار نزولی یک ساله ایجاد کنند. - ممنون که تا آخر خواندید. برای شما آرزوی تجارت موفق دارم. ------------------------------------------------ - این توصیفی از تصویر بزرگ است. (بازار گاوی 3 ساله، الگوی بازار نزولی 1 ساله) زمانی که بازار نزولی شروع می شود، جزئیات بیشتری را توضیح داد. ----------------------------------------------------
readCrypto
Next Volatility Period: Around December 28th
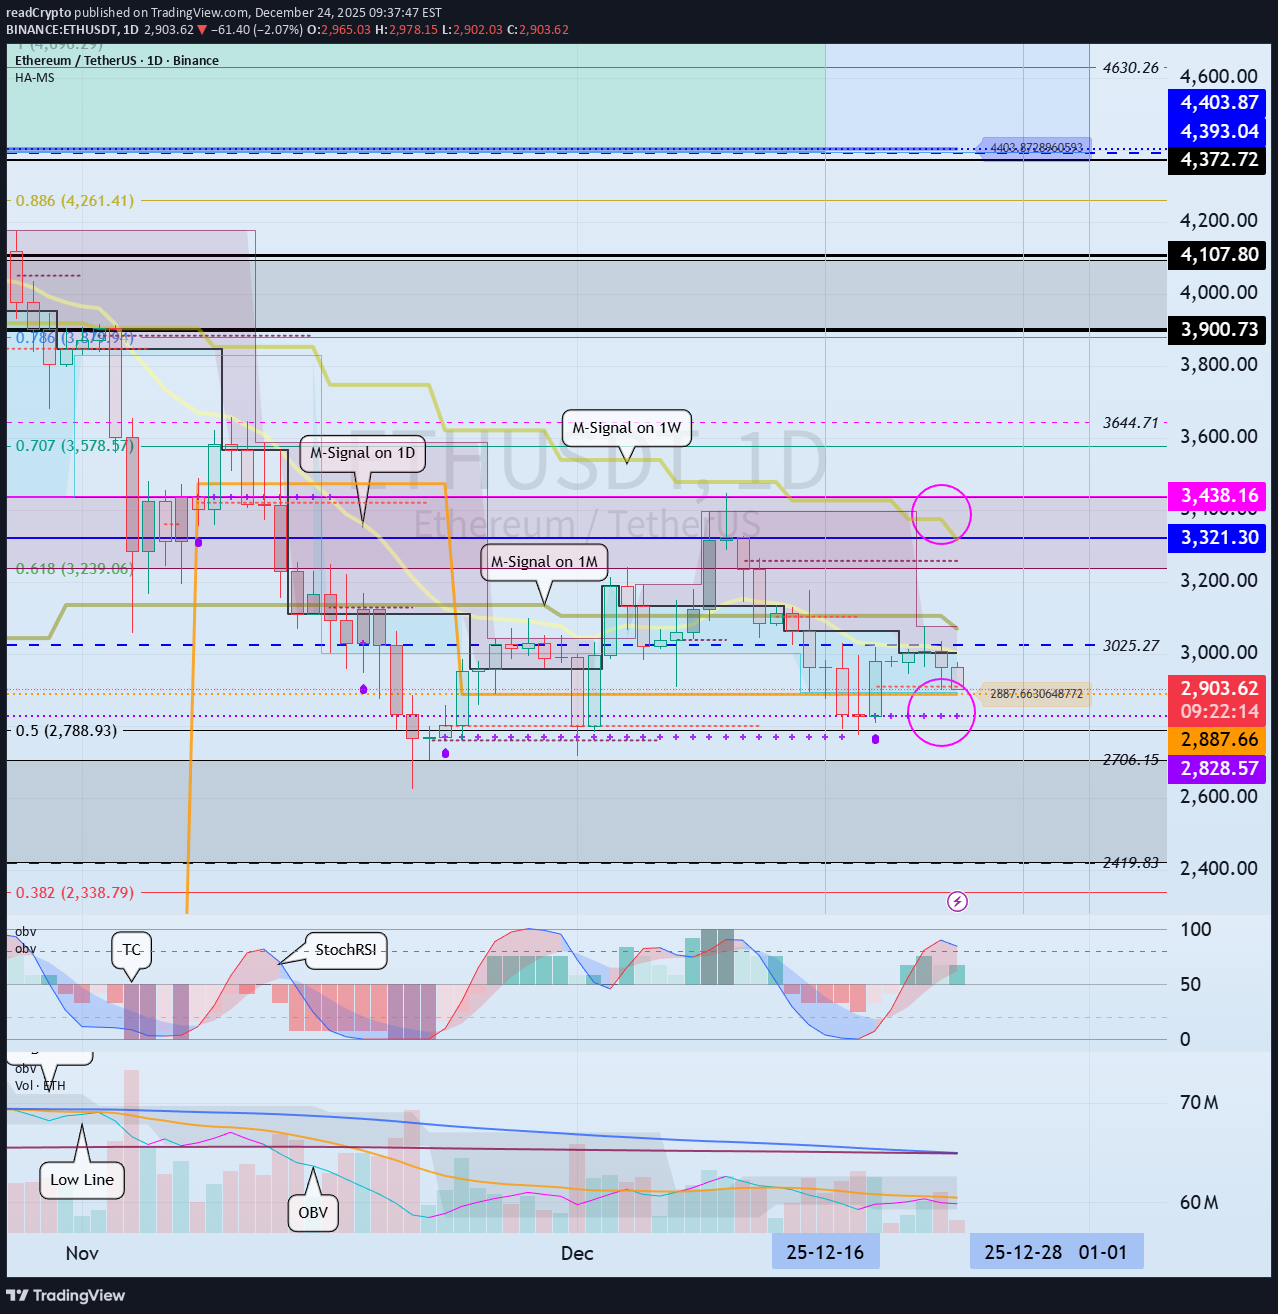
سلام، تاجران! ما را دنبال کنید تا سریع ترین اطلاعات را دریافت کنید. روز خوبی داشته باشید. ------------------------------------ #ETHUSDT با تشکیل یک خط روند جدید، انتظار میرود دوره نوسانات بعدی در حدود 28 دسامبر تا 1 ژانویه رخ دهد. در این زمان، نکته کلیدی این بود که آیا قیمت میتواند در نزدیکی کفهای 2828.57-2887.66 پشتیبانی پیدا کند و از اندیکاتور M-Signal در نمودار 1M بالاتر رود. با این حال، مهم ترین ناحیه حمایت و مقاومت محدوده 2419.83-2706.15 است، بنابراین حفظ قیمت بالاتر از این سطح بسیار مهم است. برای تبدیل شدن به یک روند صعودی و ایجاد یک روند صعودی، باید از سطح 3321.30-3438.16 بالاتر رود. بنابراین، شما باید استراتژی معاملاتی میانمدت تا بلندمدت خود را بر اساس حرکات دوره نوسانات آتی توسعه دهید یا تنظیم کنید. اگر پایین تر از سطح 2419.83-2706.15 باشد، احتمالاً یک بازار نزولی آغاز می شود، بنابراین باید یک طرح پاسخ را در نظر بگیرید. اگر حمایت پیدا کرد و صعود کرد، این را آخرین روند صعودی در نظر بگیرید و روی یافتن زمانی برای کسب سود تمرکز کنید. این به این دلیل است که همانطور که در توضیح تصویر بزرگ BTC ذکر شد، انتظار می رود سال 2026 یک بازار خرس major باشد. - ممنون که تا آخر خواندید. برای شما آرزوی تجارت موفق دارم. ------------------------------------------------
readCrypto
Next Volatility Period: Around December 28th
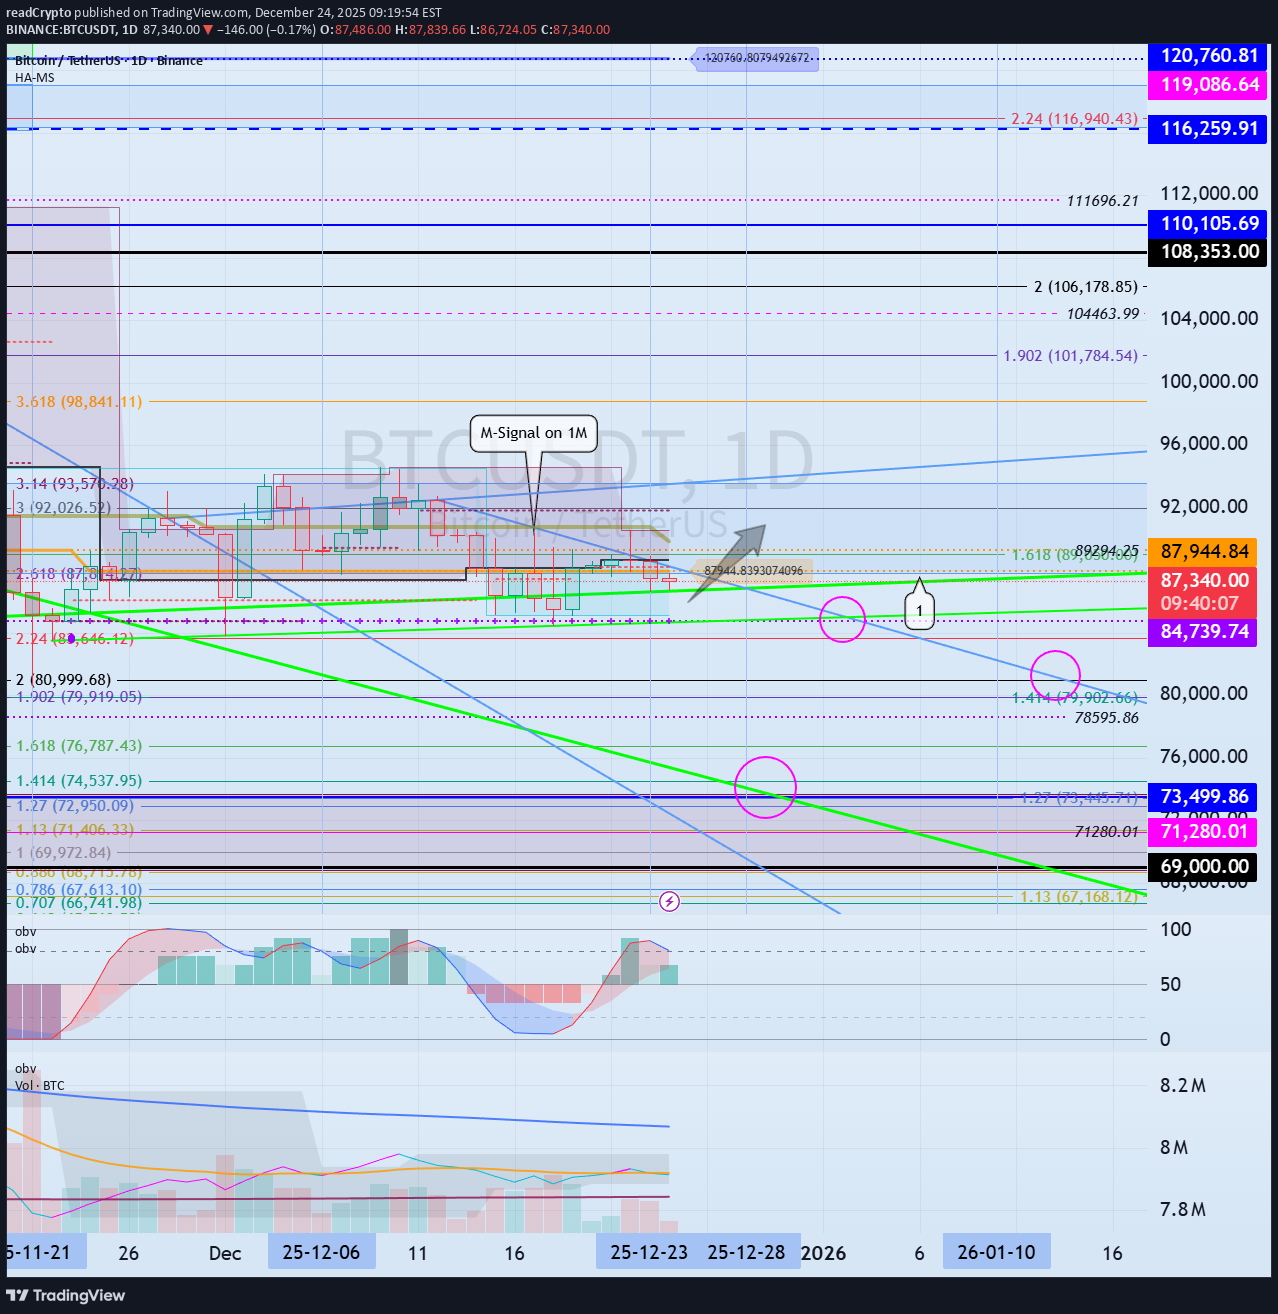
سلام، تاجران! ما را دنبال کنید تا سریع ترین اطلاعات را دریافت کنید. روز خوبی داشته باشید. ------------------------------------ #BTCUSDT این دوره نوسان در 24 دسامبر به پایان می رسد و دوره بعدی حدود 10 ژانویه 2026 بود. با این حال، مهم است که movement را پس از عبور خط روند تازه تشکیل شده در حدود 28 دسامبر مشاهده کنید. خط روند افزایشی (1) در نمودار 1W رسم شده است. نکته کلیدی این است که آیا می تواند در امتداد این خط روند افزایش یابد و از خط روند نزولی کوتاه مدت خارج شود. نقطه پایین 84739.74-87944.84 است، بنابراین اگر قیمت در نزدیکی این سطح حمایت پیدا کند و بالاتر از اندیکاتور M-Signal در نمودار 1M افزایش یابد، احتمالاً روند صعودی رخ داد. برای عبور از این نقطه یا سطح کلیدی و ادامه روند صعودی، اندیکاتورهای StochRSI، TC و OBV باید روند صعودی را نشان دهند. در صورت امکان، 1. اندیکاتور StochRSI نباید وارد منطقه اشباع خرید شده باشد. 2. نشانگر TC باید بالای صفر باقی بماند. 3. نشانگر OBV باید بالای High Line باقی بماند. بنابراین، ما باید تعیین کنیم که آیا شرایط فوق را می توان در حین یافتن پشتیبانی در نزدیکی نقطه پایین (84739.74-87944.84) برآورده کرد. مهمترین سطح حمایت و مقاومت 69000-73499.86 است. بنابراین، با نزدیک شدن قیمت به این سطح، نوسان ممکن است رخ دهد. اگر پشتیبانی در این سطح یافت شود، من معتقدم که قطعا زمان خوبی برای خرید است. من معتقدم سطح قیمتی که دیگر شاهد آن بود زیر 42 هزار است. - ممنون که تا آخر خواندید. برای شما آرزوی تجارت موفق دارم. ------------------------------------------------ - این توضیحی از تصویر بزرگ است. (بازار گاوی 3 ساله، الگوی بازار نزولی 1 ساله) زمانی که بازار نزولی شروع می شود، جزئیات بیشتری را توضیح داد. ------------------------------------------------------#BTCUSDT انتظار می رود این دوره از نوسانات تا 29 دسامبر ادامه داشته باشد. کلید این دوره از نوسانات این است که آیا قیمت می تواند در امتداد خط روند افزایشی افزایش یابد (1). اگر قیمت به زیر خط روند افزایشی (1) سقوط کند و ثابت بماند، احتمال کاهش بیشتر وجود دارد، بنابراین باید اقدامات متقابل را در نظر بگیریم. این کاهش احتمالاً با افت به زیر 84739.74 آغاز می شود.
readCrypto
Selection and Focus
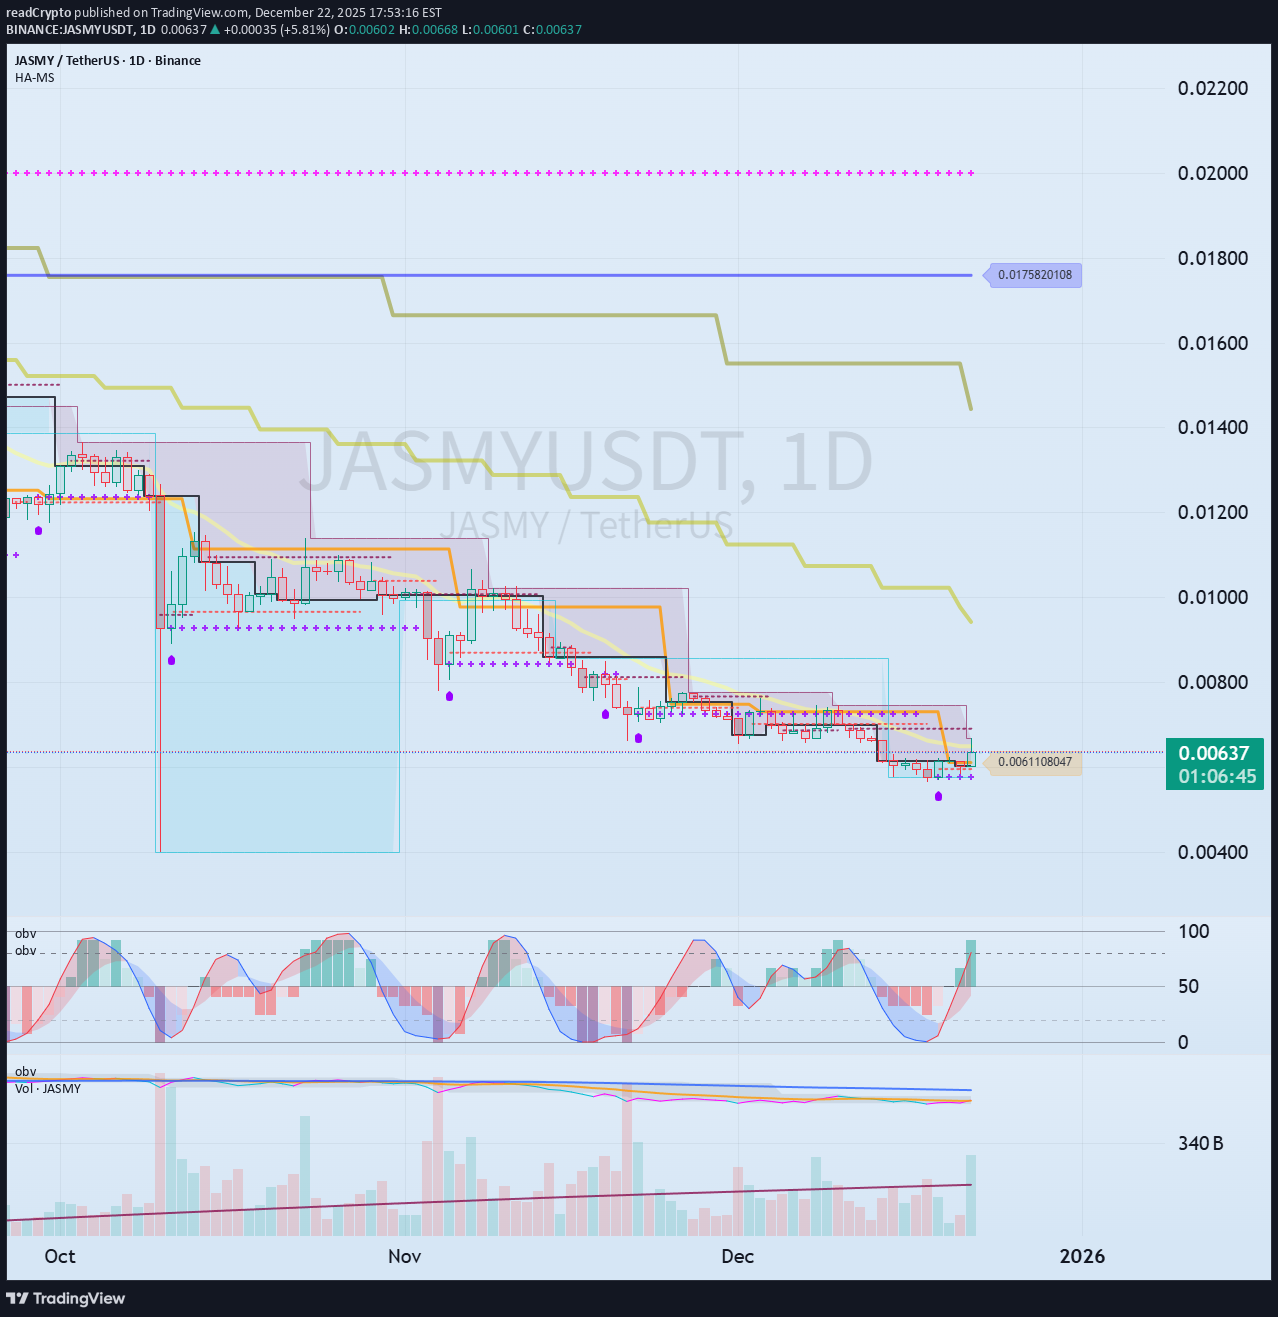
Hello, traders. By "Following," you'll always receive the latest information quickly. Have a great day. ------------------------------------- We are always at a crossroads. We choose which instruments and coins (tokens) to trade and take responsibility for that choice. You can see in the chart above that the price has fallen back to near the HA-Low indicator on the 1W chart. And, the 1D chart shows a stepwise downward trend. In other words, the price fell below the HA-High indicator, exhibiting a normal decline, and then encountered the HA-Low indicator, forming a stepwise downtrend. A normal downtrend is formed from a high and then declines, while a stepwise downtrend is formed from a low and then renewed. While both types of downtrends ultimately represent the same decline, the difference is that in a stepwise downtrend, you can choose the criteria for entering a trade. Therefore, we can look for charts where a stepwise downtrend transitions to an uptrend and trade based on whether support and resistance are present. Looking at this example chart, the price fell below the HA-High indicator on August 14th and then exhibited a normal downtrend. Then, on October 10th, it fell below the HA-Low indicator, forming a stepwise downtrend. Looking at the larger 1W chart, we can see that the price has been in a normal downtrend since February 3rd, falling below the HA-High indicator. Then, after October 6th, it touched the HA-Low indicator, indicating that it had reached a low. It appears to be currently testing support near the HA-Low indicator level of 0.00544. Therefore, whether support is found near the HA-Low indicator level of 0.00544-0.00611 on the 1W and 1D charts indicates a different meaning from the stepwise decline seen so far. However, the point at which the downtrend turns into an uptrend and the uptrend is likely to begin is when the price rises above 0.01090 and holds, giving us time to decide on a trade. Therefore, we can buy when the price rises after finding support in the 0.00544-0.01090 range. The buy zone, or support zone, is too wide, making it difficult to trade. In this case, we buy when the price rises after finding support in the key zone, such as the 0.00544-0.00611 range or near 0.01090. Most traders are afraid to buy at the lowest price, so they will buy when the price rises to around 0.01090. This phenomenon is called a breakout trade. In other words, the psychological pressure to buy arises when the price breaks above 0.01090. Therefore, you should buy when the price rises after finding support in the DOM(-60) ~ HA-Low range, and sell some of the gains, gradually buying during a stepwise downtrend. By leaving behind coins (tokens) that represent profits, you can reduce the burden of buying at the bottom. However, if you're not familiar with day trading, you may continue to use your investment funds to buy. However, don't be afraid of this. This is because the start of a stepwise downtrend means that the likelihood of a bullish turn has increased. What you should be afraid of is the HA-High ~ DOM(60) range, i.e., when you buy during the high and then the downtrend begins. This is because you don't know how far the decline will go. Only when you encounter the DOM(-60) or HA-Low indicators will you know the end of the decline is near. Therefore, you need to understand the current position of your chosen asset or coin (token) and consider how to set your trading timing and how to proceed with the trade. ------------------------------------------------------------------ From this perspective, looking at the BTC chart reveals the significance of its current position. In other words, if the price declines from the current position, it marks the beginning of a stepwise downtrend. If it rises, it indicates the possibility of an upward trend until it encounters the HA-High or DOM(60) indicator. The M-Signal indicator on the 1M chart passes through this crucial crossroads, making it even more crucial. The same holds true for the ETH chart. Therefore, rather than focusing on whether the price will rise or fall, you should check for support near the established low point, i.e., the DOM(-60) to HA-Low range, and respond accordingly by making split purchases. In other words, trading that leaves behind the coins (tokens) that represent profits from day trading is a useful strategy. If you're not familiar with day trading, you should purchase at the lowest possible price between DOM(-60) and HA-Low. Since these purchases should be made every time a cascading downtrend occurs, it's best to purchase in small amounts. If you find a profitable purchase price within the DOM(-60) to HA-Low range on a certain day, you can sell the amount of each purchase price, leaving the coins (tokens) that represent profits. It sounds simple, but actually executing a trade is not easy. Therefore, this trading method (leaving coins corresponding to profits) should be practiced during a cascading downtrend to become familiar with it. Therefore, until you become accustomed to it, trade with small amounts of capital. - Thank you for reading to the end. I wish you successful trading. --------------------------------------------------If possible, it's best to select a stock or coin (token) whose price remains above the M-Signal indicator on the 1M chart. The chart displays the M-Signal indicators for the 1M, 1W, and 1D charts. However, depending on the chart's creation period, some M-Signal indicators may not be displayed. In this case, select the highest M-Signal indicator. In the chart above, the M-Signal indicator on the 1W chart is currently the highest.
readCrypto
The key is whether the price can break above the 0.04032-0.04342
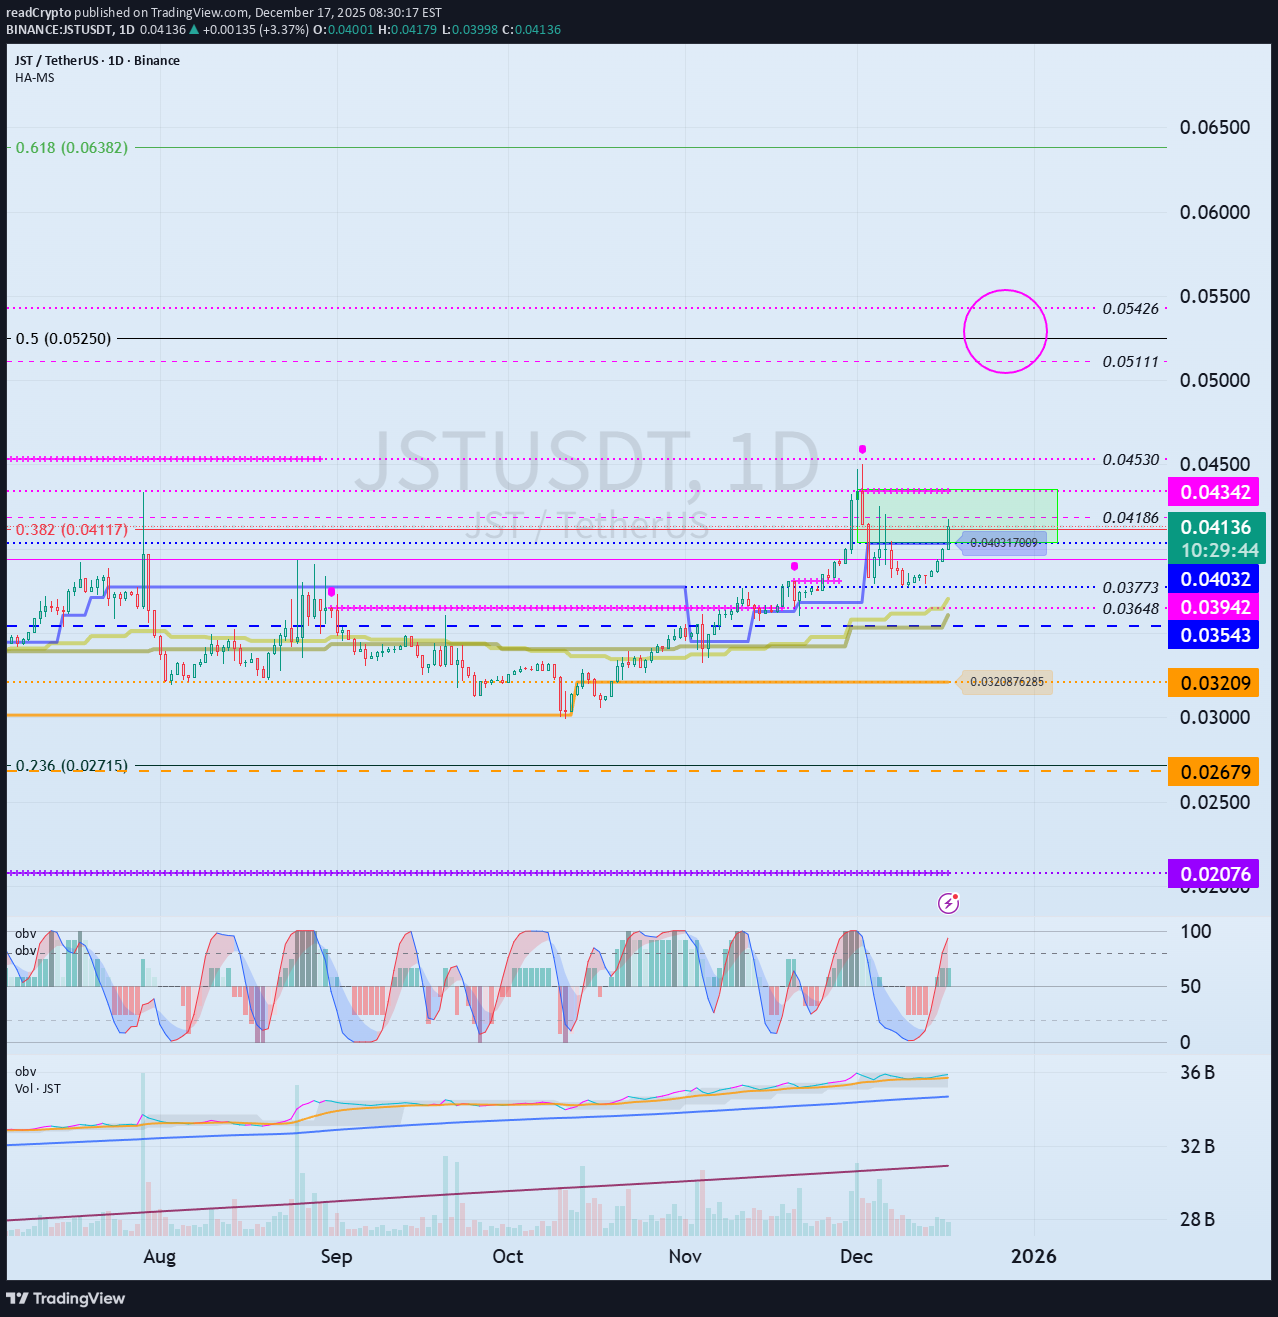
سلام، تاجران! ما را دنبال کنید تا سریع ترین اطلاعات را دریافت کنید. روز خوبی داشته باشید. ------------------------------------ (نمودار JSTUSDT 1M) اگر قیمت بالای 0.03942 باقی بماند، انتظار می رود روند صعودی در مقیاس کامل آغاز شود. - (نمودار 1W) اگر قیمت با حمایت نزدیک به 0.03942 افزایش یابد، شکست صعودی نزدیک به 0.05111 احتمالاً یک روند صعودی را آغاز می کند. اگر قیمت نتواند افزایش یابد و کاهش یابد، اول: 0.03543 دوم: 0.02679 ما باید پشتیبانی را در نزدیکی سطوح 1 و 2 بالا بررسی کنیم. - (نمودار 1 بعدی) محدوده HA-High ~ DOM(60) بین 0.04032 و 0.04342 تشکیل شده است. بنابراین، شکست بالای 0.04032 و 0.04342 برای وقوع یک روند صعودی گام به گام ضروری است. انتظار می رود اولین سطح مقاومت روند صعودی حدود 0.05111-0.05426 باشد. از آنجایی که اندیکاتور M-Signal در نمودار 1M از حدود 0.03543 عبور می کند، اگر به زیر 0.03543 سقوط کرد، توصیه می شود معاملات را متوقف کنید و وضعیت را ارزیابی کنید. برای شکستن بالاتر از یک نقطه یا محدوده کلیدی و ادامه روند صعودی، اندیکاتورهای StochRSI، TC و OBV باید روند صعودی را نشان دهند. در صورت امکان، - نشانگر StochRSI نباید وارد منطقه خرید بیش از حد شود. - نشانگر TC باید بالای صفر باقی بماند. - نشانگر OBV باید بالای High Line باقی بماند. در حال حاضر، اندیکاتور StochRSI وارد منطقه اشباع خرید شده است که می تواند روند صعودی را محدود کند. برای غلبه بر این امر و ادامه روند صعودی، حجم معاملات باید به شدت افزایش یابد. اگر نه، باید به دنبال movement جانبی بگردید و ببینید که آیا پشتیبانی را آزمایش می کند. - ممنون که خواندید. برای شما آرزوی تجارت موفق دارم. ------------------------------------------------
readCrypto
Next Volatility Period: Around January 1, 2026
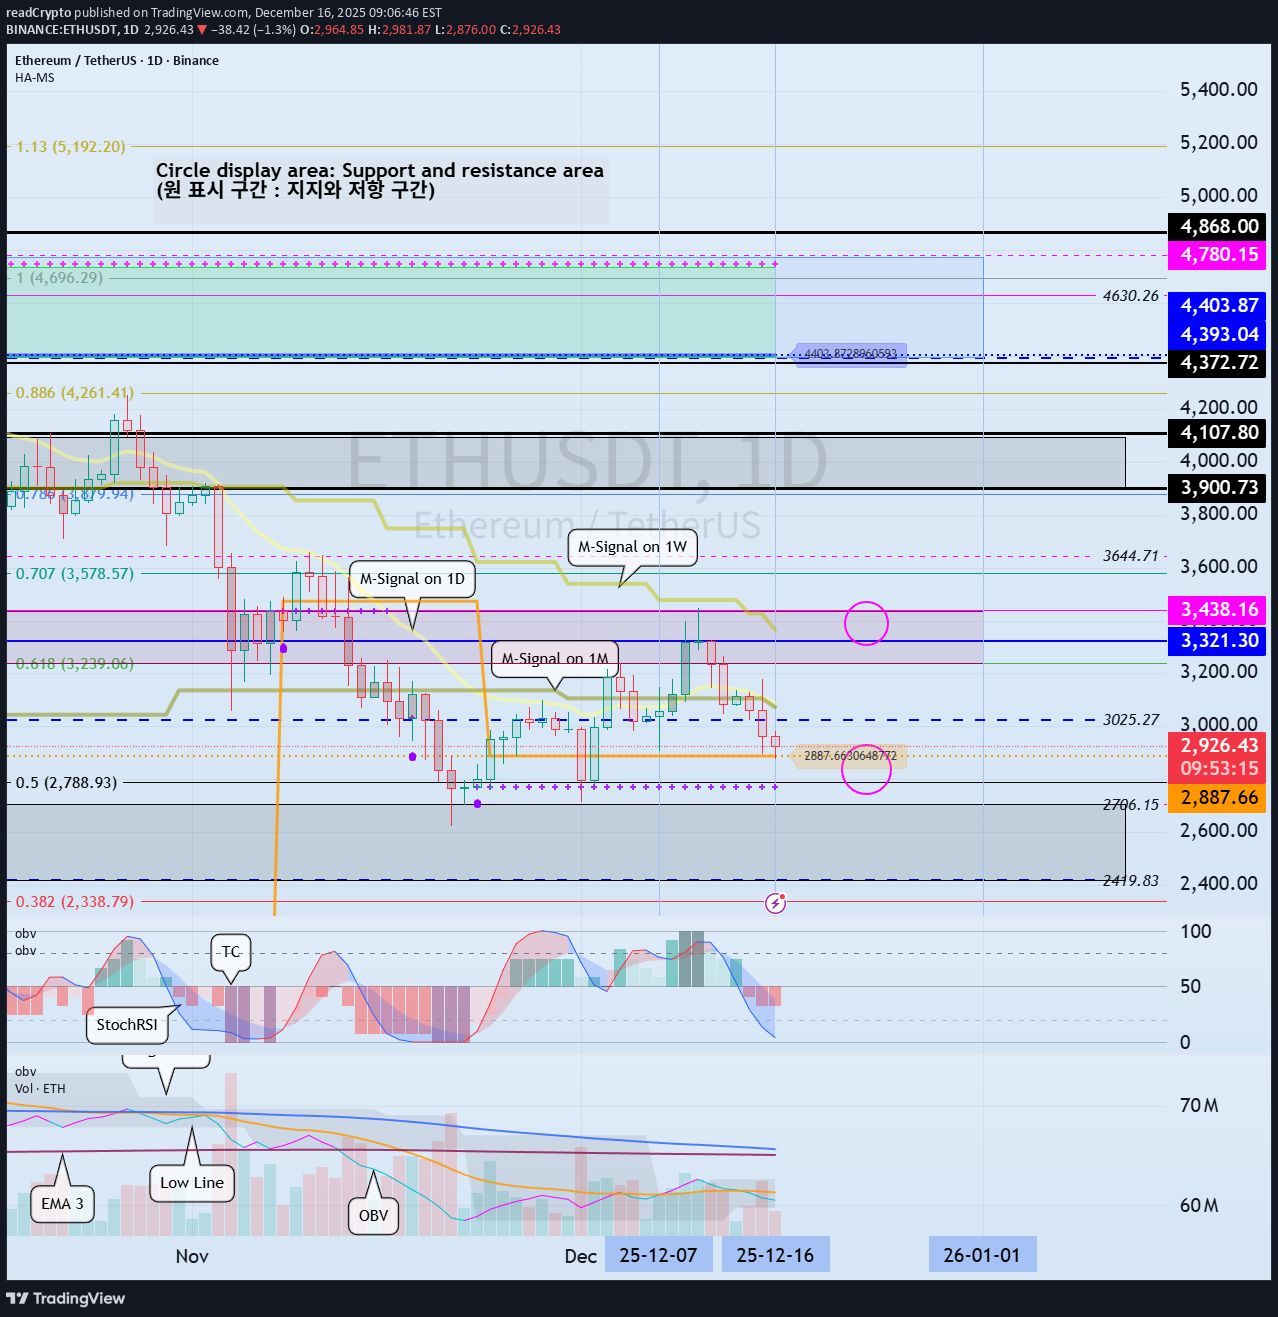
سلام، تاجران! ما را دنبال کنید تا سریع ترین اطلاعات را دریافت کنید. روز خوبی داشته باشید! ------------------------------------ (نمودار ETHUSDT 1D) انتظار می رود این دوره نوسانات تا 17 دسامبر ادامه داشته باشد. برای شروع یک روند صعودی، قیمت باید بالاتر از اندیکاتور M-Signal در نمودار 1M افزایش یابد و ثابت بماند. از این نظر، نکته کلیدی این است که آیا قیمت می تواند حمایت نزدیک به 2887.66 را پیدا کند و از 3025.27 بالاتر رود تا حرکت صعودی خود را حفظ کند. با این حال، انتظار میرود که یک روند صعودی در مقیاس کامل تنها در صورتی آغاز شود که قیمت بالاتر از محدوده HA-High ~ DOM (60) در نمودار 1M (3321.30-3438.16) باشد. - از منظر معاملاتی، معامله زیر شاخص M-Signal در نمودار 1M دشوار است، بنابراین در صورت امکان، بهتر است یک فرصت معاملاتی در حدود 3025.27 بر اساس وجود پشتیبانی پیدا کنید. در میان مدت و بلند مدت، هر زمان که پشتیبانی در نزدیکی محدوده DOM (-60) ~ HA-Low یافت می شود، می توانید به صورت اقساطی خرید کنید. بنابراین زمان خرید اقساطی تا یافتن پشتیبانی نزدیک به ۲۷۷۰.۱۲-۲۸۸۷.۶۶ است. با این حال، اگر قیمت از محدوده DOM(-60) به محدوده HA-Low کاهش یابد، احتمال یک روند نزولی وجود دارد، بنابراین باید یک اقدام متقابل در نظر بگیرید. به عبارت دیگر، اگر زمانی خرید کردهاید که قیمت در نزدیکی محدوده DOM(-60) تا HA-Low پشتیبانی میشود، میتوانید بخشی از داراییهای خود را هنگامی که قیمت افزایش مییابد و سپس شروع به کاهش میکند، بفروشید و سکهها (توکنها) را مطابق با سود باقی میگذارید. این کار به صورت اقساطی قابل انجام است. - برای حفظ روند صعودی از دیدگاه بلندمدت، قیمت باید بالای 2419.83-2706.15 حفظ شود. اگر این شکست بخورد و قیمت کاهش یابد، یک روند نزولی بلند مدت محتمل است، بنابراین شما باید یک اقدام متقابل را در نظر بگیرید. دو نوع کاهش وجود دارد: 1. کاهش عادی این زمانی اتفاق می افتد که قیمت از محدوده DOM(-60) به محدوده HA-Low افزایش می یابد، محدوده HA-High تا DOM(60) را تشکیل می دهد و سپس کاهش می یابد. این کاهش احتمالاً تا زمانی که به شاخصهای DOM(-60) یا HA-Low برسد ادامه داشت، که سنجش میزان واقعی کاهش را دشوار میکند. بنابراین، در طول کاهش عادی، تعیین زمان خرید جزئی دشوار است، بنابراین هنگام خرید احتیاط توصیه می شود. با این حال، سایر شاخص ها و سطوح حمایت و مقاومت را می توان برای تخمین زمان استفاده کرد. 2. کاهش پلکان این به کاهش بیشتر از DOM(-60) به محدوده HA-Low اشاره دارد. بنابراین، اگر کاهش ادامه یابد، شاخصهای DOM(-60) یا HA-Low در نهایت دوباره با آن مواجه میشوند که امکان زمانبندی خرید جزئی را فراهم میکند. با این حال، از آنجایی که پیش بینی فراوانی این کاهش غیرممکن است، معاملات تقسیمی ضروری است. هنگام انجام یک معامله تقسیم، مهم است که تعداد سکه ها (توکن ها) مربوط به سود را با شرکت در معاملات کوتاه مدت (معاملات روزانه) در هر قیمت خرید تقسیمی افزایش دهید. در عین حال، باید بخشی از اصل خود را بازیابی کنید تا وجوهی را برای خریدهای تقسیم شده آینده تضمین کنید. - در میان افت هایی که در بالا ذکر شد، لحظه ای که باید به آن علاقه مند باشیم، زمانی است که نزول مرحله دوم رخ می دهد. به عبارت دیگر، زمانی که اندیکاتورهای DOM(-60) یا HA-Low برآورده می شوند، ارزش معامله را دارد. - ممنون که تا آخر خواندید. برای شما آرزوی تجارت موفق دارم. ------------------------------------------------
readCrypto
The key is whether it can rise above 0.2851
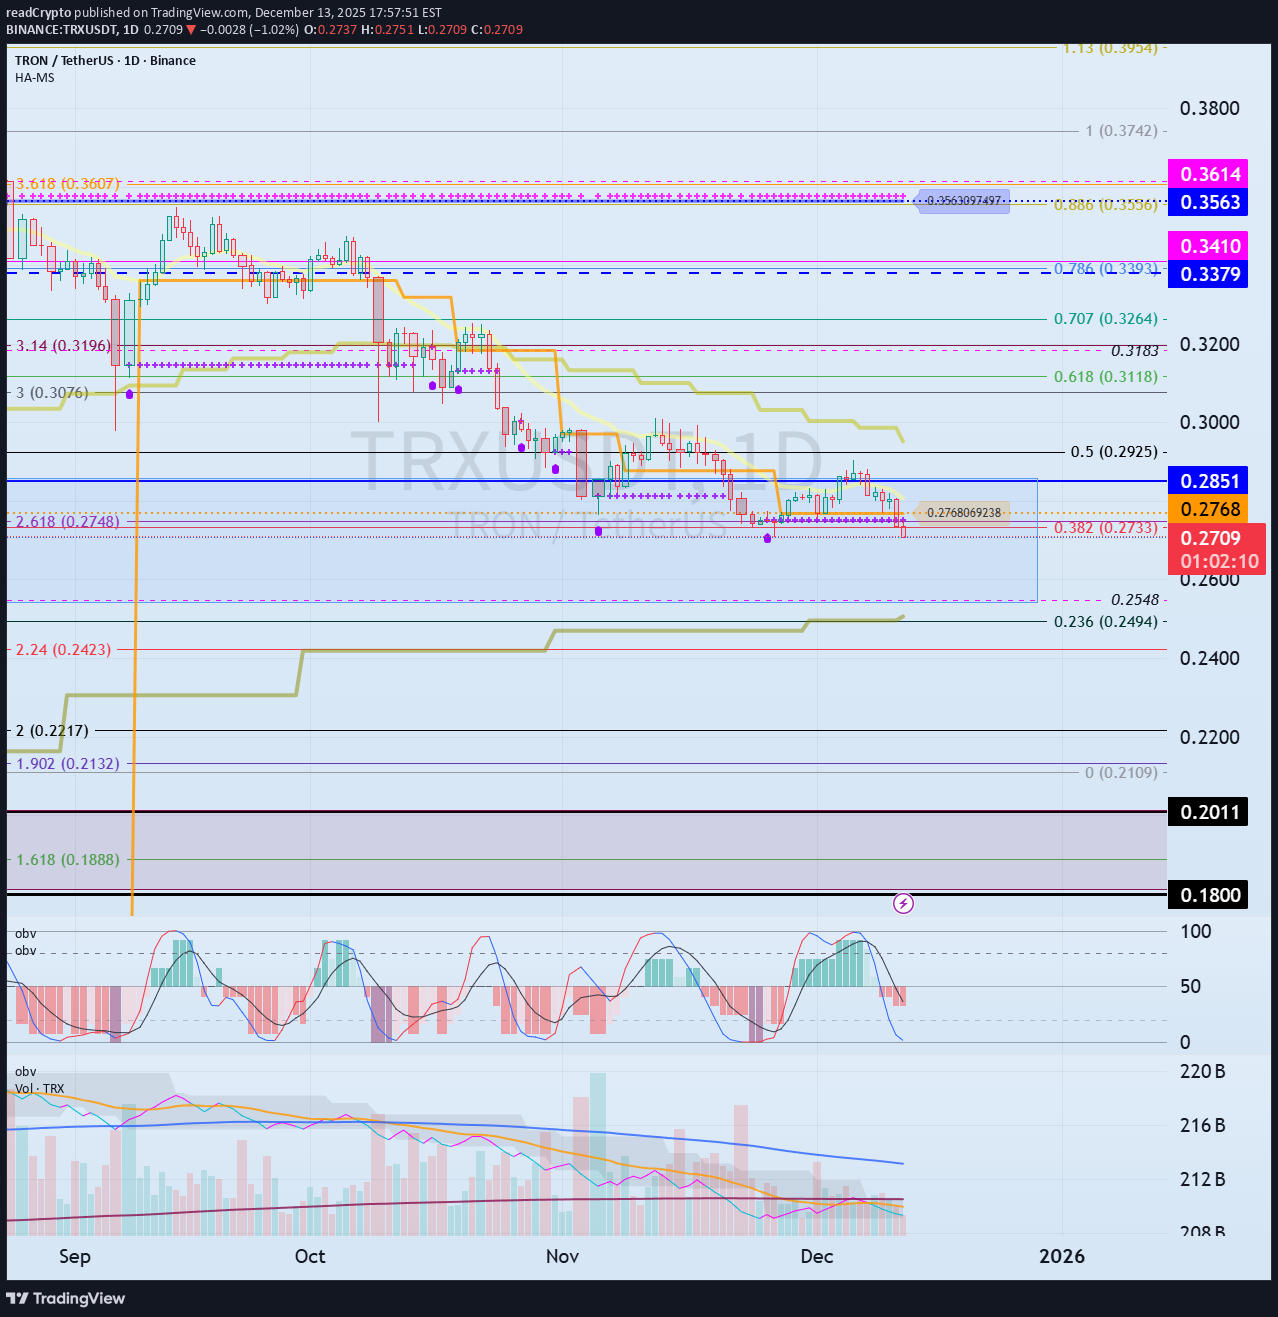
با سلام خدمت شما بازرگانان ما را دنبال کنید تا سریع ترین اطلاعات را دریافت کنید. روز خوبی داشته باشید. ------------------------------------ (نمودار TRXUSDT 1M) از دیدگاه بلندمدت، برای ادامه روند صعودی، قیمت باید بالای 0.18-0.2011 باقی بماند. اگر با مقاومت 0.2851 مواجه شد و کاهش یافت، باید پشتیبانی را در نزدیکی اندیکاتور M-Signal در نمودار 1M بررسی کنیم. در صورت کاهش بیشتر، حمایت در حدود 0.18-0.2011 بسیار مهم بود. - (نمودار 1W) با نگاهی به نمودار 1W، باید بررسی کنیم که آیا پشتیبانی نزدیک به 0.2548-0.2851 پیدا می کند و می تواند افزایش یابد یا خیر. اگر پشتیبانی نزدیک به 0.2548-0.2851 پیدا کند و افزایش یابد، سوال اصلی این است که آیا می تواند از محدوده 0.3379-0.3614 عبور کند یا خیر. - (نمودار 1 بعدی) بنابراین، اول: 0.2548-0.2851 2: 0.18-0.2011 هنگامی که پشتیبانی نزدیک به سطوح 1 و 2 در بالا یافت می شود، نشان دهنده یک دوره خرید جزئی است. در حال سقوط به زیر شاخص HA-Low است که یک روند نزولی گام به گام را نشان می دهد. بنابراین، باید منتظر توقف روند نزولی پلکانی یا افزایش تعداد سکهها (توکنهایی) باشید که میتوانید از طریق معاملات روزانه سود ببرید. - ممنون که تا آخر خواندید. برای شما آرزوی تجارت موفق دارم. ------------------------------------------------
سلب مسئولیت
هر محتوا و مطالب مندرج در سایت و کانالهای رسمی ارتباطی سهمتو، جمعبندی نظرات و تحلیلهای شخصی و غیر تعهد آور بوده و هیچگونه توصیهای مبنی بر خرید، فروش، ورود و یا خروج از بازارهای مالی نمی باشد. همچنین کلیه اخبار و تحلیلهای مندرج در سایت و کانالها، صرفا بازنشر اطلاعات از منابع رسمی و غیر رسمی داخلی و خارجی است و بدیهی است استفاده کنندگان محتوای مذکور، مسئول پیگیری و حصول اطمینان از اصالت و درستی مطالب هستند. از این رو ضمن سلب مسئولیت اعلام میدارد مسئولیت هرنوع تصمیم گیری و اقدام و سود و زیان احتمالی در بازار سرمایه و ارز دیجیتال، با شخص معامله گر است.