تحلیل تکنیکال readCrypto درباره نماد JASMY در تاریخ ۱۴۰۴/۱۰/۱

readCrypto
Selection and Focus
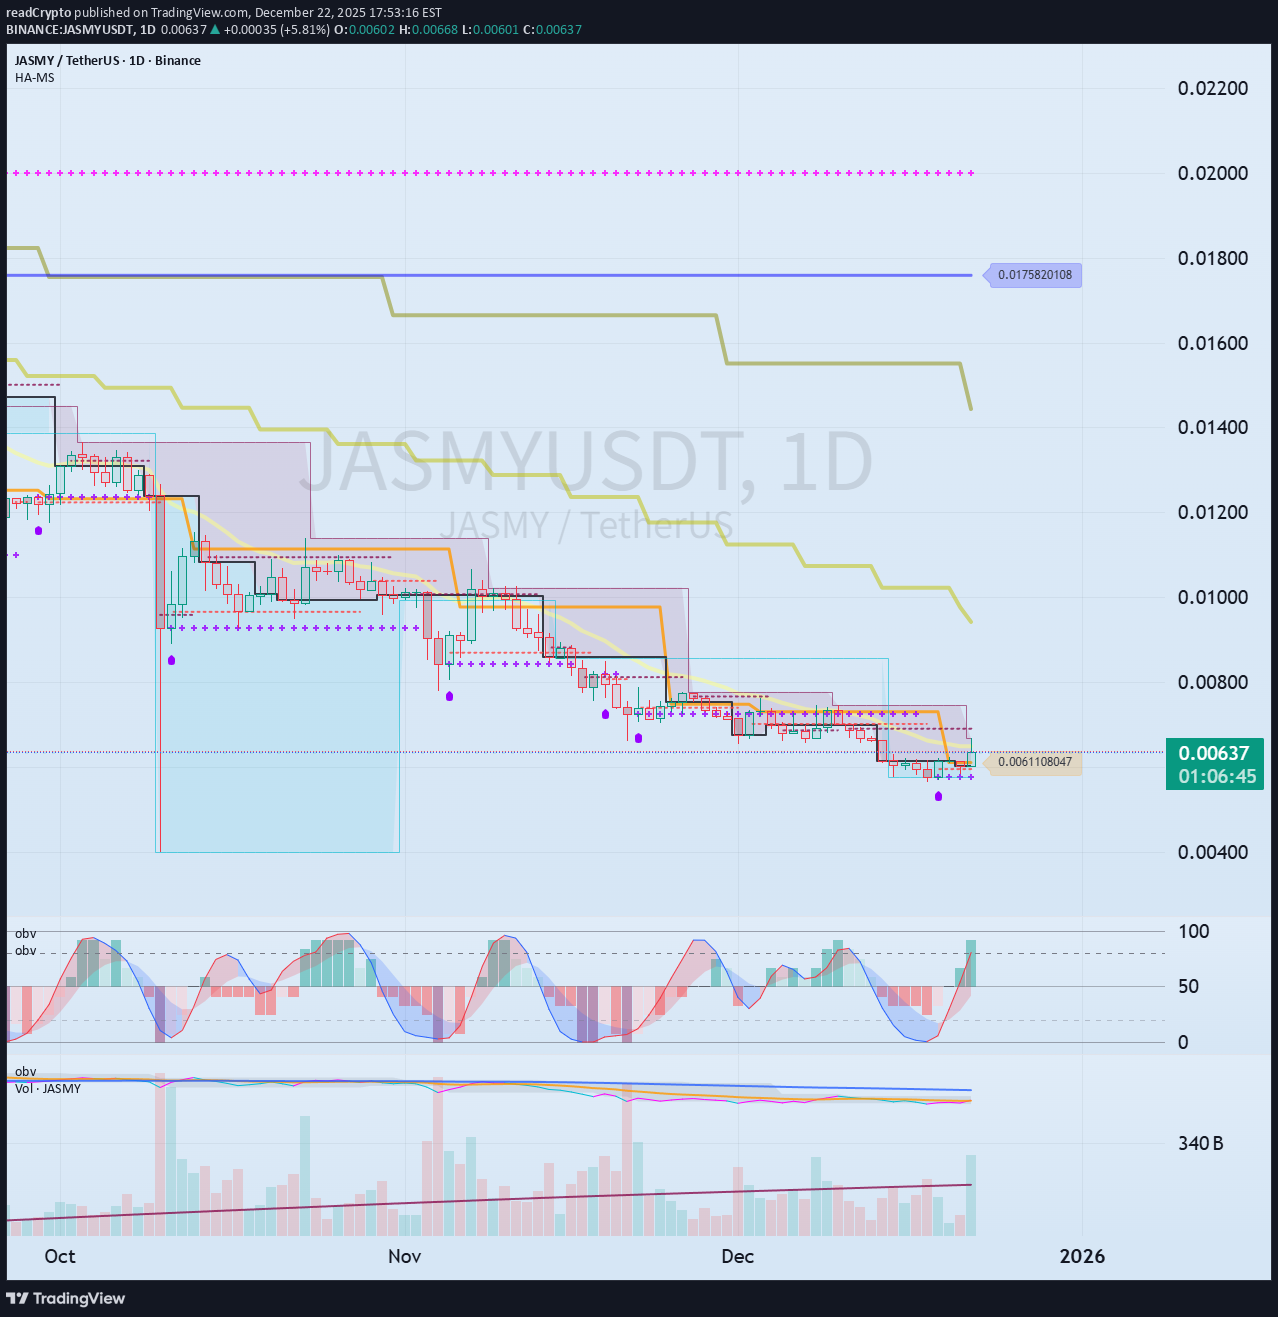
Hello, traders. By "Following," you'll always receive the latest information quickly. Have a great day. ------------------------------------- We are always at a crossroads. We choose which instruments and coins (tokens) to trade and take responsibility for that choice. You can see in the chart above that the price has fallen back to near the HA-Low indicator on the 1W chart. And, the 1D chart shows a stepwise downward trend. In other words, the price fell below the HA-High indicator, exhibiting a normal decline, and then encountered the HA-Low indicator, forming a stepwise downtrend. A normal downtrend is formed from a high and then declines, while a stepwise downtrend is formed from a low and then renewed. While both types of downtrends ultimately represent the same decline, the difference is that in a stepwise downtrend, you can choose the criteria for entering a trade. Therefore, we can look for charts where a stepwise downtrend transitions to an uptrend and trade based on whether support and resistance are present. Looking at this example chart, the price fell below the HA-High indicator on August 14th and then exhibited a normal downtrend. Then, on October 10th, it fell below the HA-Low indicator, forming a stepwise downtrend. Looking at the larger 1W chart, we can see that the price has been in a normal downtrend since February 3rd, falling below the HA-High indicator. Then, after October 6th, it touched the HA-Low indicator, indicating that it had reached a low. It appears to be currently testing support near the HA-Low indicator level of 0.00544. Therefore, whether support is found near the HA-Low indicator level of 0.00544-0.00611 on the 1W and 1D charts indicates a different meaning from the stepwise decline seen so far. However, the point at which the downtrend turns into an uptrend and the uptrend is likely to begin is when the price rises above 0.01090 and holds, giving us time to decide on a trade. Therefore, we can buy when the price rises after finding support in the 0.00544-0.01090 range. The buy zone, or support zone, is too wide, making it difficult to trade. In this case, we buy when the price rises after finding support in the key zone, such as the 0.00544-0.00611 range or near 0.01090. Most traders are afraid to buy at the lowest price, so they will buy when the price rises to around 0.01090. This phenomenon is called a breakout trade. In other words, the psychological pressure to buy arises when the price breaks above 0.01090. Therefore, you should buy when the price rises after finding support in the DOM(-60) ~ HA-Low range, and sell some of the gains, gradually buying during a stepwise downtrend. By leaving behind coins (tokens) that represent profits, you can reduce the burden of buying at the bottom. However, if you're not familiar with day trading, you may continue to use your investment funds to buy. However, don't be afraid of this. This is because the start of a stepwise downtrend means that the likelihood of a bullish turn has increased. What you should be afraid of is the HA-High ~ DOM(60) range, i.e., when you buy during the high and then the downtrend begins. This is because you don't know how far the decline will go. Only when you encounter the DOM(-60) or HA-Low indicators will you know the end of the decline is near. Therefore, you need to understand the current position of your chosen asset or coin (token) and consider how to set your trading timing and how to proceed with the trade. ------------------------------------------------------------------ From this perspective, looking at the BTC chart reveals the significance of its current position. In other words, if the price declines from the current position, it marks the beginning of a stepwise downtrend. If it rises, it indicates the possibility of an upward trend until it encounters the HA-High or DOM(60) indicator. The M-Signal indicator on the 1M chart passes through this crucial crossroads, making it even more crucial. The same holds true for the ETH chart. Therefore, rather than focusing on whether the price will rise or fall, you should check for support near the established low point, i.e., the DOM(-60) to HA-Low range, and respond accordingly by making split purchases. In other words, trading that leaves behind the coins (tokens) that represent profits from day trading is a useful strategy. If you're not familiar with day trading, you should purchase at the lowest possible price between DOM(-60) and HA-Low. Since these purchases should be made every time a cascading downtrend occurs, it's best to purchase in small amounts. If you find a profitable purchase price within the DOM(-60) to HA-Low range on a certain day, you can sell the amount of each purchase price, leaving the coins (tokens) that represent profits. It sounds simple, but actually executing a trade is not easy. Therefore, this trading method (leaving coins corresponding to profits) should be practiced during a cascading downtrend to become familiar with it. Therefore, until you become accustomed to it, trade with small amounts of capital. - Thank you for reading to the end. I wish you successful trading. --------------------------------------------------If possible, it's best to select a stock or coin (token) whose price remains above the M-Signal indicator on the 1M chart. The chart displays the M-Signal indicators for the 1M, 1W, and 1D charts. However, depending on the chart's creation period, some M-Signal indicators may not be displayed. In this case, select the highest M-Signal indicator. In the chart above, the M-Signal indicator on the 1W chart is currently the highest.