
brandlabelden
@t_brandlabelden

تریدر چه نمادی را توصیه به خرید کرده؟
سابقه خرید
تخمین بازدهی ماه به ماه تریدر
پیام های تریدر
فیلتر
نوع پیام
brandlabelden
Melania Trump Token Near Its Breaking Point – Bounce or Breakdow
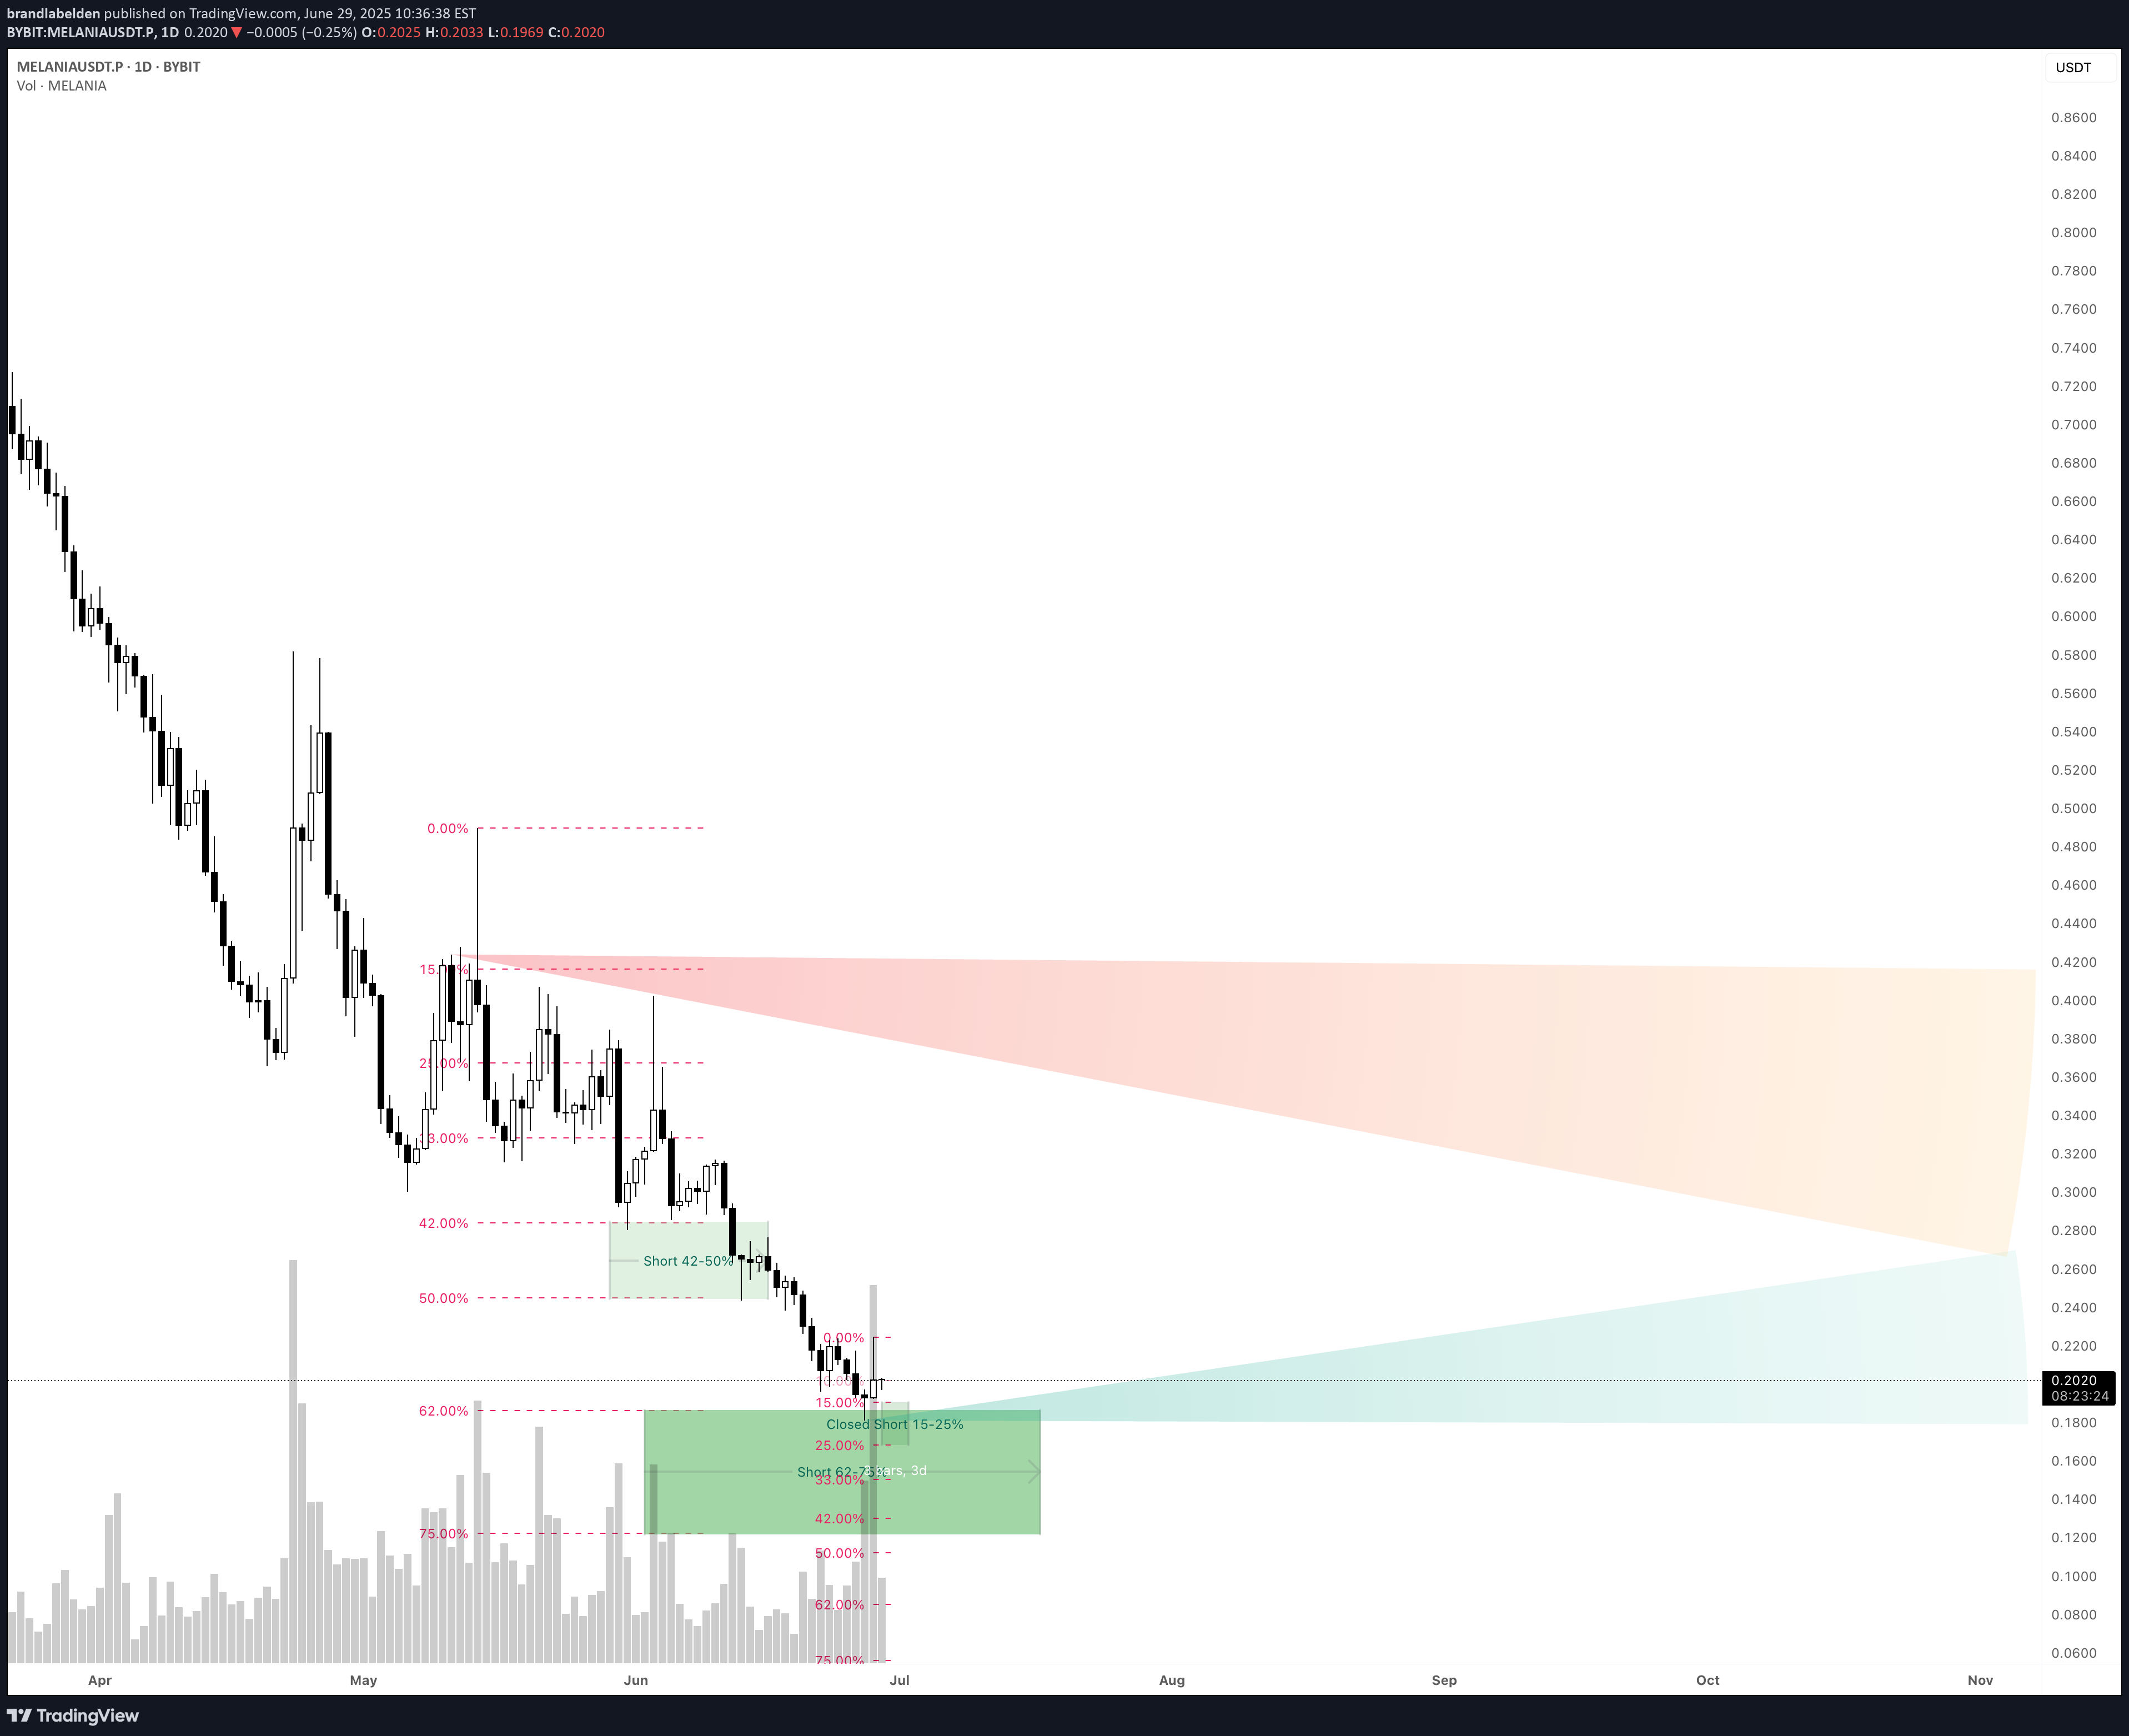
A Crossroad for MELANIAUSDT: Is the Reversal Real or a Mirage? In a dramatic twist of fate, Melania Trump's meme token (MELANIAUSDT) has rebounded over 11% from its all-time low of $0.1811, set just two days ago. The current price sits at $0.2016, still nearly 99% below its euphoric peak of $14.50 from January. With Relative Strength Indexes (RSI14 at 51.1 and RSI60 at 48.7) signaling a neutral zone and the MFI showing modest inflows (56.0), the market is hesitating—undecided between exhaustion and opportunity. Yet beneath the surface, tension is building. Despite massive recent sell-offs, a flurry of powerful VSA Buy patterns has appeared, hinting at potential accumulation. Price is coiling tightly around the 50-day and 100-day moving averages (0.2012 and 0.2014 respectively), setting the stage for a volatility burst. Traders are now watching the 0.2173 resistance zone like hawks—can MELANIA break through and retest higher liquidity levels? Macroeconomic uncertainty and post-election crypto buzz add fuel to the fire. Could Trump's public stance or policy whispers inject speculative lifeblood into this once-hyped token? Whether you're a long-term investor scouting for a reversal or a scalper eyeing short-term momentum, MELANIA is standing at a technical inflection point. The question now: Will the next move be a relief rally... or the final capitulation? Roadmap: MELANIAUSDT Price Manipulation Unveiled Let’s walk through the recent story MELANIAUSDT has been telling — candle by candle, pattern by pattern. Only the real plays, where the market truly respected the setup, made the cut here. * June 27, 07:00 UTC – VSA Buy Pattern Extra 1st appears: The setup screamed "bounce incoming!" after a deep dive. With price at $0.1893 and a low around $0.1888 — almost kissing the absolute bottom — we got a clean reaction. The price lifted in the following sessions, proving this wasn’t just noise. The market respected the buy zone and traders who listened to this whisper from the VSA playbook were rewarded. * June 28, 10:00 UTC – Buy Volumes Max kicks in: The bulls roared louder. Volume surged, price jumped from $0.2034 to $0.2168, challenging the $0.2243 high — that’s a textbook confirmation of the previous bullish intent. Anyone still doubting the reversal? This was the second tap on the shoulder. * June 28, 15:00 UTC – Sell Volumes arrive… but do they dominate? Here’s the twist. A heavy sell volume pattern forms with price closing at $0.2048, but critically, it doesn’t knock out the previous bullish levels. Instead of a meltdown, we see consolidation — a classic bull trap fake-out or just a breather? Either way, this didn’t cancel the bullish setup from earlier. It paused it. What’s key here? Every legitimate VSA buy pattern had one thing in common — follow-through. The market moved in the intended direction with clean volume footprints. That’s the game. These weren’t just chart doodles — they were trading signals with teeth. Next time you see VSA Extra or Buy Volumes fire up again near key support? You might want to listen. This roadmap proves it. Technical & Price Action Analysis Here’s the level map every serious trader should have on their radar for MELANIAUSDT. These aren’t just numbers — they’re where the action happens. Support Zones to Watch for Dips and Reloads: 0.1827 – Local support, tested recently. If it fails, expect it to flip into resistance real quick. 0.5394 – Major support. If the market ever comes back here, that’s deep value territory. 0.5852 – Stronghold level. Expect buyers to show up in size. Resistance Zones – Take-Profit Traps or Breakout Launchpads: 0.2173 – Immediate upside test. Bulls need to break and lock above to confirm momentum. 0.2266 – Watch this for fakeouts. Price may tap it and snap back. 0.2464 – Mid-range resistance. A flip here changes the whole structure. 0.2744 – Strong sell wall ahead. Needs volume to smash through. 0.2875 – Key breakout marker. Clearing this opens room for serious upside. Heads-up: Any level that fails to hold as support will act like a ceiling on the way back up. That’s trading 101 — broken floors become rooftops. So stay sharp and don’t get trapped on the wrong side of the move. Strategy: Trading the Rays – Navigating Dynamic Price Zones Let’s break down how to actually trade MELANIAUSDT using the "Rays from the Beginning of Movement" method — a strategic framework based on Fibonacci geometry that doesn’t just predict, but reacts to what the market is telling us in real-time. The game plan here is simple but powerful: price always reacts to the rays. These reactions give you two choices — get in on a reversal or ride the continuation to the next ray. Levels aren't static; they evolve with the market. We don’t chase fixed targets. We track flow. These rays intersect with key Moving Averages (MA50 at 0.2012, MA100 at 0.2014, MA200 at 0.207, MA233 at 0.2115) and VSA zones already drawn on your chart. What you see isn’t random — it’s structure. Optimistic Scenario – Momentum Ignites from the Ray Zone: Long from 0.2015 (price + MA50 cluster) - First target: 0.2173 – Key resistance and breakout trigger - Second target: 0.2266 – Medium-term seller interest - Third target: 0.2464 – High conviction profit zone Aggressive Entry from 0.207 (MA200 bounce) - Expect fast action toward 0.2173 and above. Volume needs to confirm. Ray Break + Close Above 0.2173 - Bullish confirmation to aim for 0.2464 and possibly stretch into 0.2744 – but only if MA233 flips support Pessimistic Scenario – Failure to Hold Dynamic Support: Short below 0.2012 (MA50 fails + ray rejection) - First target: 0.1827 – Local floor and recent bounce point - Second target: 0.1811 – Absolute low. If this breaks, it’s open air If price taps 0.2173 and sharply reverses - Enter short post-rejection - Target: 0.2015 support zone for scalp, lower if momentum confirms Core Rules: You don't enter until the ray says go. You don’t guess — you react. After the price touches a ray and gives a reaction — a VSA pattern, volume spike, or candle confirmation — that’s your green light. Trades move ray to ray. That’s your roadmap. Let others chase noise. You follow structure. Let’s Keep the Conversation Going If you’ve got questions, ideas, or just want to talk shop — drop them right in the comments. I read everything and I’m always happy to chat with fellow traders. If this analysis helped you see the market a bit clearer, hit that Boost and save it to your ideas. Come back in a few days and watch how price respects the levels and rays — that’s how we learn and grow in this game. By the way, all the rays and levels you see here are drawn automatically by my private indicator-strategy. It’s not public, but if you’re interested in using it, just send me a direct message — we’ll figure something out. Need a custom analysis for your favorite coin or asset? I can do that too. Some ideas I share openly, others we can keep private if you prefer — just let me know your style. These rays work on any asset. If there’s a chart you want me to break down, hit Boost and write it in the comments — I’ll do my best to include it in the next posts. And don’t forget to follow me here on TradingView. This is where I share all my setups and insights first. Let’s trade smart together.
brandlabelden
Bitcoin's Next Move: Accumulation or Breakdown?

The Market at a Tipping Point – What's Next for Bitcoin? Bitcoin (BTC) is currently trading at $80,594, sitting 26.7% below its all-time high of $109,951 reached just over a month ago. The market is showing signs of uncertainty—traders are caught between a potential accumulation phase and a looming correction. The Relative Strength Index (RSI) is flashing 38.2, creeping towards oversold territory, while the Money Flow Index (MFI) at 28.2 suggests that liquidity is drying up. With MA50 at 84,015 and MA200 at 92,048, BTC remains below key moving averages, signaling bearish momentum in the short term. But is this really a time to sell—or could this be a golden accumulation zone before the next leg up? Recent VSA Buy Patterns indicate that smart money could be positioning for an upward move. However, resistance at $84,686 looms overhead, a level that must be reclaimed before bulls can take control. On the flip side, failure to hold above $76,701 support could open the floodgates to lower levels. So, what’s the verdict? Breakout or breakdown—who’s ready for the next move? Bitcoin's Price Roadmap: Tracking the Smart Money Moves The market never lies, but it sure knows how to fake out the crowd. Let's break down the most recent Bitcoin (BTC) price action through the lens of high-impact VSA patterns and volume dynamics, separating the noise from the real moves. Phase 1: The Sell-Off – Smart Money Setting the Trap? * 2025-02-26 18:00 UTC – Sell Volumes Max kicks in, sending BTC downward from $86,002 to $84,112, a clear indication that the big players were offloading before the next major move. * 2025-02-28 01:00 UTC – Confirmation: Another Sell Volumes pattern emerges, pushing BTC lower to $81,613. The downward momentum is undeniable. Bears are in control. Phase 2: A Reversal or a Trap? * 2025-02-28 08:00 UTC – VSA Buy Pattern Extra 1st emerges at $79,176, signaling an accumulation phase. The structure suggests a comeback, but we need validation. * 2025-02-28 06:00 UTC – VSA Buy Pattern Extra 2nd confirms the recovery as BTC moves up from $79,953 to $80,392, bouncing off key liquidity zones. Phase 3: Where Are We Now? * Bitcoin's ability to reclaim $80K+ and sustain above the $78K liquidity zone suggests that the market might be done with the shakeout. However, true confirmation lies in breaking $84,686 resistance before bulls can run the show. * The MFI at 28.2 still signals low liquidity, meaning bulls need fresh momentum to confirm a sustainable move. Key Takeaway: The Next Play If BTC holds above $80K, watch for a move toward $84K+. If volume dries up, expect another flush before the real pump begins. Either way, the big money has already placed their bets—are you ready? Technical & Price Action Analysis: Key Levels to Watch When it comes to Bitcoin, levels are everything—play them right, and you’re in the game. Miss them, and you’re catching knives. Here’s what’s on the board: 📍 Resistance Levels – Where the Heat Is * $84,686 – First roadblock, and where sellers could step in hard. * $92,058.5 – If BTC rips past 84K, this is the next stop. * $94,036.1 – Mid-level supply zone; needs a breakout confirmation. * $96,271.2 – Psychological barrier before the big leagues. * $100,796.4 – The last line before full-on euphoria. 🛠️ Support Levels – Where the Bounces Happen * $76,701.7 – If bulls want a second chance, they gotta hold this. * $67,838.7 – Break this, and we’re talking deeper retrace. * $60,295.6 – Final line of defense before things get ugly. * $47,122.4 – Buyers better show up here. * $28,696.9 – Let’s not even talk about this one… 🚀 Powerful Levels – The True Battlegrounds * Support: $96,262.6 – Bulls want this level back, or it flips to resistance. * Resistance: $76,701.7 – If price reclaims this, expect fireworks. ⚠️ If these levels don’t hold, they flip to resistance. That’s how the market works—fail to bounce, and these same zones become walls for the next run-up. Stay sharp, play the levels, and let the market show its hand. Trading Strategies Using Fibonacci Rays: Optimistic & Pessimistic Scenarios The VSA Fibonacci Rays are already on your chart—your job is to watch for price interactions and react accordingly. These dynamic levels are based on the natural flow of price action, not rigid static points. When price meets a ray, it signals either a reversal or continuation, but only after confirmation from volume dynamics and moving averages. 🚀 Optimistic Scenario: Bulls Take Control If Bitcoin reclaims key resistances and confirms strength via moving averages, we’re looking at a trend continuation. * Long Entry: $80,594 (current market level) * First Target: $84,686 (First resistance break confirms strength) * Second Target: $92,058 (MA200 alignment, momentum builds) * Final Target: $96,271 (Extended breakout zone) Trigger: A clean bounce from Fibonacci Ray support with rising buy volume. Confirmation via RSI moving above 50 and MA50 flipping upward. 🔻 Pessimistic Scenario: Bears Keep the Pressure If Bitcoin fails to hold above $76,701, we’re entering a corrective phase with further downside possible. * Short Entry: $76,700 (Break below key support) * First Target: $67,838 (Next liquidity grab zone) * Second Target: $60,295 (Stronger demand area) * Final Target: $47,122 (Capitulation scenario, extreme bear case) Trigger: A rejection at $80,000–$81,000 on weak volume + failure to reclaim MA50 resistance. Confirmation via RSI below 40 and a bearish cross on MA100 & MA200. 🎯 Key Takeaways for Trade Execution * Always wait for price interaction with a Fibonacci Ray before entering. * Trades run from ray to ray—first target is always the next ray in the sequence. * A bounce from support rays = long setup. A failure to reclaim resistance rays = short setup. * MA50 & MA200 act as trend confirmations—price above is bullish, below is bearish. Bottom line: The market won’t move in straight lines, but rays act as dynamic waypoints, guiding price through the chaos. Position accordingly. Got questions? Want to discuss levels, setups, or how to use these insights in your trading? Drop your thoughts in the comments! I read everything and do my best to respond. If this analysis was useful, hit Boost and save this post—check back later to see how price respects the mapped-out structure. Trading is all about understanding reaction points, and this roadmap lays them out for you. I use a private indicator that automatically plots Fibonacci rays and key levels—if you’re interested in accessing it, shoot me a message. Need a breakdown on a specific asset? I can chart it for you. Some analyses I share publicly, while others can be done privately depending on what you need. If you want a custom markup, let me know—we’ll figure out the best way to make it happen. These rays work across all assets—crypto, forex, stocks, you name it. If there’s a ticker you want analyzed, hit Boost and comment below, and I’ll include it in my upcoming posts. And if you haven’t yet—follow me on TradingView to stay ahead of the market. Let’s trade smart. 🚀
brandlabelden
WIFUSDT: Is This the Last Stand Before a Breakout?

A Critical Moment for WIFUSDT: Buyers or Sellers—Who Wins? WIFUSDT is teetering at a pivotal point, currently priced at $0.9981, reflecting a staggering -79.56% deviation from its all-time high of $4.8848 just 81 days ago. Meanwhile, the asset remains a massive 486% above its absolute low recorded nearly a year ago, underscoring its extreme volatility. Technical indicators are flashing mixed signals: 📉 RSI14 is hovering around 32.19, signaling that WIFUSDT is approaching oversold conditions, but not quite there yet. 📊 Moving Averages are still bearish, with MA50, MA100, and MA200 sitting well above the current price, reflecting lingering downside pressure. However, the latest candle patterns suggest growing instability: ✅ Buyers attempted a takeover in the last session, driving prices from $0.9807 to $0.9981 with a high of $1.0194. ❌ Prior bearish volume dominance, where increased selling pressure pulled the price down from $0.9966 to $0.9807, remains a concern. So, what’s next? Is WIFUSDT on the brink of reclaiming key resistance levels at $1.2916 and beyond, or will it succumb to seller dominance and revisit its lower support zones? Your move, traders. WIFUSDT Roadmap: Tracking the Market's Next Big Move * VSA Manipulation Sell Pattern 3rd (Jan 31, 18:00 UTC) Heavy sell-off triggered a sharp decline $1.2625 → $1.1371, with a low at $1.1082. A textbook VSA manipulation move, where weak hands were shaken out. The key question: will buyers step in at this level, or is more downside ahead? * Increased Buy Volumes (Jan 31, 19:00 UTC) Buyers made an aggressive comeback, pushing the price $1.1371 → $1.1813. A solid confirmation of demand, but resistance at $1.1990 remains a critical barrier. Will this be a continuation or just a liquidity grab before another dump? * VSA Manipulation Buy Pattern 3rd (Feb 1, 10:00 UTC) This was the true test of bullish strength. Price surged from $1.0916 → $1.1021, closing above the trigger point—a classic signal for an extended move. But will bulls hold their ground, or will sellers take over again? * Increased Sell Volumes (Feb 2, 03:00 UTC) Trap alert! After a brief rally, sellers stepped back in, pushing the price down $0.9966 → $0.9807. Bears are showing dominance, but they failed to break below the key level of $0.9773. * Sell Volumes Takeover (Feb 2, 04:00 UTC) This was the moment of truth—bears tried to push lower, but bulls fought back, sending the price $0.9807 → $0.9981. This reversal hints at potential upside, but confirmation is needed with a break above $1.0194. Conclusion: The market has been heavily manipulated by both sides, but the last pattern suggests sellers are losing steam. If $1.0194 is broken, expect further upside momentum. However, a drop below $0.9773 could signal another bearish wave. Time to watch closely! Technical & Price Action Analysis When it comes to trading WIFUSDT, key levels are everything. If buyers can’t hold support, those same levels will flip into resistance—classic market behavior. Here’s the roadmap: Resistance Levels: * $1.2916 – First real test for bulls, flipping this opens the door for momentum plays. * $1.3355 – A historical supply zone; break and hold above confirms bullish intent. * $1.5553 – Major liquidity level; failure here could mean distribution. * $1.8968 – If price gets here, it’s game on for breakout traders. * $2.0384 – Last known battleground before an aggressive trend shift. Powerful Support Levels: * $1.4167 – Critical bounce zone; failure turns it into a major resistance. * $2.0848 – If this gets tested, expect big bids or a deep dive. Powerful Resistance Levels:** * $0.8363 – The biggest wall for any dip buyers; reclaiming flips the script. * $0.35 – If price ever touches this, it’s bargain-bin shopping or full collapse mode. Smart money watches these levels closely. If support holds, it’s a dip-buying opportunity. If not, those same levels will act as ceilings, trapping breakout traders. Play it right, and don’t get caught on the wrong side of the move. Trading Strategies Based on Rays Concept of Rays: My analysis method is based on VSA Rays, constructed using Fibonacci principles. These dynamic levels define movement channels, allowing us to track price behavior at key zones. The price will either bounce or break through these rays, signaling a reversal or continuation, but only after confirming with volume dynamics and key patterns. Instead of guessing exact price levels, we focus on probability zones where price interaction with rays gives us trading opportunities. The Moving Averages (MA50, MA100, MA200, MA233) serve as dynamic resistance/support, interacting with these rays and enhancing trade setups. Optimistic Scenario (Bullish Playbook): If price confirms interaction with a bullish VSA Ray, we enter long positions targeting the next resistance level. Each new level serves as a potential profit zone or a point of reevaluation. * Entry: Above $0.9981 (confirmed breakout from VSA Ray + bullish candle close) * Target 1: $1.2916 (first ray extension) * Target 2: $1.3355 (higher liquidity zone) * Target 3: $1.5553 (major supply area, strong resistance) * Invalidation: If price drops below $0.9773 and confirms with volume shift Pessimistic Scenario (Bearish Playbook): If price rejects from a bearish VSA Ray or fails to hold above dynamic support, shorting opportunities emerge with key downside targets. * Entry: Below $0.9807 (confirmed rejection + bearish volume surge) * Target 1: $0.8363 (first support level, possible bounce) * Target 2: $0.3500 (strong liquidity absorption zone) * Target 3: Below $0.1702 (if major breakdown occurs) * Invalidation: If price reclaims $1.0194 with strong bullish volume Key Takeaways: Trade only after confirmation of interaction with rays Expect movement from one ray to the next—each level acts as a stepping stone Use MAs for additional confluence—failure to break a moving average signals continuation Volume always matters—no volume = no conviction, wait for a real move The market is dynamic, but VSA Rays + Key Levels give us the edge to stay ahead. Watch for interaction and execute with precision. Let’s Talk Trading—Drop Your Thoughts Below! Got questions? Want to dive deeper into the setups? Drop a comment! I always check and reply, so let’s discuss the best trading opportunities together. If this breakdown helped you, hit Boost and save this idea—watch how price respects these levels over time. Trading is all about understanding key reaction zones, and this analysis gives you the exact roadmap. By the way, my custom VSA Ray indicator automatically maps all these levels and updates in real-time. It’s private, but if you want access—DM me and we’ll talk. Need analysis for another asset? I can chart anything! Some breakdowns I share publicly, but if you want something private and exclusive—we can arrange that too. Just let me know in the comments what you need. My rays work on all markets—crypto, forex, stocks—you name it. If you want a custom markup for your asset, just Boost this post and comment below, and I’ll do my best to make it happen. Most importantly—follow me on TradingView to stay ahead of the market moves. Let’s trade smart, not blind! 🚀
brandlabelden
MOCAUSDT: Oversold, Yet Ready to Explode? The Market Decides!

Is the Bottom In? MOCAUSDT Flashes Buy Signals! The crypto market never sleeps, and neither do opportunities. MOCAUSDT is currently hovering at $0.18582, down a staggering 62% from its all-time high of $0.48845 recorded just 39 days ago. But is this decline setting the stage for a major comeback? Technical indicators suggest we are at a make-or-break moment. The RSI14 is at 33.2, approaching oversold territory, while MFI60 sits at 43.8, indicating potential buying momentum. Moreover, the price is struggling near the 200 MA (0.18844), a critical level that could dictate the next major move. Interestingly, a series of VSA Buy Patterns have emerged over the past 48 hours, hinting at accumulation by smart money. Will this trigger the much-anticipated breakout, or is another dip inevitable? One thing is certain—the next move will be decisive. Are you ready to take advantage of it? MOCAUSDT Roadmap: Smart Money Moves and Key Market Reversals Understanding the market is all about catching the right waves at the right time. Let’s break down how MOCAUSDT moved recently, which patterns played out, and what traders can learn from these price shifts. * January 29: VSA Buy Pattern 3 – The market showed signs of a manipulation buy, signaling the start of an upward move from $0.17241 to $0.1772. This pattern was validated as price continued rising, confirming the bulls were stepping in. * January 30: Buy Volumes Max → Sell Volumes – A massive buying volume spike from $0.17809 pushed the price up to $0.19745, but sellers quickly took control, leading to a sharp reversal. This switch from buy to sell dominance marked a critical liquidity grab before the next wave. * January 31: VSA Sell Pattern 1 & 3 – A textbook manipulation sell setup, where price hit $0.22752 before retracing. This was the first major rejection confirming that the bullish move had peaked. Following this, VSA Buy Pattern Extra 2nd appeared at a lower price point, signaling accumulation near $0.20923. * February 1: VSA Manipulation Buy Pattern 4th – Smart money stepped back in, sending the price higher from $0.19388 to $0.19525, reinforcing the long bias. The key takeaway? Every strong dip in this cycle was met with aggressive buybacks. * February 2: VSA Buy Pattern Extra 2nd – The latest signal showed another attempt at accumulation, with price stabilizing around $0.18867. However, the move lacked the aggressive momentum seen in previous buy setups, meaning traders should watch for confirmations before jumping in. Conclusion: Reading the Tape MOCAUSDT has been in a highly reactive accumulation-distribution cycle, where every liquidity grab led to a strong price reaction. The roadmap suggests smart money is accumulating, but not in a rush to push the price up aggressively. For traders, the key levels to watch are whether buyers step in at the recent $0.185 range, or if we see another liquidity grab before the real move. Are we gearing up for a breakout, or is another shakeout on the horizon? Stay sharp, and trade smart. Technical & Price Action Analysis: Key Levels to Watch MOCAUSDT is playing the range game, bouncing between key levels. Here’s what traders need to keep on their radar: Support Levels: * 0.17241 – If buyers don’t defend this level, expect it to flip into resistance, trapping late longs. * 0.16567 – A critical retest zone; failure to hold means lower bids will get tested. * 0.16455 – The last line of defense before deeper corrections. Resistance Levels: * 0.25966 – The first real battle for bulls; if price rejects, expect a fade back into the range. * 0.2951 – Major liquidity zone; breaking above could trigger a trend shift. * 0.31409 – If bulls clear this, game on for the next leg up. Powerful Support Levels: * 0.2371 – Big money has been watching this level. If it doesn’t hold, sellers will start dictating the trend. Powerful Resistance Levels: * 0.08949 & 0.06603 – Levels that could cap any weak breakouts. If price stalls here, expect consolidation or a fakeout before the next real move. Trade Logic: If support levels don’t hold, they flip into resistance, and every failed breakout becomes a new short opportunity. The market isn’t giving out free money—trade smart, wait for confirmations, and don’t get caught chasing weak moves. Trading Strategies Using Rays: Navigating MOCAUSDT Moves with Precision The market moves in waves, but instead of relying on static levels, we focus on Fibonacci Rays—dynamic price structures that outline the natural rhythm of movements. These rays, based on mathematical and geometric principles, give us a predictive roadmap where price reacts, either bouncing or breaking through. Key takeaway? Trade after price interacts with a ray and confirms direction. The movement will continue from one ray to the next, forming the key targets of our trade. Optimistic Scenario: Bulls Take Control If buyers step in at key Fibonacci ray intersections, we can expect a continuation to higher levels. The first confirmation will be the price breaking above MA200 (0.18844) and staying above. Entry: Buy after price interacts with a ray at 0.17241, forming a reversal. First target: 0.2371 – The next ray and powerful support turned resistance. Second target: 0.25966 – A strong resistance level where a pullback could occur. Final bullish target: 0.2951 – If momentum stays strong, this is the next major liquidity grab zone. Pessimistic Scenario: Sellers in Control If the price fails to hold MA200 (0.18844) and breaks below Fibonacci rays, expect a move lower to the next liquidity zone. Entry: Sell after rejection at 0.18844 if price fails to reclaim it. First target: 0.17241 – The closest ray where buyers might step in. Second target: 0.16567 – If weakness persists, this is the next stop. Final bearish target: 0.16455 – The ultimate support before deeper losses. Trade Ideas: Key Setups to Watch Ray-to-Ray Bullish Breakout: Buy above 0.18844, target 0.2371, stop-loss below 0.17241. Ray-to-Ray Bearish Breakdown: Sell below 0.18844, target 0.17241, stop-loss above 0.19525. Range Rebound Trade: Buy near 0.17241, take profits at 0.18844, stop-loss below 0.16567. Momentum Scalping: If price bounces at 0.2371, buy and target 0.25966, stop-loss below 0.225. All these setups are backed by VSA rays, which are already plotted on the chart—so stay patient, wait for interaction, and ride the move from ray to ray. Your Move, Traders! 🚀 That’s the full breakdown—now it’s your turn! Got questions? Drop them right in the comments below, and let’s discuss the best trading setups together. If you found this analysis useful, hit Boost and save this idea—you’ll want to check back and see how price respects these rays. Trading isn’t about guessing, it’s about understanding key reaction points, and now you have them. My private strategy automatically plots all rays and levels, making trade setups clear and structured. If you’re interested in using it, shoot me a private message—it’s exclusive, but we can discuss how you can get access. Need analysis on a different asset? I can chart any market with precision. Some ideas I share for free, while others can be done privately—depends on what you need. Let me know in the comments which asset you want covered next, and if there’s enough interest, I’ll make it happen! And of course, if you’re serious about trading—follow me on TradingView. That’s where all the real-time updates and insights go first. See you in the next one! 🔥
brandlabelden
Is This the Bottom? MELANIAUSDT at a Critical Turning Point

The Market is at a Crossroads – What Comes Next? Twelve days ago, MELANIAUSDT.P stood at its absolute high of $14.496, but since then, it has collapsed an astonishing 87.1%, currently trading near its absolute low of $1.865, which was just set today. The sell-off has been relentless, but is the market about to reverse? Technical indicators are signaling extreme oversold conditions—RSI(14) at 25.23, deep into the danger zone where price often finds a local bottom. The MFI(60) also hovers at 30.98, confirming weak buying pressure, but with a potential for reversal. Despite this, the asset remains below its key moving averages (MA50 at 2.115, MA100 at 2.252), meaning bulls have significant resistance ahead. Short-term price action is dominated by volume spread analysis (VSA) patterns, showing alternating waves of aggressive buying and selling. Is this the moment for buyers to step in, or will we see another leg down before any real recovery? With resistance sitting at $1.988 and $2.086, a breakout above these levels could ignite a rapid short squeeze. Time is ticking—will the market hold this level, or is another flush-out incoming? Stay tuned. MELANIAUSDT Roadmap: Tracing the Market's Footsteps Tracking the Market Moves: Key Confirmed Patterns The price action of MELANIAUSDT has been a rollercoaster, with alternating surges of buy and sell volume dictating the flow. Let’s break down the confirmed patterns that shaped the recent market landscape. Phase 1: The Build-Up – Buy Side Takes Control * January 27, 08:00 UTC – "Increased Buy Volumes" Direction: Buy Open: 2.358 | Close: 2.446 | High: 2.55 Buyers stepped in hard, pushing MELANIAUSDT to $2.55, signaling bullish momentum. This pattern held strong as price action followed through. * January 29, 19:00 UTC – "VSA Manipulation Buy Pattern 4th" Direction: Buy Open: 2.3 | Close: 2.309 | High: 2.349 The price maintained upward movement, proving the prior bullish pattern was valid. Phase 2: The Reversal – Sellers Take Charge * January 29, 18:00 UTC – "Increased Sell Volumes" Direction: Sell Open: 2.317 | Close: 2.3 | Low: 2.224 Despite an earlier bullish run, sellers regained momentum, pushing prices lower. * January 31, 15:00 UTC – "VSA Manipulation Sell Pattern 4th" Direction: Sell Open: 2.086 | Close: 2.105 | Low: 2.086 The sell-off gained further traction as the price failed to recover above key resistance levels. Phase 3: The Last Stand – Bullish Bounce Attempts * February 1, 00:00 UTC – "Increased Buy Volumes" Direction: Buy Open: 1.935 | Close: 1.936 | High: 2.021 Price briefly bounced, testing $2.021, but lacked follow-through strength. * February 1, 01:00 UTC – "Buy Volumes Takeover" Direction: Sell Open: 1.936 | Close: 1.921 | Low: 1.916 Buyers lost the battle, confirming further downside pressure. What’s Next? The current technicals suggest we are at a make-or-break point. MELANIAUSDT is hugging its absolute low at $1.865, with resistance lurking at $1.988 and $2.086. The market’s next move will likely depend on whether buyers can reclaim lost ground or if sellers continue to apply pressure. Stay sharp, watch for volume confirmation, and manage risk accordingly! Tracking the Market Moves: Key Confirmed Patterns The price action of MELANIAUSDT has been a rollercoaster, with alternating surges of buy and sell volume dictating the flow. Let’s break down the confirmed patterns that shaped the recent market landscape. Phase 1: The Build-Up – Buy Side Takes Control * January 27, 08:00 UTC – "Increased Buy Volumes" Direction: Buy Open: 2.358 | Close: 2.446 | High: 2.55 Buyers stepped in hard, pushing MELANIAUSDT to $2.55, signaling bullish momentum. This pattern held strong as price action followed through. * January 29, 19:00 UTC – "VSA Manipulation Buy Pattern 4th" Direction: Buy Open: 2.3 | Close: 2.309 | High: 2.349 The price maintained upward movement, proving the prior bullish pattern was valid. Phase 2: The Reversal – Sellers Take Charge * January 29, 18:00 UTC – "Increased Sell Volumes" Direction: Sell Open: 2.317 | Close: 2.3 | Low: 2.224 Despite an earlier bullish run, sellers regained momentum, pushing prices lower. * January 31, 15:00 UTC – "VSA Manipulation Sell Pattern 4th" Direction: Sell Open: 2.086 | Close: 2.105 | Low: 2.086 The sell-off gained further traction as the price failed to recover above key resistance levels. Phase 3: The Last Stand – Bullish Bounce Attempts * February 1, 00:00 UTC – "Increased Buy Volumes" Direction: Buy Open: 1.935 | Close: 1.936 | High: 2.021 Price briefly bounced, testing $2.021, but lacked follow-through strength. * February 1, 01:00 UTC – "Buy Volumes Takeover" Direction: Sell Open: 1.936 | Close: 1.921 | Low: 1.916 Buyers lost the battle, confirming further downside pressure. Technical & Price Action Analysis Key support and resistance levels define the battlefield for MELANIAUSDT. If these levels fail to hold, expect them to flip into resistance zones, making upside moves harder. Support Levels: * 1.863 (Critical last low, any break could mean fresh downside) Resistance Levels: * 1.988 (Immediate overhead resistance, must break for bullish momentum) * 2.086 (Key level, reclaiming it opens more upside room) * 3.306 (Far target, but if bulls wake up, it’s the next big hurdle) Stay sharp, watch for volume confirmation, and manage risk accordingly! The price action of MELANIAUSDT has been a rollercoaster, with alternating surges of buy and sell volume dictating the flow. Let’s break down the confirmed patterns that shaped the recent market landscape. Phase 1: The Build-Up – Buy Side Takes Control * January 27, 08:00 UTC – "Increased Buy Volumes" Direction: Buy Open: 2.358 | Close: 2.446 | High: 2.55 Buyers stepped in hard, pushing MELANIAUSDT to $2.55, signaling bullish momentum. This pattern held strong as price action followed through. * January 29, 19:00 UTC – "VSA Manipulation Buy Pattern 4th" Direction: Buy Open: 2.3 | Close: 2.309 | High: 2.349 The price maintained upward movement, proving the prior bullish pattern was valid. Phase 2: The Reversal – Sellers Take Charge * January 29, 18:00 UTC – "Increased Sell Volumes" Direction: Sell Open: 2.317 | Close: 2.3 | Low: 2.224 Despite an earlier bullish run, sellers regained momentum, pushing prices lower. * January 31, 15:00 UTC – "VSA Manipulation Sell Pattern 4th" Direction: Sell Open: 2.086 | Close: 2.105 | Low: 2.086 The sell-off gained further traction as the price failed to recover above key resistance levels. Phase 3: The Last Stand – Bullish Bounce Attempts * February 1, 00:00 UTC – "Increased Buy Volumes" Direction: Buy Open: 1.935 | Close: 1.936 | High: 2.021 Price briefly bounced, testing $2.021, but lacked follow-through strength. * February 1, 01:00 UTC – "Buy Volumes Takeover" Direction: Sell Open: 1.936 | Close: 1.921 | Low: 1.916 Buyers lost the battle, confirming further downside pressure. Technical & Price Action Analysis Key support and resistance levels define the battlefield for MELANIAUSDT. If these levels fail to hold, expect them to flip into resistance zones, making upside moves harder. Support Levels: * 1.863 (Critical last low, any break could mean fresh downside) Resistance Levels: * 1.988 (Immediate overhead resistance, must break for bullish momentum) * 2.086 (Key level, reclaiming it opens more upside room) * 3.306 (Far target, but if bulls wake up, it’s the next big hurdle) Trading Strategies Based on Rays The concept of Rays from the Beginning of Movement offers a unique perspective in technical analysis. These rays, built on Fibonacci and geometric principles, help define dynamic levels that guide price movement. Instead of static levels, rays adjust dynamically, ensuring a more adaptive trading approach. Optimistic Scenario: * If the price interacts with 1.863 and holds, the first target would be 1.988, the second 2.086, and the third 3.306. * Moving Averages confirmation above these levels can signal a continued bullish push. Pessimistic Scenario: * A breakdown below 1.863 flips it into resistance, opening the path to new lows. * Bearish confirmation via VSA rays and moving averages crossovers would solidify this outlook. Potential Trades: * Long Entry at 1.863: Targeting 1.988 with a stop below 1.850. * Breakout Trade above 2.086: Aiming for 3.306, stop-loss near 2.000. * Short at Resistance Rejection (1.988-2.086): Stop above the level, targeting previous support. Watch for interaction with rays before entering trades—these levels define the battleground where market players decide the next big move! If you have any questions, drop them in the comments! Let’s discuss potential setups, share insights, and improve our trading decisions together. 🚀 Don’t forget to Boost this idea, save it, and check back later to see how price respects the levels I’ve marked—because understanding reaction zones is everything in trading! My proprietary indicator automatically maps out all rays and levels, but it’s available only in Private Access. If you’re interested in using it, send me a message. I also provide custom technical analysis on any asset you need. Some analyses I share for free, while others can be private if you don’t want your setup made public. Let’s discuss your request! Rays work on all assets, and price moves accordingly. If you want a markup for a specific asset, make sure to Boost this post and write in the comments—I’ll do my best to cover it! Make sure to follow me on TradingView so you never miss a new analysis. All updates and ideas are posted here first! 📈🔥
brandlabelden
TRUMPUSDT – Ready for a Rebound or Further Decline?

Key Moment for TRUMPUSDT: Buy Signal or Last Warning? The market is at a crossroads, and TRUMPUSDT is no exception. Currently trading at $24.179, this asset has plummeted over 70% from its all-time high of $83.041, recorded just 13 days ago. Such a steep decline begs the question: is this the moment of capitulation, or the perfect time to buy the dip? Technicals indicate oversold conditions. RSI(14) at 30.9 signals that sellers may be exhausting their momentum, while MFI(60) at 38.1 suggests a potential inflow of smart money. However, the price remains below key moving averages (MA50 at $26.29, MA100 at $27.26, and MA200 at $28.47), meaning a breakout is needed to confirm a trend reversal. Recent patterns show a battle between bulls and bears. Yesterday's heavy selling pressure pushed the price near its key support at $21.08, but today’s increased buy volume hints at possible accumulation. Resistance stands firm at $26.09—a level that, if broken, could trigger a short squeeze toward higher targets. The market is offering a challenge: is this the bottom, or will we test lower levels before a major recovery? Will you seize the opportunity, or wait for confirmation? Roadmap: TRUMPUSDT – A Pattern-Based Guide to Market Moves 1. The Beginning of a Trend – The Sell-Off Cascade * 2025-01-27 15:00 UTC – VSA Manipulation Sell Pattern 2nd Main Direction: Sell The market signaled a significant downward shift as sellers took control. A confirmation of this bearish movement came shortly after, when price failed to hold support and started a cascade of lower highs. * 2025-01-27 16:00 UTC – VSA Manipulation Sell Pattern 1st Main Direction: Sell Confirmed the earlier trend as price continued declining, closing below its open and reinforcing downward pressure. This movement set the stage for an even sharper fall. * 2025-01-28 00:00 UTC – Increased Buy Volumes Main Direction: Buy Despite a temporary buy-in, price action in the following pattern suggested that this was a weak bounce. The asset managed to push upwards but failed to break out significantly, signaling an overall bearish trend remained dominant. * 2025-01-28 03:00 UTC – VSA Manipulation Sell Pattern 2nd Main Direction: Sell This sell-off confirmed the weakness of the previous buy attempt. The price declined further, aligning with the broader trend, proving that the sell signals were valid. 2. Bullish Recovery: The Market Fights Back * 2025-01-29 14:00 UTC – VSA Manipulation Buy Pattern 1st Main Direction: Buy This marked the first major attempt at a bullish reversal. The price started to climb, breaking through short-term resistance zones and attracting momentum traders looking for long positions. * 2025-01-29 19:00 UTC – Increased Sell Volumes Main Direction: Sell Despite bullish attempts, sellers made a strong comeback, leading to another test of support. However, this time, price action suggested exhaustion among sellers. * 2025-01-29 20:00 UTC – Sell Volumes Takeover Main Direction: Buy Contrary to its name, this pattern actually set up a bullish movement as buyers absorbed sell pressure and pushed prices higher, leading to a confirmation of a bullish trend. 3. The Confirmation Rally * 2025-01-30 05:00 UTC – VSA Manipulation Sell Pattern 3rd Main Direction: Sell A minor pullback tested the bullish momentum. However, the next sequence revealed that this sell pattern failed to hold, invalidating its significance in the broader market trend. * 2025-01-30 13:00 UTC – VSA Manipulation Buy Pattern 4th Main Direction: Buy The bulls took full control. A steady price increase confirmed the direction, marking this as a key turning point in the market. * 2025-01-30 20:00 UTC – VSA Buy Pattern Extra 1st Main Direction: Buy An explosive breakout followed, pushing price action toward a critical resistance level. This confirmed the accumulation phase was over, and a potential bullish continuation was on the horizon. 4. The Final Surge and Market Indecision * 2025-01-31 00:00 UTC – VSA Manipulation Buy Pattern 5th Main Direction: Buy This was the strongest bullish confirmation yet, as price rallied past key resistance levels and settled in an uptrend. * 2025-01-31 07:00 UTC – VSA Manipulation Sell Pattern 1st Main Direction: Sell This pattern hinted at a potential reversal, but the market held its ground, suggesting that bullish strength was still dominant. * 2025-01-31 09:00 UTC – VSA Manipulation Buy Pattern 3rd Main Direction: Buy Final confirmation of an ongoing rally. The price established a higher low, creating a structure that traders could use as a base for further upside moves. Conclusion: Where Does TRUMPUSDT Go Next? The roadmap reveals a key transition from a strong bearish phase to a confirmed bullish reversal. With increased buy volumes and multiple successful bullish confirmations, the asset is now poised to challenge resistance levels. However, traders must remain cautious, as future sell signals could indicate exhaustion and another retracement phase. Keep an eye on volume and price structure for further confirmation of the next move! Technical & Price Action Analysis Key Levels to Watch Support Levels: * 21.081 – If bulls can hold this zone, expect a bounce. If broken, it flips to resistance. Resistance Levels: * 26.095 – Major test level for bulls. A breakout here can fuel a rally. * 54.034 – Long-term resistance. If price reaches this zone, expect a reaction. What Happens If Levels Fail? If support zones don’t hold, they become resistance on the next rally attempt. Likewise, failed resistance levels can act as support if buyers step in. Stay sharp, trade smart, and respect the key levels! Technical & Price Action Analysis Key Levels to Watch Support Levels: * 21.081 – This is the key support zone where buyers need to step in. If the price holds, expect a bounce and a potential reversal. If this level fails, it flips into resistance, making future upward moves more challenging. Resistance Levels: * 26.095 – The first major hurdle for bulls. A confirmed breakout above this level could ignite a rally. However, if sellers defend this zone aggressively, expect a pullback. * 54.034 – Long-term resistance, and a psychological level where significant selling pressure is expected. If price reaches this area, expect strong reactions from both bulls and bears. Powerful Support Levels: * Currently, there are no confirmed powerful support zones. Bulls must establish strong buying interest to create a reliable foundation for future upside moves. Powerful Resistance Levels: * No powerful resistance levels have been validated yet. However, if price action struggles at key resistance zones, these areas could become strong walls of sell pressure. What Happens If Levels Fail? * If a support level fails to hold, it flips into resistance, meaning any bounce attempt is likely to face selling pressure at that same level. * Similarly, if resistance is breached but price fails to hold above, it can act as a trap for breakout traders, leading to a fakeout and a strong rejection. Price action will dictate the next moves—watch these levels closely and be ready to react accordingly. Stay sharp, trade smart, and respect the key levels! Concept of Rays: Trading Strategies Based on Fibonacci Rays Core Idea My proprietary method is built on Fibonacci-based rays that define dynamic support and resistance levels. These rays predict key zones where price action is most likely to react, either reversing or continuing its movement. The key is to wait for confirmation via interaction with these rays before making a trade decision. Why Specific Levels Can't Be Predicted Financial markets are nonlinear and driven by multiple factors—liquidity, market sentiment, and macroeconomic events. Instead of attempting to predict exact price points, this method identifies **high-probability reaction zones** where price action provides clues for trade entries. How the Rays Work * **Fibonacci Rays:** Each ray is mathematically aligned with the market’s natural rhythm, originating from the beginning of a move rather than extreme points. * **Adaptability:** When new price structures emerge, rays adjust dynamically, setting new interaction zones. * **Directional Guidance:** Ascending rays act as **support** in uptrends, while descending rays form **resistance** in downtrends. * **Moving Averages as Confirmation:** The intersection of Fibonacci rays with **MA50, MA100, and MA200** adds extra confluence for price reaction. Trading Scenarios Optimistic Scenario (Bullish Move): * If price interacts with an ascending ray near **21.081 (support)** and bounces with strong volume, this signals an entry for a long trade. * The **first target** is the next ray level near **26.095**, where partial profit can be taken. * If momentum continues, the **second target** is at **54.034**, a major resistance level. Pessimistic Scenario (Bearish Move): * If price fails to hold **21.081** and breaks below it, this level flips into resistance. * A short trade can be initiated with a **first target** at the next ray intersection. * If bearish momentum accelerates, **the next target would be determined by the descending ray channel.** Potential Trades Based on These Levels * **Long from 21.081 to 26.095** – Only after interaction with support and confirmation of strength. * **Short below 21.081** – If this level fails, look for a rejection and retest before entering. * **Momentum trade from 26.095 to 54.034** – If price clears 26.095 with volume, this becomes a strong continuation setup. All these setups work **in conjunction with the VSA rays**, which users can see on their charts. **Entries should only be considered after interaction with the rays and confirmation of the movement’s direction.** Price is expected to move from one ray to the next, making each level a structured target for trade execution. Let's Trade Smarter Together! Got questions? Drop them in the comments! I always read them and try to respond to as many as possible. Let’s discuss market movements, key levels, and strategies together—your insights and thoughts are just as valuable as mine. If you found this analysis useful, don’t forget to hit Boost and save this idea. Check back later to see how the price moves according to my markup—because understanding key reaction points is the real edge in trading. All my Fibonacci Rays and dynamic levels are automatically plotted using my private indicator. If you're interested in using it, feel free to message me directly for details. It’s available only in Private Access. Want an analysis of your favorite asset? I can do that! Some charts I publish for everyone, and some traders prefer a personal breakdown. Message me if you need something tailored—there’s always a way to work things out. Remember, these rays work across all assets, and price consistently respects them. If you want a custom markup for your asset, just Boost this post and drop a comment—I’ll do my best to include it in my next analysis. And finally, make sure to follow me on TradingView—this is where I post my best setups and ideas. Stay tuned for more insights, and let’s trade smart together!
brandlabelden
PNUTUSDT: Near Its Critical Pivot – Will the Market Make Its Mov

PNUTUSDT is sitting on the edge of a key threshold at $0.3188, just a breath away from its absolute low of $0.3044, set today. With an 87% plunge from its all-time high of $2.5084, the asset is signaling a potential turning point. RSI at 41.17 indicates a mildly oversold condition, setting the stage for either a rebound or a deeper dive. Recent patterns, including VSA Buy signals and volume surges, suggest that bullish energy might be brewing just under the surface. Yet, the heavy resistance levels above at $0.3668 and $0.4176 could act as significant tests for any upward momentum. With macroeconomic factors steady but market sentiment edgy, PNUTUSDT traders face the pressing question: is this the bottom, or could another leg down be imminent? This is a critical moment for both short-term traders eyeing quick reversals and long-term investors evaluating the larger picture. Will you seize the potential rebound or wait for clearer confirmation? Stay tuned – the next move could define the trend for weeks to come! PNUTUSDT Roadmap: Patterns That Defined the Price Action PNUTUSDT has been a rollercoaster for traders recently, with distinct patterns revealing the market’s intentions. Let’s dive into the key candle patterns and how they played out, separating the noise from actionable moves. 1. The "Increased Sell Volumes" Pattern (January 25, 2025) Direction: Sell Price opened at $0.3182 and closed at $0.3051. This bearish setup pushed the price near the asset's absolute low of $0.3044. The sell-off was decisive, as subsequent price action confirmed the direction with a continuation towards the $0.3044 low, validating the main direction of the pattern. 2. "VSA Buy Pattern Extra 1st" (January 24, 2025) Direction: Buy Opening at $0.3239, the price moved higher briefly but closed at $0.3182. While the main direction indicated a buy opportunity, the following sell-off undermined its potential, indicating this pattern failed to confirm its trigger. 3. "Increased Sell Volumes" (January 23, 2025) Direction: Sell Opening at $0.3561 and closing at $0.3527, the pattern confirmed its sell bias as the price dipped further in subsequent candles, aligning with the bearish sentiment. This gave traders an ideal short entry opportunity. 4. "Buy Volumes Takeover" (January 23, 2025) Direction: Buy Despite the bullish direction, this pattern struggled for validation as sell-side pressure dominated immediately afterward. This pattern underperformed, marking a skip in actionable moves. 5. "VSA Manipulation Buy Pattern 4th" (January 22, 2025) Direction: Buy This was the turning point. The price moved higher, confirming its trigger by closing above the previous resistance level and aligning with the predicted bullish move. Traders who caught this shift enjoyed a strong recovery rally. Key Takeaways from the Roadmap: * "Increased Sell Volumes" patterns have consistently delivered, highlighting a reliable bearish trigger. * "Buy Volumes Takeover" patterns often need clearer confirmation to provide actionable trades. * "VSA Manipulation Buy Patterns" showed strength in directional accuracy, offering robust opportunities when validated. This roadmap emphasizes how selective trading, focused on validated patterns, helps cut through the market's noise and capture meaningful moves. For traders, knowing when to act—and when to stay out—is the game changer. Technical & Price Action Analysis: Key Levels to Watch The PNUTUSDT market is heating up, and every trader knows that nailing the key levels can make or break your strategy. Here’s a breakdown of the most critical support and resistance zones on the radar right now. If these levels don’t hold, expect them to flip and act as barriers for price action—classic support-turns-resistance and vice versa. Support Levels First Support: $0.3044 — The absolute low and a key battleground. If buyers fail to defend this level, the bears might take full control. Second Support: $0.3668 — A short-term cushion for buyers to regroup. Losing this zone signals trouble for the bulls. Resistance Levels First Resistance: $0.3668 — If price fails to reclaim this level, it’ll act as a headwind for bullish momentum. Second Resistance: $0.4176 — A crucial ceiling for bulls. Breakout above could open doors to new highs. Third Resistance: $0.4513 — A make-or-break zone for major trend shifts. Fourth Resistance: $0.5165 — Only serious bullish strength can push past this level. Fifth Resistance: $0.6692 — The long-term target for any meaningful upside. Powerful Support Levels Critical Zone: $0.6521 — This level must hold if the bulls want to regain control of the narrative. If breached, expect a deeper pullback. Powerful Resistance Levels Currently Undefined — Keep an eye on momentum and price reaction at the aforementioned resistance zones. As always, respect these levels and watch for confirmations—breakouts need follow-through, and false moves can wreck your game. Trade smart, manage risk, and don’t chase—let the market come to you! Trading Strategies Using Fibonacci Rays Understanding the "Rays from the Beginning of Movement" concept allows traders to harness the natural dynamics of Fibonacci proportions and geometric levels. These rays provide a dynamic framework to identify key zones for price interactions, predicting possible reversals or continuations with precision. Let’s explore how to use these rays for your trading strategy. Concept of Rays Rays are constructed from the beginning of a movement pattern, providing dynamic levels that adapt as the market evolves. They rely on Fibonacci angles to establish critical zones where price interaction is likely to occur. Key insights include: * Price Interaction: Signals either reversal or continuation but requires confirmation from dynamic factors, such as patterns or volume shifts. * Adaptability: Rays adjust as new patterns emerge, creating a flexible approach to identifying key movement boundaries. * Complementary Analysis: Crossing points with moving averages (MA50, MA100, MA200, etc.) strengthen the significance of ray zones. Two Scenarios: Optimistic and Pessimistic Optimistic Scenario * Interaction with $0.3668 (Resistance Level): If price breaks this ray and confirms with volume and pattern, we could see a continuation to $0.4176 (next ray). * Interaction with MA100 at $0.3557: A confirmed close above this moving average signals a bullish trend with the potential to aim for $0.4513. * Final Target: $0.5165 as a long-term ray and Fibonacci convergence zone. Pessimistic Scenario * Failure at $0.3668 Resistance: Price interaction signals rejection and a probable pullback to $0.3044 (Support Level). * Interaction with MA200 at $0.4328: A failure to break above could lead to a deeper sell-off to retest $0.3044. * Break Below $0.3044: A move below this level indicates strong bearish momentum, with $0.6521 becoming the next significant resistance as the price reverses. Suggested Trades Trade 1: Buy Breakout at $0.3668 Target 1: $0.4176 Target 2: $0.4513 Comment: Wait for a confirmed breakout with volume above the ray. Trade 2: Short at Rejection Near $0.4176 Target 1: $0.3668 Target 2: $0.3044 Comment: Watch for bearish patterns or volume declines to confirm entry. Trade 3: Buy Near $0.3044 Support Zone Target 1: $0.3668 Target 2: $0.4176 Comment: Confirm with interaction at the ray and a bullish reversal pattern. Trade 4: Short After MA200 Failure at $0.4328 Target 1: $0.3668 Target 2: $0.3044 Comment: Momentum loss and price rejection confirm bearish continuation. Key Takeaway: Trade between rays like stepping stones, moving from one target to the next. Confirm entries after interaction with rays and dynamic factors like volume or MA crossings. Each ray represents not just a technical level but a gateway to the next movement zone. Use this framework to navigate the market with confidence and precision! Let’s Stay Connected and Trade Smarter Together! Got questions or thoughts about the analysis? Drop them in the comments below—I’m always happy to chat and help clarify anything! Your feedback and discussions are what keep this trading journey exciting and collaborative. If you found this idea useful, don’t forget to hit Boost and save it to track how the price moves along these mapped-out levels. Understanding the points where trades make sense is key to growing as a trader, so let’s watch the market evolve together. By the way, the rays and levels in this strategy are drawn automatically using my custom indicator—it’s available privately. If you’re interested in using it, feel free to message me directly for details. I also offer analysis on any asset you’d like, whether it’s a free post here or a personal, private breakdown for your unique ideas. The beauty of this strategy is its versatility—it works across all assets, and price always respects these dynamic rays. If you have a specific asset you’d like analyzed, hit Boost, leave a comment, and I’ll do my best to prioritize it. Make sure to follow me here on TradingView to stay updated with my latest ideas and strategies. This is where I post regularly, so don’t miss out on the tools and insights that can give your trading the edge it deserves. Let’s grow and trade together! 🚀
brandlabelden
FWOGUSDT: Approaching the Turning Point – What’s Next?

FWOGUSDT is trading at $0.12006, hovering just above its absolute low of $0.11783, established only hours ago. This marks a staggering -84.6% retreat from its absolute high of $0.78189, reached just 72 days prior. With RSI14 dipping to 29.42, the asset is entering oversold territory, raising the stakes for a potential reversal or a continuation of the bearish trend. A surge in sell volume, as confirmed by recent VSA patterns, highlights increasing market activity amidst uncertainty. The asset is also testing critical resistance at $0.13946 while struggling to break above the 50-day moving average of $0.15193, emphasizing the importance of this consolidation phase. Is the market setting the stage for a bullish rebound or bracing for deeper lows? With macroeconomic factors such as volatile liquidity conditions and heightened market sentiment, the next move could offer opportunities for both traders eyeing quick scalps and investors seeking long-term positioning. The big question remains: Are you ready to seize the moment, or will this opportunity pass you by? Stay tuned as we dive deeper into the technicals and strategies for this critical juncture. Roadmap: Tracing FWOGUSDT’s Path Through Pattern Dynamics FWOGUSDT has had a whirlwind of activity in recent trading sessions, as highlighted by a sequence of critical patterns. Below, we’ve broken down the roadmap of these patterns in order of their emergence, filtering only the ones that delivered accurate directional moves based on the previous pattern’s main direction. Pattern 1: Increased Sell Volumes (Jan 21, 18:00 UTC) The market initiated a significant sell wave, closing at $0.21192 after an open of $0.22732, marking a notable drop. The main direction was clearly bearish, and this pattern laid the groundwork for subsequent sell-offs. Pattern 2: Buy Volumes Takeover (Jan 23, 20:00 UTC) Despite a brief bullish attempt that pushed the price to a high of $0.16481, the market turned back to bearish territory, aligning with the previous sell-off. This confirms the direction set earlier, showing the strength of sellers. Pattern 3: VSA Buy Pattern Extra 1st (Jan 25, 00:00 UTC) Here, the market attempted a reversal, with a closing price of $0.12599 and a high of $0.13648. While buyers showed strength, the follow-through failed as the price closed lower in subsequent sessions. This indicates the struggle of bulls to reclaim control. Pattern 4: Increased Sell Volumes (Jan 25, 02:00 UTC) The most recent sell-off, aligning perfectly with the earlier bearish direction, confirms the dominance of sellers. With a low of $0.11783, FWOGUSDT reached its absolute bottom. This marks a critical juncture for traders. Key Takeaways The bearish trends dominated, with multiple sell patterns confirming the overall downtrend. Bullish patterns showed potential but failed to break critical resistance, indicating weak momentum. The most recent bearish breakout to $0.11783 highlights the market’s vulnerability at these levels. What’s Next? Investors and traders should watch for sustained price action at critical support zones. Will the bulls finally stage a comeback, or is more downside ahead? Follow the roadmap to stay in tune with the market's rhythm! Technical & Price Action Analysis: Key Support and Resistance Levels When it comes to navigating the FWOGUSDT price action, the key levels below are your bread and butter. Let’s break it down: Support Levels These zones are where buyers are likely to step in. If the market doesn’t respect these, expect them to flip into resistance faster than you can blink: $0.11783 – This is the absolute low. If broken, we’re diving into uncharted waters. $0.29444 – A strong psychological area to watch if prices stage a rally from current levels. Resistance Levels Here’s where sellers are holding their ground. Break these, and the bulls might just get the upper hand: $0.13946 – The first line of fire for any upward push. $0.19064 – A significant hurdle for medium-term bulls. $0.23757 – Beyond here, the market might just start cooking. $0.25695 – The final boss level for this structure. Powerful Support Levels These are your safety nets if the market wobbles. But if they give way, you’re looking at resistance zones in the making: $0.29444 – Not just a level, but a fortress for the bulls to defend. Powerful Resistance Levels While none were detected in this cycle, keep an eye on the levels above as potential magnets for price. Pro Tip: If these levels don’t play out, the market could be flipping the script, turning support into resistance or resistance into support. Keep your eyes peeled and trade smart! Trading Strategies Using Rays: Optimistic and Pessimistic Scenarios The "Rays from the Beginning of Movement" concept provides traders with dynamic levels derived from Fibonacci principles. These rays form a predictive framework, guiding price action from one ray to the next. Interactions between rays and moving averages (MAs) further confirm key market zones. Let’s dive into the strategy. Concept Overview Rays and Fibonacci: Rays are constructed at precise angles that correlate with the start of a trend. Dynamic Levels: The rays adjust to new patterns, providing an updated roadmap for price movement. Key Interaction Points: Trade entries are based on price reactions to rays, confirmed by interaction with MAs. Directional Flow: Price moves from one ray to the next, making each ray a potential trade target. Scenarios and Strategies Optimistic Scenario This assumes the price successfully interacts with a ray, confirming bullish momentum. Initial Entry Point: Interaction at support ray near $0.11783 (absolute low). First Target: $0.13946 (next ray and first resistance level). Second Target: $0.19064 (medium-term ray resistance). Confirmation Tools: Price above MA50 ($0.15193) signals upward momentum. Pessimistic Scenario In this scenario, the price interacts with a resistance ray and begins to reverse, confirming bearish sentiment. Initial Entry Point: Rejection at resistance ray near $0.13946. First Target: $0.11783 (absolute low and ray support). Second Target: $0.29444 (long-term powerful support zone, now acting as resistance). Confirmation Tools: Price below MA50 ($0.15193) reinforces a downward trend. Suggested Trades Bullish Trade Idea : Enter long at $0.11783 after confirmation of ray support and MA interaction. First target $0.13946, with stop-loss below $0.11700. Bearish Trade Idea : Enter short at $0.13946 upon rejection. First target $0.11783, with stop-loss above $0.14000. Scalp Trade Idea : Trade between $0.13946 and $0.19064 for quick profits within the ray structure, confirming movement via the MA50. Final Thoughts Dynamic rays and MAs act as a dual system for identifying actionable trades. Always enter after a confirmed interaction and let the price move between rays for optimal profit opportunities. Adapt to new ray formations and keep an eye on volume surges for added confirmation. This strategy offers precision for both cautious and aggressive traders. Your Feedback and Ideas Matter! Hey traders, thanks for taking the time to explore this analysis! If you’ve got questions or ideas, don’t hesitate—drop them in the comments. I love seeing your thoughts and will do my best to respond to everyone. If this idea resonates with you, hit Boost and save it to your favorites so you can revisit it later and track how the price moves along my levels. This is the cornerstone of successful trading—understanding the points where trades can be made with confidence. For those curious about my indicator-strategy, it automatically plots all the rays and levels, simplifying your analysis. While it’s available privately, feel free to DM me if you’re interested in using it—I’m happy to share details. Need a custom analysis for your favorite asset? Let me know in the comments! I’m open to doing some for free and posting them here, or working on something private if you’d prefer to keep your ideas exclusive. The rays work on any asset, and I can craft a personalized layout just for you. And of course, if you’d like to see more of my work, follow me here on TradingView. This is where I post all my articles and strategies, so don’t miss out! Trade smart, stay curious, and let’s keep the conversation going! 💬📊
brandlabelden
Will CVCUSDT Rebound or Continue to Decline?

Can the Bulls Revive Momentum, or Will the Bears Rule? With the current price of $0.14603, CVCUSDT has deviated nearly -54% from its all-time high of $0.31737, set back in March 2024. The market has been hovering in a zone of indecision, with its RSI at 52.7, signaling a neutral stance—neither overbought nor oversold. Recent patterns, such as the "VSA Buy Pattern Extra 1st," suggest potential upside, supported by the MA50 of $0.14429 acting as dynamic support. However, resistance looms at $0.15543, testing the resolve of buyers. Meanwhile, macroeconomic headwinds and a cooling momentum in MFI at 45.57 underscore a challenging road ahead. The question remains: Will the bulls manage to overcome resistance, or is this the setup for a further leg downward? In this pivotal moment, traders must assess whether the recent upward flickers signal a recovery or merely a pause in the ongoing decline. Stay tuned for further insights! Let me know if you'd like me to expand or adjust the tone. Roadmap of Recent Patterns: CVCUSDT’s Price Movements Decoded This roadmap dives deep into the chain of verified patterns shaping CVCUSDT’s recent price movements. Only the patterns with confirmed trigger points and validated main directions are included, ensuring we focus on actionable insights for traders. January 23, 21:00 UTC – Buy Volumes Takeover (Sell Direction) At this point, the price closed at $0.14092, signaling a potential sell-off. The next pattern confirmed this direction as the subsequent bars pushed the price down further, reaffirming the sell bias. January 24, 04:00 UTC – Increased Buy Volumes (Buy Direction) Here, the market showed a rebound with a close at $0.14366, above the key low of $0.14080. This directional shift was validated by the subsequent upward momentum, demonstrating the effectiveness of this buy setup. January 24, 06:00 UTC – VSA Sell Pattern 2 (Sell Direction) Price action confirmed this sell direction as the next few bars pushed the price downward, with a close at $0.14566, validating the pattern’s prediction. The previous buy trigger point around $0.14366 acted as temporary resistance. January 24, 13:00 UTC – VSA Sell Pattern 4 (Sell Direction) This was a textbook example of follow-through. The price closed lower at $0.14765, maintaining the bearish momentum. Trigger zones from earlier patterns remained untested as the market adhered to the bearish outlook. January 25, 00:00 UTC – VSA Buy Pattern Extra 1st (Buy Direction) Closing at $0.14281, this pattern marked a shift to bullish momentum. The price moved upward in the next sessions, confirming the buy direction and establishing support around the $0.14268 zone. January 25, 12:00 UTC – Current Status The most recent patterns suggest a tug-of-war between buyers and sellers, with $0.15543 resistance as the critical level to watch. Future confirmation of buy or sell zones will depend on whether the market respects the established supports and resistances. This sequence highlights a dynamic interplay between bullish and bearish setups, with actionable confirmation points aligning with broader market movements. Traders should remain vigilant, especially around the resistance zones, to capitalize on potential breakout opportunities. Technical & Price Action Analysis: Key Levels in Focus In this section, we break down the major support and resistance levels currently shaping CVCUSDT. These levels are not just markers—they’re the battlegrounds where buyers and sellers duke it out. If these levels don’t hold, they will flip roles and become strong resistance zones to watch for potential pullbacks. Support Levels 0.14009 – A critical level where buyers have stepped in before. If it doesn’t hold, expect it to act as resistance on the next push upward. 0.13301 – The last line of defense before the bears take full control. Resistance Levels 0.15543 – First big hurdle for the bulls. A clean break here could open the door to higher highs. 0.16423 – Momentum needs to stay strong to clear this zone. 0.17641 – A key level that could act as a magnet if momentum continues. 0.18664 – Breaking this will be a significant milestone for bulls, confirming mid-term strength. 0.18997 – The final major resistance before potential new highs. Watch for exhaustion here. Powerful Support Levels Currently absent—suggesting the market may lack the deep buyer conviction needed for a solid base. Powerful Resistance Levels 0.11096 – A fortress of resistance; if tested and rejected, it could send the price spiraling downward. 0.08804 – A distant, but highly significant, ceiling that could come into play in a bear-dominated market. These levels will define the next moves. Bulls need to lock and hold support levels, while bears are waiting for resistance to falter. Stay sharp—levels that break could flip roles and become the next hotspots for action. Concept of Rays: A Precise Framework for CVCUSDT Trading Strategies The "Rays from the Beginning of Movement" concept relies on Fibonacci-based principles to create dynamic levels that predict potential price movements. These rays adapt to new trends and corrective phases, offering a unique advantage in forecasting interaction zones. Combined with Moving Averages (MA) and VSA rays visible on the user’s chart, they provide actionable insights for both bullish and bearish scenarios. How Rays Work in Practice Fibonacci Rays : Built from the inception of a price movement, these rays define the potential movement boundaries and key zones of interaction. Dynamic Support and Resistance : Moving Averages such as MA50 ($0.14429), MA100 ($0.14601), and MA200 ($0.15353) act as dynamic factors, confirming trend direction and interaction points with the rays. Adaptive Levels : Rays adjust with new patterns, ensuring relevance even as trends evolve. Price movement from one ray to the next defines key trade targets. Entry Points : Enter trades only after price interaction with a ray and confirmation of a move’s direction. This reduces noise and increases precision. Trading Scenarios Optimistic Scenario In this scenario, bullish momentum dominates after price interacts with ascending rays and key Moving Averages. Entry: On a breakout above $0.14601 (MA100). First Target: $0.15543 (first ray-resistance interaction). Second Target: $0.16423 (next ray level). Third Target: $0.17641 (extension target). Rationale: Ascending rays combined with bullish MA crossovers indicate strength, and the price is likely to travel from one ray to the next before pausing. Pessimistic Scenario If bearish factors take over, the price is expected to interact with descending rays, forming resistance and initiating a move downward. Entry: On a breakdown below $0.14429 (MA50). First Target: $0.14009 (first ray-support interaction). Second Target: $0.13301 (deeper ray support). Third Target: $0.11096 (extension to powerful ray resistance). Rationale: Interaction with descending rays and Moving Averages confirms the bearish continuation, with prices likely moving systematically through descending ray levels. Proposed Trades Breakout Trade: Enter above $0.14601 with targets $0.15543, $0.16423, and $0.17641. Comment: Watch for a strong bullish MA cross and ray interaction for confirmation. Pullback Trade: Enter on rejection near $0.14429 with targets $0.14009 and $0.13301. Comment: Ensure interaction with descending rays to validate bearish momentum. Trend Continuation: Enter on sustained movement within ray boundaries, aiming for the next ray level in sequence. Comment: Use VSA and price-volume signals for additional confirmation. In both scenarios, patience and adherence to ray interactions are crucial. These dynamic zones act as guides, helping traders navigate from ray to ray with calculated precision. Let’s Keep the Conversation Going! Hey, traders! If you’ve got any questions or thoughts, drop them right in the comments—I’d love to hear from you. Whether it’s about this analysis or another asset you’d like to see marked up, I’m here to help. Your feedback and ideas keep the trading community sharp! If you found this roadmap useful, don’t forget to hit that Boost button and save this post. Come back later to see how the price respects the levels and rays in the markup. This isn’t just a forecast; it’s an opportunity to learn how key zones define trading opportunities. By the way, the rays and levels you see here are drawn automatically using my private indicator-strategy. If you’re interested in exploring it for your own trades, feel free to reach out via direct message—I’ll share the details on how it works. Need analysis for a specific asset? I’ve got you covered. Let me know in the comments or DMs. Some ideas I can publish publicly for everyone to benefit, and if you prefer a personal breakdown, we can arrange that too. Rays work on any asset, and I can tailor them to your needs. Make sure to follow me here on TradingView to stay updated. This is where I post all my articles, ideas, and insights to keep you ahead in the market. Let’s build better trades together!
brandlabelden
TROY/USDT: Is the Market Ready for a Turnaround?

Is This the Moment to Buy or Brace for More Drops? TROY/USDT has been caught in a whirlwind lately, hovering just above its absolute low of 0.001869, set only hours ago. With the current price at 0.001922, the asset has rebounded slightly, marking a modest 2.8% climb from its lowest point. However, it remains a staggering -76.8% below its absolute high of 0.008272, recorded just 23 days ago. Indicators reveal a mixed picture. The RSI14 currently sits at 33.6, signaling that the market is creeping out of oversold territory, while the MFI60 of 42.8 suggests there’s still room for increased buying pressure. Price action shows a series of sell-off patterns dominating recent sessions, including the "Increased Sell Volumes" pattern. This has left traders questioning whether the bottom is truly in. Fascinatingly, some buy patterns like the "VSA Buy Pattern Extra 1st" hint at latent bullish energy. Could this signal the market's readiness to pivot upward? With moving averages such as the MA50 at 0.002069 and MA200 at 0.002331, TROY must first break key resistance at 0.001962 to build momentum. This begs the critical question: Is this the calm before a reversal, or will bearish dominance drive new lows? Stay tuned as we monitor whether bulls will step up to reclaim the narrative or if the sell-side momentum will drive prices to fresh lows. Let's trade smart and capitalize on these crucial levels! Roadmap: TROY/USDT – Pattern Playbook for Recent Action Step 1: Increased Sell Volumes – The Downward Warning (2025-01-25 00:00 UTC) The roadmap begins with the “Increased Sell Volumes” pattern, signaling a clear sell direction. Price opened at 0.00196 and closed at 0.00187, firmly validating the bearish momentum. As expected, the low of this pattern (0.00187) was maintained in the subsequent pattern, confirming that sellers held control. The absence of an upward trigger point confirms this as a pivotal moment for short-term bears. Step 2: VSA Buy Pattern Extra 1st – The Bullish Rebound That Could (2025-01-25 00:00 UTC) This pattern introduced a buy signal, hinting at potential recovery. The price low remained stable at 0.00187, while the high saw no meaningful breakthrough at 0.00196, capping bullish aspirations. Unfortunately, the lack of follow-through in subsequent patterns suggests this was a false dawn, making it skippable from active considerations. Step 3: Buy Volumes Takeover – The Bullish Crossroad (2025-01-23 21:00 UTC) Following a sharp drop, the “Buy Volumes Takeover” pattern flagged a shift to buy momentum, with a promising move from 0.002061 to 0.002024. The upward confirmation in subsequent patterns reinforced this bullish shift. Importantly, this pattern laid the groundwork for further upward tests, earning its place in the roadmap. Step 4: VSA Manipulation Buy – The Critical Test (2025-01-20 13:00 UTC) The market shifted gears with the introduction of this pivotal buy pattern. Starting at 0.002103, prices climbed to 0.002125, supported by a solid trigger at the low of 0.002082. This pattern was pivotal in defining the bullish breakout zone and remained validated by subsequent upward movement. It served as a major opportunity for long positions. Step 5: Sell Volumes Max – A Bearish Comeback (2025-01-20 00:00 UTC) As bulls attempted to solidify control, bears struck back with the “Sell Volumes Max” pattern. From an open at 0.002171, the price dropped to 0.002055, resetting market sentiment. The failure of subsequent patterns to breach higher highs validated the bearish dominance of this move. Key Observations and Lessons for Traders * Trigger Points Matter: Successful patterns consistently respected their trigger levels, while failed patterns often lacked proper follow-through. * Main Direction Clarity: Each validated pattern aligned its main direction with subsequent price action, demonstrating the value of sticking to technical confirmations. * Context Is King: Patterns alone don’t guarantee success; interpreting them in context with recent highs, lows, and market sentiment was crucial. Final Word This roadmap serves as your cheat sheet for understanding TROY/USDT’s latest moves. By focusing on trigger points and validated patterns, traders can ride the waves with confidence. Stay sharp, keep your levels tight, and let the patterns guide the way! Technical & Price Action Analysis: Key Levels to Watch Here’s the rundown of crucial support and resistance levels for TROY/USDT. Keep these in your toolkit – they’re your roadmap for potential moves. But remember, if these levels fail to hold, they’ll likely flip into resistance zones on the next test. Support Levels 0.001922 – The current price level, sitting just above the absolute low. A failure here could spell deeper trouble for the bulls. 0.00187 – The all-time low. A make-or-break zone. If this cracks, expect bearish momentum to accelerate. Resistance Levels 0.001962 – Immediate resistance. If the bulls can’t take this out, sellers might regain the upper hand quickly. 0.002155 – A mid-range level that could be the next test if the momentum builds. 0.002437 – Higher up, this zone would signal a shift toward more bullish control if broken. 0.002568 – Another step up, but it won’t come easy without a strong catalyst. 0.00283 – The top barrier, marking a significant psychological and structural resistance. Powerful Support Levels None identified – This underscores the fragility of the current price range. With no powerful support below, caution is key. Powerful Resistance Levels None identified – Resistance levels outlined above will be your focus for now. If these levels don’t hold or break decisively, expect swift flips. As traders like to say: "Support turns resistance, and resistance becomes the ceiling that bulls have to punch through." Stay nimble, and watch the price action closely around these hotspots! Concept of Rays: Precision Trading Strategies Based on Fibonacci Dynamics The "Rays from the Beginning of Movement" concept brings a systematic, Fibonacci-based approach to analyzing price action. These dynamic levels are designed to capture the probabilities of price interaction, signaling either a reversal or continuation. Let’s dive into how traders can use these rays to enhance their strategies and target opportunities. How Rays Work * Dynamic Fibonacci Rays: Each ray stems from the beginning of a price movement, representing natural angles of inclination. * Dynamic Adjustments: Rays adapt to new patterns, showing updated movement ranges and potential pivot points. * Interaction with Moving Averages: Combining rays with key moving averages (e.g., MA50, MA200) amplifies the precision of identifying trade opportunities. These rays create zones of interaction, and once price moves beyond one ray, it often travels to the next, providing clear, actionable targets. Optimistic Scenario: Bulls Step In Price interacts with a Fibonacci ray and begins an upward movement, targeting the next levels. Supported by interaction with MA50 and MA200, the following trades are viable: Entry: At 0.001962, after interaction with the lower Fibonacci ray. First Target: 0.002155, aligning with the next ray and immediate resistance. Second Target: 0.002437, mid-term resistance signaling continued bullish strength. Third Target: 0.002568, testing a higher Fibonacci ray. Pessimistic Scenario: Bears Take Charge If price breaks below critical support levels and interacts with descending Fibonacci rays, the movement may extend lower: Entry: At 0.001922, after failing to hold above the lower ray. First Target: 0.00187, retesting the all-time low and Fibonacci support zone. Second Target: Possible extension lower if volume increases, signaling continued bearish dominance. Suggested Trades Based on Fibonacci Rays * Long from 0.001962 to 0.002155: Ideal for bulls looking for quick gains on ray interaction with MA50. * Short from 0.001922 to 0.00187: A straightforward bear trade targeting key support. * Long from 0.002155 to 0.002437: For breakout traders, leveraging momentum into the next ray zone. * Short from 0.002437 back to 0.002155: Profit-taking opportunity for mean-reversion strategies if momentum stalls. These trades follow the principle that movement will continue between rays, with each level providing clear targets and decision points. As always, price action and volume at these key zones should confirm entries and exits. This systematic approach ensures traders are aligned with the dynamic nature of the market, using Fibonacci rays and moving averages to guide precise entries and exits. Let the rays light your path to smarter trades! Call to Action: Let’s Trade Smarter Together! Traders, your thoughts and questions are always welcome—drop them right in the comments below! Whether it’s feedback on this analysis or an idea you’d like to explore further, I’m here to connect and discuss. If you found this post helpful, don’t forget to Boost it and save it to track how the price plays out according to my markup. Watching levels in action is the key to mastering entry and exit strategies. By the way, the rays and levels you see here are automatically plotted by my proprietary indicator-strategy. It’s available privately, so if you’d like access, feel free to reach out via direct message. Let’s talk about how it could work for you! Have a specific asset in mind for analysis? I’m happy to create markups tailored to your needs. Some ideas I can share here for free, while others can be done privately if you prefer to keep them exclusive. Just let me know in the comments what you’re looking for, and I’ll see how I can help. Rays work universally across all assets—crypto, stocks, forex, you name it. If there’s something you’d like me to map out, give this post a Boost and let me know in the comments. Lastly, don’t miss out—follow me here on TradingView to stay updated on all my analyses and strategies. Together, we can navigate the market with confidence. Let’s trade safe and smart! 🚀
سلب مسئولیت
هر محتوا و مطالب مندرج در سایت و کانالهای رسمی ارتباطی سهمتو، جمعبندی نظرات و تحلیلهای شخصی و غیر تعهد آور بوده و هیچگونه توصیهای مبنی بر خرید، فروش، ورود و یا خروج از بازارهای مالی نمی باشد. همچنین کلیه اخبار و تحلیلهای مندرج در سایت و کانالها، صرفا بازنشر اطلاعات از منابع رسمی و غیر رسمی داخلی و خارجی است و بدیهی است استفاده کنندگان محتوای مذکور، مسئول پیگیری و حصول اطمینان از اصالت و درستی مطالب هستند. از این رو ضمن سلب مسئولیت اعلام میدارد مسئولیت هرنوع تصمیم گیری و اقدام و سود و زیان احتمالی در بازار سرمایه و ارز دیجیتال، با شخص معامله گر است.