
bL1TZZ
@t_bL1TZZ

تریدر چه نمادی را توصیه به خرید کرده؟
سابقه خرید
تخمین بازدهی ماه به ماه تریدر
پیام های تریدر
فیلتر
نوع پیام
bL1TZZ
A Spring Or Final Test Of Supply Before Markup? Bulls Load Up.

$ binance: mdxusdt 98 ٪ از اوج خود را اصلاح کرده است. این تظاهرات صعودی BTC را دنبال نکرده است و در حال حاضر در نزدیکی یک منطقه تقاضای شدید قرار دارد. اگر بخواهیم شماتیک انباشت Wykoff را دنبال کنیم ، می توانیم وارد فاز C شویم. فاز A با پشتیبانی مقدماتی / فروش اوج قبل از واکنش 320 ٪ خودکار آغاز شد. این تجمع قوی منطقه مقاومت ما را بالاتر از آنچه دوست داشتم تحت فشار قرار داد. چندین ST سپس پس از SC که به مرحله A پایان یافت ، رخ داد. فاز B همچنین دارای چندین ST بود ، اما قیمت هرگز به سطح مقاومت AR نرسید. یک "بهار" به طور معمول در زیر منطقه پشتیبانی TR کوتاه می شود ، با این حال ، این به این دلیل نبود که گاوها با 5.5 سنت قدم برداشتند ، همان پایین ساخته شده در فاز B ST (تست ثانویه). ما می توانیم انتظار داشته باشیم که بعد از یک بهار (تله نهایی/تله خرس) یا آخرین نقطه پشتیبانی بدون خرابی انتظار داشته باشیم. حتی می توانید استدلال کنید که بهار قبلاً رخ داده است و این آزمایش عرضه باقی مانده است. هر چیزی ممکن است تست - اپراتورهای بزرگ همیشه بازار عرضه را در طول یک TR (به عنوان مثال ، STS و چشمه) و در نقاط کلیدی در طی پیشبرد قیمت آزمایش می کنند. اگر عرضه قابل توجهی در یک آزمون ظاهر شود ، بازار اغلب آماده مشخص شدن نیست. دلایل مختلفی وجود دارد که صعودی باشد که شامل- 8 نوسان ساز به تازگی واگرایی را با یک چکش صعودی چاپ کرده اند تا اقدامات را آغاز کنند. RSI همچنان به پایین آمدن و اوج های بالاتر ادامه می دهد. مشخصات حجم عظیم در نزدیکی پایین محدوده معاملاتی ظاهر می شود که به سرعت در حال افزایش است. 10D/هفتگی صعودی تصادفی در نزدیکی سطح Oversold. قیمت در حال حاضر بالاتر از هفتگی 10/21 روز SMA در حالی که نزدیک به یک صلیب اول است. در روز 2 روز ، اینچ 50 + 200 SMA به اولین صلیب طلایی نزدیکتر است. گاوها برای نگه داشتن منطقه پشتیبانی 5.5 درصد-6 درصدی ، عزم خوبی را نشان داده اند. آیا قیمت می تواند بیشتر کاهش یابد؟ مطمئناً داشتن یک استراتژی مهم است. خرس ها برای بی اعتبار کردن این ایده نیاز به یک استراحت با حجم قوی دارند. یک فروش شدید در بازار نیز می تواند به گاوها فشار بیاورد. فاز C چیست؟ در فاز C است که قیمت سهام از طریق آزمایش تعیین کننده عرضه باقیمانده طی می شود و به اپراتورهای "پول هوشمند" اجازه می دهد تا مشخص کنند که آیا سهام آماده است تا مشخص شود. چشمه یک حرکت قیمت زیر سطح پشتیبانی TR (در مراحل A و B) ایجاد شده است که به سرعت معکوس می شود و به TR باز می گردد. این نمونه ای از تله خرس است زیرا به نظر می رسد که قطره زیر پشتیبانی از سرگیری روند نزولی نشان می دهد. با این حال ، در واقعیت ، این نشانگر آغاز یک صعود جدید است و فروشندگان فقید (خرس ها) را به دام می اندازد. در روش Wyckoff ، یک آزمایش موفقیت آمیز از عرضه که توسط یک بهار (یا یک لرزش) ارائه می شود ، فرصتی برای تجارت با قابلیت بالا را فراهم می کند. یک چشمه با حجم کم (یا یک تست کم حجم از لرزش) نشان می دهد که سهام احتمالاً آماده حرکت است ، بنابراین این زمان خوبی برای شروع حداقل یک موقعیت طولانی جزئی است. Mdex (MDX) چیست؟ Mdex یک مبادله غیر متمرکز در بازار ساخت و بر اساس مفهوم استخرهای صندوق است. Mdex یک مدل DEX دو زنجیره ای را بر اساس زنجیره HECO و Ethereum پیشنهاد و پیاده سازی می کند. Mdex مزایای کم هزینه معاملات زنجیره HECO و رونق اکوسیستم Ethereum را ترکیب می کند. با استفاده از MDEX ، کاربران همچنین می توانند در مکانیسم استخراج دوگانه استخراج نقدینگی و معدن تجارت شرکت کنند. Mdex متعهد به ساختن بزرگترین سکوی Defi با ادغام DEX ، IMO و DAO در HECO و Ethereum است. کلاه فعلی بازار - 70 متر. تأمین گردش خون - 950.25 متر تنظیم سوداگرانه ، Dyor + DD. موفق باشید! 1 هفته نوسان ساز
bL1TZZ
Chainlink - Did We Just Witness Wykoff Accumulation?

To all my fellow traders, speculators and gamblers, its been some time since my last post. I hope you've all been well, and most importantly, bathing in huge profits :) It seems like Chainlink followed textbook Wykoff Accumulation Schematics. Not the most perfect schematics, notably PS ( Prelim Support) falling a little short of the soon to be Resistance Lines. In addition, BU only touched the resistance turned support once before rocketing up. However the first PS does line up with the BU and subsequent SOS (Show Of Strength) Phase A includes a number of additional ST ( Secondary Test) which is common after the SC (Selling Climax) stage. The selling Climax should've marked the lowest point, but price action made a lower low after the AR (Auto Rally) But it was merely a 19c difference. Price still stayed within the TR(Trading Range) and bounced from the support lines. The AR also marked the highest point within the trading range. These are all minor discrepancies as price action continued to follow Wykoff theory. We had multiple touches of the Support / Resistance lines, along with a perfect Spring (Final Shakeout/Bear Trap), Test and LPS, followed by a BU + SOS. It took approximately 533 days from the SC (Selling Climax) to the TR (Trading Range) breakout, The longer the accumulation period, the stronger the "Spring". Does this mean price will continue north? Not necessarily, we've all seen these schematics fail. After all, Chainlink is up over 305% since the $4.65 Spring/Shakeout/Bear Trap lows. That would've made an awesome long entry. However, price is still way below its $53 ATH, so anything is possible. Having a quick look we could see that price is currently at resistance levels. A break from the 19$ range could initiate further upside. Like the majority of the market, the crypto king (BTC) will probably dictate Chainlinks next move. If we are to follow Wykoff theory, we could expect further upside. I made a post back in May 22' private post titled "Link... Whales have been accumulating" I remember reading many articles at the time that stated big players were buying up Chainlink. Price action also found support at various Fibonacci levels, in addition to strong buy signals. RSI Levels were at record lows, in addition to a whopping 90% correction at the time. Unfortunately, I never got around to publishing that idea, it would've made a fantastic post. I am no expert on Wykoff theory, so I've included information taken from various online sources. Hopefully it helps, Much love and lots of profits to you all. What is Wyckoff Accumulation? Each cycle in the market begins with accumulation. This phase is marked by a range trend, where the market is relatively stable and rangebound. During this phase, institutional investors buy the stock at lower prices. Also, the volume tends to decline in this phase because the buying interest gradually absorbs the selling pressure. Another way to confirm accumulation is to look at the support level. You may notice higher lows, indicating that the buyers are gaining power. Slowly, the trading volume begins to rise. This is a key indicator of the shift in sentiment and suggests a breakout trend. As the accumulation progresses, you may see signs of strength in the price action, where the asset breaks above the trading range’s upper boundary. This breakout often indicates that the market is ready for an upward move. During the Wyckoff Accumulation process, smart money builds substantial positions at favourable prices before the broader market realizes the potential for an upward move. The accumulation may resemble a “compressed spring” on the chart. The longer it is, the better the indication of a breakout. Markup: The second phase of accumulation is the markup, which follows a breakout. According to Wyckoff, traders should find entry points through the pullback zones in this phase. Wyckoff Events PS— Preliminary Support , where substantial buying begins to provide pronounced support after a prolonged down-move. Volume increases and price spread widens, signalling that the down-move may be approaching its end. SC— Selling Climax, the point at which widening spread and selling pressure usually climaxes and heavy or panicky selling by the public is being absorbed by larger professional interests at or near a bottom. Often price will close well off the low in a SC, reflecting the buying by these large interests. AR— Automatic Rally , which occurs because intense selling pressure has greatly diminished. A wave of buying easily pushes prices up; this is further fueled by short covering. The high of this rally will help define the upper boundary of an accumulation TR. ST— Secondary Test , in which price revisits the area of the SC to test the supply/demand balance at these levels. If a bottom is to be confirmed, volume and price spread should be significantly diminished as the market approaches support in the area of the SC. It is common to have multiple STs after a SC. Springs or shakeouts usually occur late within a TR and allow the stock’s dominant players to make a definitive test of available supply before a markup campaign unfolds. A “spring” takes price below the low of the TR and then reverses to close within the TR; this action allows large interests to mislead the public about the future trend direction and to acquire additional shares at bargain prices. A terminal shakeout at the end of an accumulation TR is like a spring on steroids. Shakeouts may also occur once a price advance has started, with rapid downward movement intended to induce retail traders and investors in long positions to sell their shares to large operators. Test — Large operators always test the market for supply throughout a TR (e.g., STs and springs) and at key points during a price advance. If considerable supply emerges on a test, the market is often not ready to be marked up. A spring is often followed by one or more tests; a successful test (indicating that further price increases will follow) typically makes a higher low on lesser volume. SOS — Sign Of Strength , a price advance on increasing spread and relatively higher volume. Often a SOS takes place after a spring, validating the analyst’s interpretation of that prior action. LPS—Last Point of Support , the low point of a reaction or pullback after a SOS. Backing up to an LPS means a pullback to support that was formerly resistance, on diminished spread and volume. On some charts, there may be more than one LPS, despite the ostensibly singular precision of this term. BU—“Back-Up” . This term is short-hand for a colourful metaphor coined by Robert Evans, one of the leading teachers of the Wyckoff method from the 1930s to the 1960s. Evans analogized the SOS to a “jump across the creek” of price resistance, and the “back up to the creek” represented both short-term profit-taking and a test for additional supply around the area of resistance. A back-up is a common structural element preceding a more substantial price mark-up, and can take on a variety of forms, including a simple pullback or a new TR at a higher level. Each Phase Explained. Phase A: Phase A marks the stopping of the prior downtrend. Up to this point, supply has been dominant. The approaching diminution of supply is evidenced in preliminary support (PS) and a selling climax (SC). These events are often very obvious on bar charts, where widening spread and heavy volume depict the transfer of huge numbers of shares from the public to large professional interests. Once these intense selling pressures have been relieved, an automatic rally (AR), consisting of both institutional demand for shares as well as short-covering, typically ensues. A successful secondary test (ST) in the area of the SC will show less selling than previously and a narrowing of spread and decreased volume, generally stopping at or above the same price level as the SC. If the ST goes lower than that of the SC, one can anticipate either new lows or prolonged consolidation. The lows of the SC and the ST and the high of the AR set the boundaries of the TR. Horizontal lines may be drawn to help focus attention on market behaviour. Sometimes the downtrend may end less dramatically, without climactic price and volume action. In general, however, it is preferable to see the PS, SC, AR and ST, as these provide not only a more distinct charting landscape but a clear indication that large operators have definitively initiated accumulation. In a re-accumulation TR (which occurs during a longer-term uptrend), the points representing PS, SC and ST are not evident in Phase A. Rather, in such cases, Phase A resembles that more typically seen in distribution (see below). Phases B-E generally have a shorter duration and smaller amplitude than, but are ultimately similar to, those in the primary accumulation base. Phase B: In Wyckoffian analysis, Phase B serves the function of “building a cause” for a new uptrend (see Wyckoff Law #2 – “Cause and Effect”). In Phase B, institutions and large professional interests are accumulating relatively low-priced inventory in anticipation of the next markup. The process of institutional accumulation may take a long time (sometimes a year or more) and involves purchasing shares at lower prices and checking advances in price with short sales. There are usually multiple STs during Phase B, as well as upthrust-type actions at the upper end of the TR. Overall, the large interests are net buyers of shares as the TR evolves, with the goal of acquiring as much of the remaining floating supply as possible. Institutional buying and selling imparts the characteristic up-and-down price action of the trading range. Early on in Phase B, the price swings tend to be wide and accompanied by high volume. As the professionals absorb the supply, however, the volume on downswings within the TR tends to diminish. When it appears that supply is likely to have been exhausted, the stock is ready for Phase C. Phase C: It is in Phase C that the stock price goes through a decisive test of the remaining supply, allowing the “smart money” operators to ascertain whether the stock is ready to be marked up. As noted above, a spring is a price move below the support level of the TR (established in Phases A and B) that quickly reverses and moves back into the TR. It is an example of a bear trap because the drop below support appears to signal resumption of the downtrend. In reality, though, this marks the beginning of a new uptrend, trapping the late sellers (bears). In Wyckoff's method, a successful test of supply represented by a spring (or a shakeout) provides a high-probability trading opportunity. A low-volume spring (or a low-volume test of a shakeout) indicates that the stock is likely to be ready to move up, so this is a good time to initiate at least a partial long position. The appearance of a SOS shortly after a spring or shakeout validates the analysis. As noted in Accumulation Schematic #2, however, the testing of supply can occur higher up in the TR without a spring or shakeout; when this occurs, the identification of Phase C can be challenging. Phase D: If we are correct in our analysis, what should follow is the consistent dominance of demand over supply. This is evidenced by a pattern of advances (SOSs) on widening price spreads and increasing volume, as well as reactions (LPSs) on smaller spreads and diminished volumes. During Phase D, the price will move at least to the top of the TR. LPSs in this phase are generally excellent places to initiate or add to profitable long positions. Phase E: In Phase E, the stock leaves the TR, demand is in full control and the markup is obvious to everyone. Setbacks, such as shakeouts and more typical reactions, are usually short-lived. New, higher-level TRs comprising both profit-taking and acquisition of additional shares (“re-accumulation”) by large operators can occur at any point in Phase E. These TRs are sometimes called “stepping stones” on the way to even higher price targets. Who Was Richard Wykoff? Richard Demille Wyckoff (1873–1934) was an early 20th-century pioneer in the technical approach to studying the stock market. He is considered one of the five “titans” of technical analysis, along with Dow, Gann, Elliott, and Merrill. At age 15, he worked as a stock runner for a New York brokerage. Afterward, while still in his 20s, he became the head of his firm. He also founded and, for nearly two decades, wrote and edited The Magazine of Wall Street, which, at one point, had more than 200,000 subscribers. Wyckoff was an avid student of the markets, as well as an active tape reader and trader. He observed the market activities and campaigns of the legendary stock operators of his time, including JP Morgan and Jesse Livermore. From his observations and interviews with those big-time traders, Wyckoff codified the best practices of Livermore and others into laws, principles, and techniques of trading methodology, money management, and mental discipline. Mr. Wyckoff observed numerous retail investors being repeatedly fleeced. Consequently, he dedicated himself to instructing the public about “the real rules of the game” as played by the large interests, or “smart money.” In the 1930s, he founded a school that would later become the Stock Market Institute. The school's central offering was a course that integrated the concepts that Wyckoff had learned about identifying large operators' accumulation and distribution of stock with how to take positions in harmony with these big players. His time-tested insights are as valid today as they were when first articulated. Speculative Setup, DYOR.
bL1TZZ
The Crypto Commander-In-Chief & The Fibonacci Golden Pocket.

نه ، این یک "ایده کوتاه" نیست ، بلکه یک نگاه @ در بالای بازار قبلی و اصلاحات بعدی است. 2013 - در ماه نوامبر BTC در حدود 1،163 دلار در صدر قرار دارد. اگر شما به اندازه کافی خوش شانس باشید که Bitty @ 2 دلار فقط چند سال قبل خریداری کنید ، بازده 50،000 ٪ عالی است. سپس قیمت یک ٪ ٪ 86.7 و پایین @ سطح Fibonacci 0.618 را تصحیح می کند ، یک دوره تجمع 2 ساله آغاز می شود. برای پیدا کردن قسمت پایین ، در کل 406 روز طول کشید ، و دقیقاً 1064 روز (35 ماه) از آن پایین تا سال 2017. 2017 - با تشکر از Bitfinex و Co ، King King در دسامبر 2017 @ با علامت 20K ، تصحیح 85 ٪ به دنبال و پایین قیمت @ 0.615 Fibonacci است. یک پرش 12850 ٪ عالی از پایین 2015 155 دلار. تقریباً 364 روز طول کشید تا BTC برای پیدا کردن پایین و با طعنه آمیز ، 1071 روز قبل از تمام مدت زمان بالا- فقط یک هفته اختلاف یک هفته از دوره کم تا بالا و بالا. 2021 - BTC همه زمان های جدید 69000 دلار را بالا می برد ، یک افزایش واقعاً دیدنی. فکر کردن که این یک بار 0.01 سنت بود ، ذهنیت ذهن است. با افزایش 2450 درصد از پایین ترین میزان 2018 در حدود 3،100 دلار افزایش یافته است. با این حال 74 ٪ در حال حاضر از قیمت خود از بین رفته است. این همچنین اولین بار است که BTC پایین تر از زمان قبلی است. قیمت هنوز در حدود 0.382 سطح فیبوناچی در صورت عدم موفقیت ، بازدید از 0.5 فیبوناچی روی کارت ها است ، همچنین با رالی شکست خورده که منجر به بالا رفتن 2019 شد ، مطابقت دارد. اگر BTC تصحیح 84 ٪ مشابهی را که در گذشته انجام داده است ، یک بار دیگر بازدید می کند ، جیب طلایی مشهور فیبوناچی. جیب طلایی مشخصات حجم عظیمی دارد ، من شک ندارم که گاوهای بلند مدت به دنبال خرید از آنجا هستند (به شرط اینکه حتی به آنجا برسد) نکته دیگری که باید به آن توجه داشت این است که ، تقریباً یک دوره 4 ساله بین بالای بازار وجود دارد. در حقیقت ، مدت زمان بین برتر 2013 و برتر 2017 1470 روز (48.32 ماه) بود ، تنها 35 روز از دوره 2017-2021 بالا تا بالا 1435 روز (47.17 ماه) جدا شد. باید BTC یک چرخه مشابه را دنبال کند ، که به طور بالقوه می تواند به معنای جدید در تمام زمان در اکتبر 2025 باشد. BTC حتی می تواند از اینجا موشک کند ، که می داند ، فقط زمان گفت. انباشت ، علامت گذاری ، توزیع و تکرار ، قرن ها اتفاق می افتد. تعصب من بدون تغییر باقی می ماند ، تمام ایده های ارسال شده من طولانی است و برای سرمایه گذاران بلند مدت مناسب است. کابوی های ثروتمند ثروتمند بیشتر شبیه قماربازان هستند ، نه سرمایه گذاران. من معتقدم که این زمان جمع شدن است. میانگین هزینه دلار در پروژه های مورد علاقه شما مطمئناً در حال حاضر جذاب تر از یک سال پیش است. بسیاری از سکه ها به صفر می روند ، حدود 10x-00x مه. داشتن یک استراتژی مهم است. با احتیاط خود انجام دهید. بعد از همه - "بازار وسیله ای برای انتقال پول از بی تاب به بیمار است." - وارن بافت. امیدوارم این به سرمایه گذاران ، معامله گران و قماربازم کمک کند. موفق باشید! تنظیم سوداگرانه ، دیور.
bL1TZZ
META- Undervalued & Oversold.
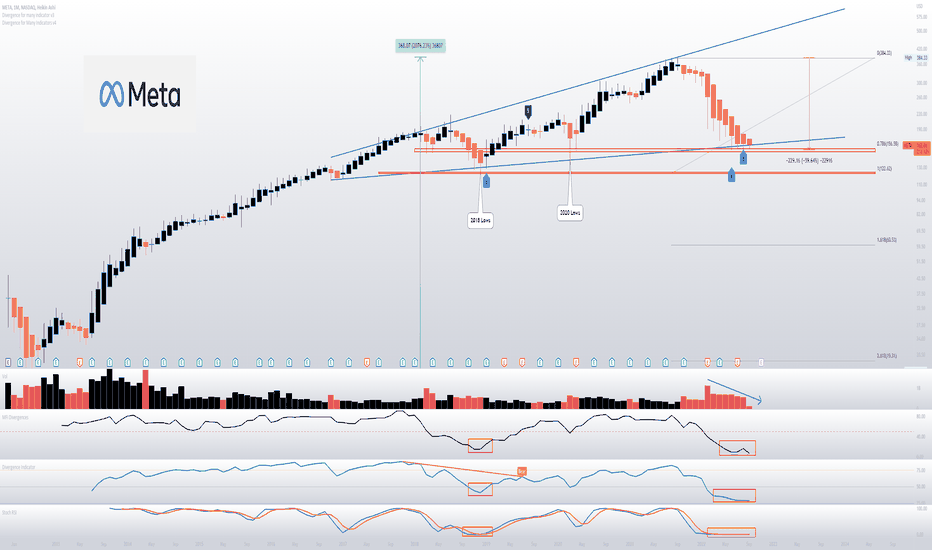
Market Cap - 426 Billion META has been on a 9 year bull run, in that period, it has firmly cemented itself as a digital marketing juggernaut. When it reached its all time high of $384.33 back in September 2021, it had an enormous market cap of 1.064 trillion dollars. At the time, it was only the fifth U.S. company to hit the milestone , joining Apple , Microsoft , Amazon and Google-parent company Alphabet . However the last 12 months have been somewhat brutal for Zuckerberg & co, the share price has dropped a staggering 60% to date, making this the biggest correction Meta has ever endured. Economic uncertainty, regulatory pressure and more recently, a first ever earnings miss, investors were quick to hit the panic button & add to the selling pressure. In February, Meta went down in history for the biggest one-day crash in the stock market. The company’s stock lost about $230 billion in market value in a single day. Meta revenue slipped to $28.8 billion in the second quarter, missing the $28.9 billion analyst estimate. Gross profit was $23.6 billion, down 0.5% from the equivalent quarter last year. In April, Apple introduced a change to its privacy policy that requires apps to ask users if they want to be tracked, this made META's ad selling business less affective, with only a reported 16% of users agreeing to be tracked. The privacy crackdown is set to cost Meta at least $10 billion in lost sales in 2022 alone. As a result of the data drought, Meta shifted their ad spending to Google because its flagship search-ad business relies on customer intent—users’ search terms immediately reveal what they are interested in—rather than data collected from app and web tracking. Google , the world’s largest digital-ad company by revenue, generated its highest sales growth in more than a decade in the third quarter. The sensational rise of short-video sharing app TikTok, has seen many users defect with approximately 1.4 billion monthly active users now on the popular platform. This is quickly approaching Instagram, which has approximately 2 billion monthly active users. This year, TikTok is on track to triple worldwide ad revenues, to $11.6bn, more than the $10.44bn for Snapchat and Twitter combined. This forced META to focus more on short-videos in the form of "Reels". Reels recently reached $1 billion in annualized revenue for the first time, Reels now has a higher revenue run rate than Facebook /Instagram Stories at identical times post-launch. Mark Zuckerberg is betting his company’s future on the metaverse — a virtual space in which people interact with each other using avatars and developing AR / VR technology. He said that he plans to invest heavily in his company’s metaverse ambitions & that will mean losing significant amounts of money on the project in the next three to five years. This massive shift has shaken up already nervous investors, however should one of its Reality Labs products change the world, it would be the jolt this company needs to continue funding its ambitions. The company once suffered a colossal 19% drop in 2018 after posting disappointing revenue and user figures for the second quarter of that year, however it bounced back before going on to make all time highs. Facebook has 2.74 billion monthly active users, No other platform offers this kind of reach. Facebook is the world’s third-most visited website- outranked only by Google and YouTube. It’s also the top Google search query. Facebook is the second-most downloaded free app in the App Store. 63% of the U.S. population over age 12 uses Facebook . 32.4% of Facebook’s audience is aged 25-34. Seniors are the fastest-growing group of Facebook users. More than 37% of people born in 1945 or earlier are on Facebook , up from 26% a year earlier. 74% of high-income earners use Facebook For those earning $75,000 or more, Facebook is the preferred social network. Facebook is also the most popular social network (besides YouTube) for college graduates, with 74% of them using the platform. LinkedIn again comes second with this group, at 51%. Facebook users spend 34 minutes per day using the platform. 36% of people get news from Facebook . 79.9% of Facebook users only access the platform on a mobile device. An average Facebook user clicks on 12 ads per month. Facebook has an advertising audience of 2.14 billion. Meta's balance sheet includes $40 billion in cash, equivalents and short term investments, with $16 billion in total debt (although some of this may include operating liabilities). The firm's free cash flow generation is very strong, with $8.5 billion generated in the quarter, up 8.9% year over year. $5 billion worth of stock was approved for purchase in the second quarter. In addition, the company authorized another $24.32 billion for stock repurchases. Meta further reduced its full-year operating expense during its latest earnings update. Its current operating expense guidance sits at $85.0-$87.0 billion for 2022 From a TA point of view, there are a number of reasons to be bullish which include- - A very strong oversold signal (not shown due to limitations using invite-only scripts on public ideas) - 9 + 5 oscillators recently printing divergence -look left, - RSI / MFI / Stochastic are all oversold & sit @ record lows, - Pulling a fib from the 2018 lows, we could see that price currently sits @ the 0.786 Fibonacci level, - Decreasing selling volume, - Support trendline being tested. Should the 0.786 / support trendline not hold, long-term bulls should look for buys @ 2018/2020 lows. Can price drop further? Sure! Timing tops or bottoms is not my thing. Will Zuckerberg's metaverse gamble pay off? Only time will tell. As it stands, Meta remains in a strong position with enormous reach, should the massive investment in metaverse pay off, there is no doubt that Meta will go on to make new highs. Speculative Setup, DYOR. Strictly a long term play. Allow 24-72 Months for this idea."there is no doubt that Meta will go on to make new highs" And a new All time high was most certainly made. Price did fall below our 2018/2020 buy zone by approximately %28, but the bulls staged a sensational rally with a 452% move to the upside. Congratulations to those who took this trade!
bL1TZZ
VeChain/USDT. Testing the 0.5 Fibonacci.

کلاه فعلی بازار 1.69 میلیارد از آنجا که در طول فروش 20 مارس به 0.00157 ریخته شد ، VeChain بیش از 17،000 ٪ به 27.9 سنت صعود کرد! اندکی پس از آن ، چاپ های "فروش باورنکردنی" ، این سیگنال ها نباید در TF بالاتر نادیده گرفته شود. قیمت از آن زمان بیش از 92 ٪ اصلاح شده است و خود را @ 0.5 سطح فیبر (2 سنت) می یابد این منطقه همچنین مقاومت قبلی است که اکنون به عنوان پشتیبانی آزمایش می شود. ما همچنین یک سیگنال خرید مشروط غیر تأیید شده داریم. در صورت عدم حفظ سطح 0.5 ، گاوهای بلند مدت باید به دنبال خرید در جیب طلایی (1 درصد) باشند ، این منطقه یک منطقه پشتیبانی / تقاضا / مقاومت جزئی قبلی است. POC تعارف 0.786 ، (نیم درصد) گاوهای بلند مدت را باید دوباره بارگیری کند. بیشترین پروفایل حجم بین 0.3 تا 1 درصد ظاهر می شود. RSI در حال تشکیل یک گوه در حال سقوط خوب است ، یک شکست + HH می تواند یک تظاهرات را آغاز کند. تصادفی بیش از حد است. حجم فروش به آرامی با گذشت زمان کاهش یافته است. زمان بندی تاپ ها/پایین مهم نیست و کار نمی کند. dcaing به پروژه های مورد علاقه خود که به آنها اعتقاد دارید بهترین است. درباره .. VeChain یک بستر blockchain سازمانی است که هدف آن ارائه نمای کامل از یک سازمان با تفکیک اطلاعات از سیلوهای data است. VeChain همچنین قصد دارد به یک بستر پیشرو برای ارائه سکه های اولیه (ICO) و انجام معاملات بین دستگاه های متصل به اینترنت اشیاء (IoT) تبدیل شود. VeChain از دو توکن استفاده می کند: VeChain نشانه (VET) به عنوان یک لایه ارزش و VeChain Thor Energy (VTHO) به عنوان یک لایه قرارداد هوشمند. تنظیم سوداگرانه ، دیور. 3-18+ ماه برای همه ایده های رمزنگاری اجازه دهید. اعتبار به بدون_ برای استفاده از شاخص ها.
bL1TZZ
Disregard The Noise. XRP Will Eventually Pump. Bulls Load Up.

اولین چیزها اول ، من بزرگترین طرفدار این چیز متمرکز به نام XRP نیستم. من مبلغین را در یوتیوب دوست ندارم زباله هایی مانند "XRP تا 10k ، 25k ، 50k ، 100k" "، بازنشانی عالی" و غیره را پخش کنم. اما احساسات در اینجا مهم نیستند ، و همانطور که مربی من بارها می گوید - "مرد احساسات ، یک قاتل پول" از آنجا که hit 10 سنت در طول فروش 20 مارس ، قیمت سپس 1800 ٪ به 1.96 دلار راهپیمایی می کند ، "فروش عالی" که سپس چاپ شده و قیمت از آن زمان 85 ٪ تا 29 سنت را اصلاح کرده است. XRP هرگز دوباره مانند بقیه بازار تجمع نکرد ، و همچنین مانند بقیه 10 سکه برتر ، عمدتاً به دلیل کل حماسه SEC ، که من مطمئن هستم که همه از آنها آگاه هستند ، دوباره به این نتیجه نرسید. قیمت در حال حاضر در جیب طلایی فیبوناچی شناور است ، مشخصات حجم زیادی را می توان بین آنجا و سطح فیبر 0.786 (19 سنت) یافت چاپ مشروط "خرید باورنکردنی" به همراه 5 نوسان ساز صعودی. Oversold تصادفی. گاوها بلند مدت اکنون باید به طور متوسط در موقعیت های خود هزینه های دلار باشد. خرید از 17 - 19 سنت بسیار عالی بود. آیا قیمت می تواند بیشتر کاهش یابد؟ کاملاً ، من تاپ های زمان یا پایین را امتحان نمی کنم. احساسات بازار بسیار نزولی است. سیستم مالی غیرقابل توصیف است و هیچ کس ، فدرال رزرو شامل نمی شود ، نمی تواند برای هر سناریوی ممکن آماده شود زیرا تا به امروز در جاه طلب ترین برنامه سفت کننده کمی خود شروع می کند. این چگونه بر رمزنگاری تأثیر می گذارد؟ فقط زمان خوب بگویید! XRP دارای یک پایگاه حامی قوی است و من معتقدم با گذشت زمان ، ریپل همچنان از 10،000 موسسه مالی که Swift در حقوق و دستمزد دارد ، به مشتریان خود ادامه داد. موفق باشید! تنظیم سوداگرانه ، دیور. 3-18 ماه برای همه ایده های رمزنگاری اجازه دهید. اعتبار به بدون_ برای استفاده از شاخص ها.
bL1TZZ
PolkaDot. In The Golden Pocket.

کلاه بازار 6.9 میلیارد قبل از تجمع مجدد به بالا 55 دلار ، قیمت 2،600 ٪ خنک قبل از واگرایی RSI Bearish + "فروش باورنکردنی" ، قیمت آن به سطح 0.5 فیبر منتقل شد. قیمت از آن زمان 88 ٪ را اصلاح کرده و خود را در جیب طلایی می یابد. ما همچنین اولین سیگنال "خرید باورنکردنی" + Oversold تصادفی را داریم. آیا این بدان معنی است که پایین در آن قرار دارد؟ نمی دانم ، من زمان بندی تاپ ها یا پایین ها را امتحان نمی کنم. گاوهای بلند مدت باید DCA (میانگین هزینه دلار) با ورود مجدد به 4 دلار ، که سطح FIB 0.786 است ، برخی از مشخصات حجم بزرگ را می توان در آنجا یافت. آیا قیمت می تواند بیشتر کاهش یابد؟ قطعاً! تنظیم سوداگرانه ، دیور. 3-18 ماه برای همه ایده های رمزنگاری اجازه دهید. اعتبار به بدون_ برای استفاده از شاخص ها. Weekly HA MFI @ 0.02 است! از آن زمان قیمت تقریباً 235 ٪ تجمع کرده است. در حال حاضر 7 نوسان ساز بزرگ در حال چاپ واگرایی در نمودار 2 هفته ای/BTC هستند. یک Breakout Trendline احتمالی + Backtest و واگرایی بالقوه RSI بالقوه.
bL1TZZ
UniSwap- MFI EXTREMLY Oversold. Bulls Load Up.

درپوش بازار 3.1 میلیارد 2400 ٪ خوب قبل از RSI Bear Div و چاپ های "فروش باورنکردنی". قیمت از آن زمان 92 ٪ را اصلاح کرده و از سطح فیبر 0.786 افزایش یافته است. پروفایل حجم بزرگ در این محدوده با POC حدود 3.80 دلار هفتگی Heikin Ashi Money Flow فهرست در 0.11 قرار دارد! Oversold تصادفی. گاوهای بلند مدت اکنون باید DCA. آیا می تواند بیشتر سقوط کند؟ مطمئناً من تاپ ها یا قسمتهای تایم را امتحان نمی کنم. تنظیم سوداگرانه ، دیور. 3-18 ماه برای همه ایده های رمزنگاری اجازه دهید. اعتبار به بدون_ برای استفاده از شاخص ها.
سلب مسئولیت
هر محتوا و مطالب مندرج در سایت و کانالهای رسمی ارتباطی سهمتو، جمعبندی نظرات و تحلیلهای شخصی و غیر تعهد آور بوده و هیچگونه توصیهای مبنی بر خرید، فروش، ورود و یا خروج از بازارهای مالی نمی باشد. همچنین کلیه اخبار و تحلیلهای مندرج در سایت و کانالها، صرفا بازنشر اطلاعات از منابع رسمی و غیر رسمی داخلی و خارجی است و بدیهی است استفاده کنندگان محتوای مذکور، مسئول پیگیری و حصول اطمینان از اصالت و درستی مطالب هستند. از این رو ضمن سلب مسئولیت اعلام میدارد مسئولیت هرنوع تصمیم گیری و اقدام و سود و زیان احتمالی در بازار سرمایه و ارز دیجیتال، با شخص معامله گر است.