
VIAQUANT
@t_VIAQUANT

تریدر چه نمادی را توصیه به خرید کرده؟
سابقه خرید
تخمین بازدهی ماه به ماه تریدر
پیام های تریدر
فیلتر
نوع پیام
VIAQUANT
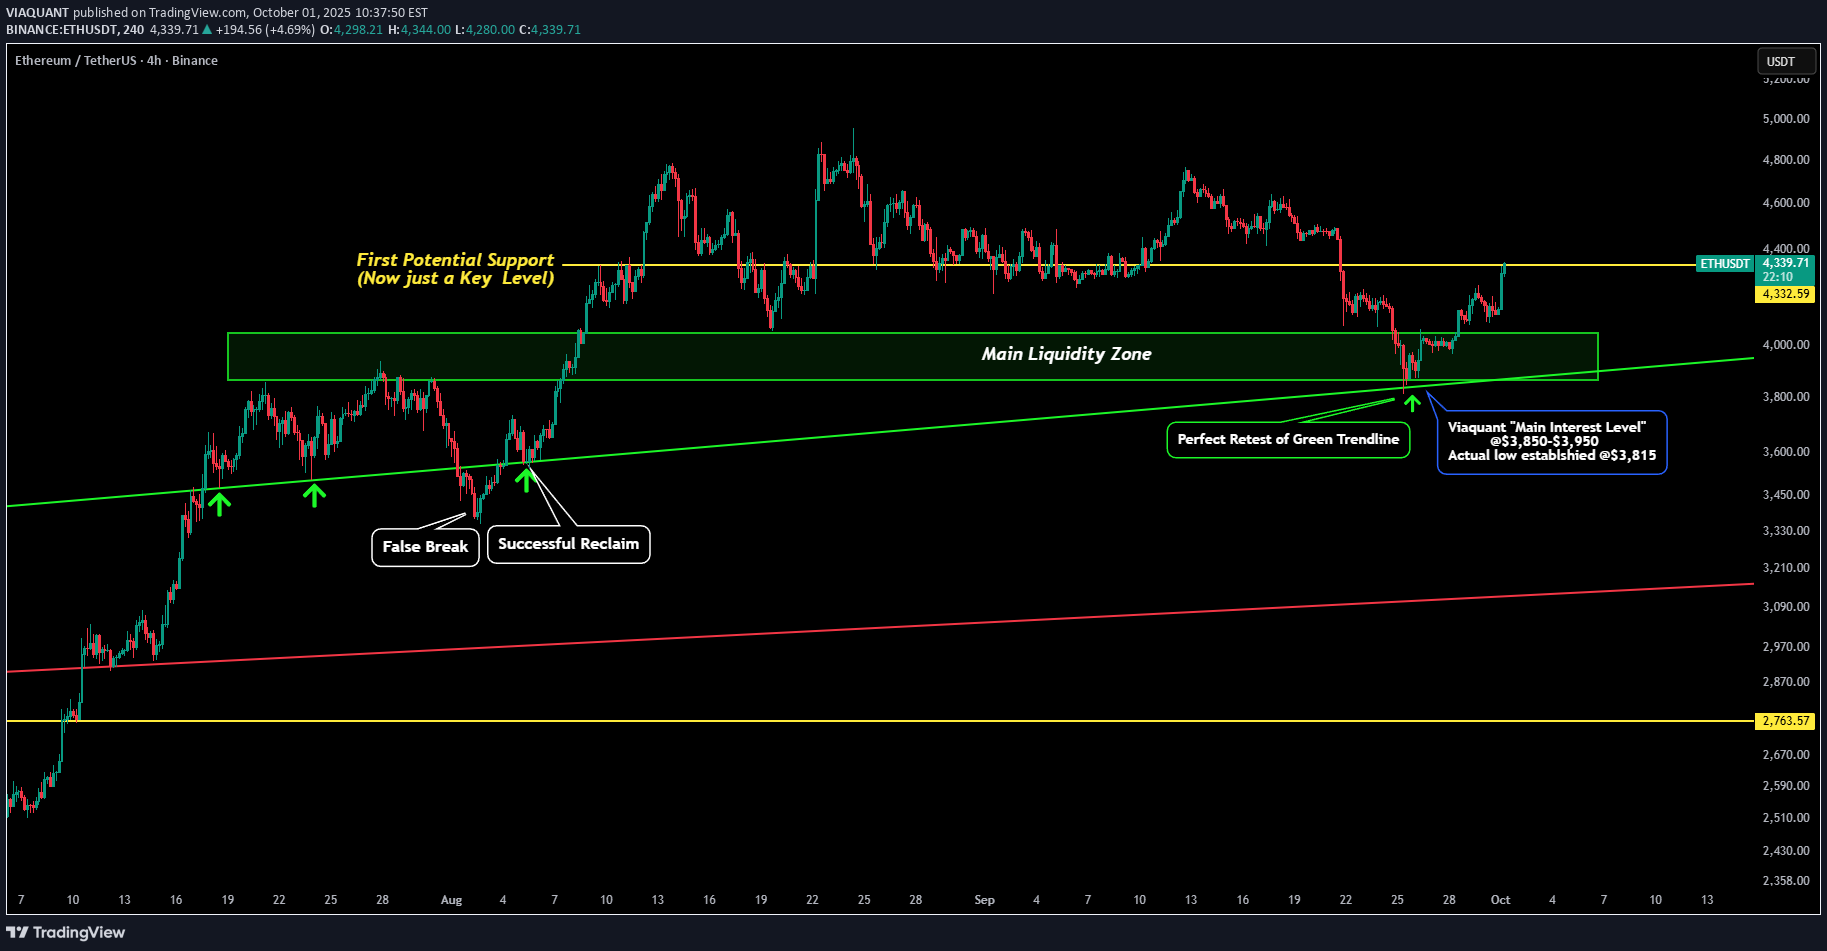
در اینجا یک بهروزرسانی برای پست ما که بیش از ۴۵ روز پیش منتشر شد، ارائه شده است: از زمانی که به اوج قیمت ۴۹۵۰ دلار رسیدیم، تمام سطوحی را که باید زیر نظر داشته باشید (ETH) مشخص کردیم. ما چند سطح کوتاهمدت را زیر نظر داشتیم، اما سطح اصلی که به آن توجه میکردیم، جعبه سبز رنگی بود که با عنوان "منطقه اصلی نقدینگی" مشخص شده بود. این منطقه بین ۳۸۰۰ تا ۴۱۰۰ دلار قرار داشت. از آنجایی که این یک سطح مقاومت چند ساله بود، آن را زیر نظر داشتیم تا به عنوان یک سطح حمایت کلان جدید (act) عمل کند. ما اشاره کردیم که "اگر شاهد افت قیمت به این سطح باشیم، خریداران باید آن را بسیار جذاب بدانند. سطح اصلی مورد علاقه بین ۳۸۵۰ تا ۳۹۵۰ دلار بود." امروز میتوانیم ببینیم که این پیشبینی چقدر دقیق از آب درآمد. اولین نکته مهمی که باید به آن توجه کرد، دقت اهداف ما است: سطح اصلی مورد علاقه (۳۸۵۰-۳۹۵۰ دلار) تنها ۳۵ دلار بالاتر از جایی بود که کف واقعی قیمت شکل گرفت! همچنین "منطقه اصلی نقدینگی" حتی بهتر عمل کرد و تنها ۱۵ دلار پایینتر از کف واقعی قیمت که در ۳۸۱۵ دلار شکل گرفت، قرار داشت!! نکته مهم بعدی که باید به آن توجه کرد، این است که قیمت چقدر دقیق خط روند سبز ما را دوباره آزمایش کرد. من در ۳ ماه گذشته در مورد این خط روند سبز پست میگذاشتم! در اینجا نمودارهای دیگری وجود دارد که این خط روند در آنها ترسیم شده بود و کف قیمت را مشخص کرده بود.
VIAQUANT
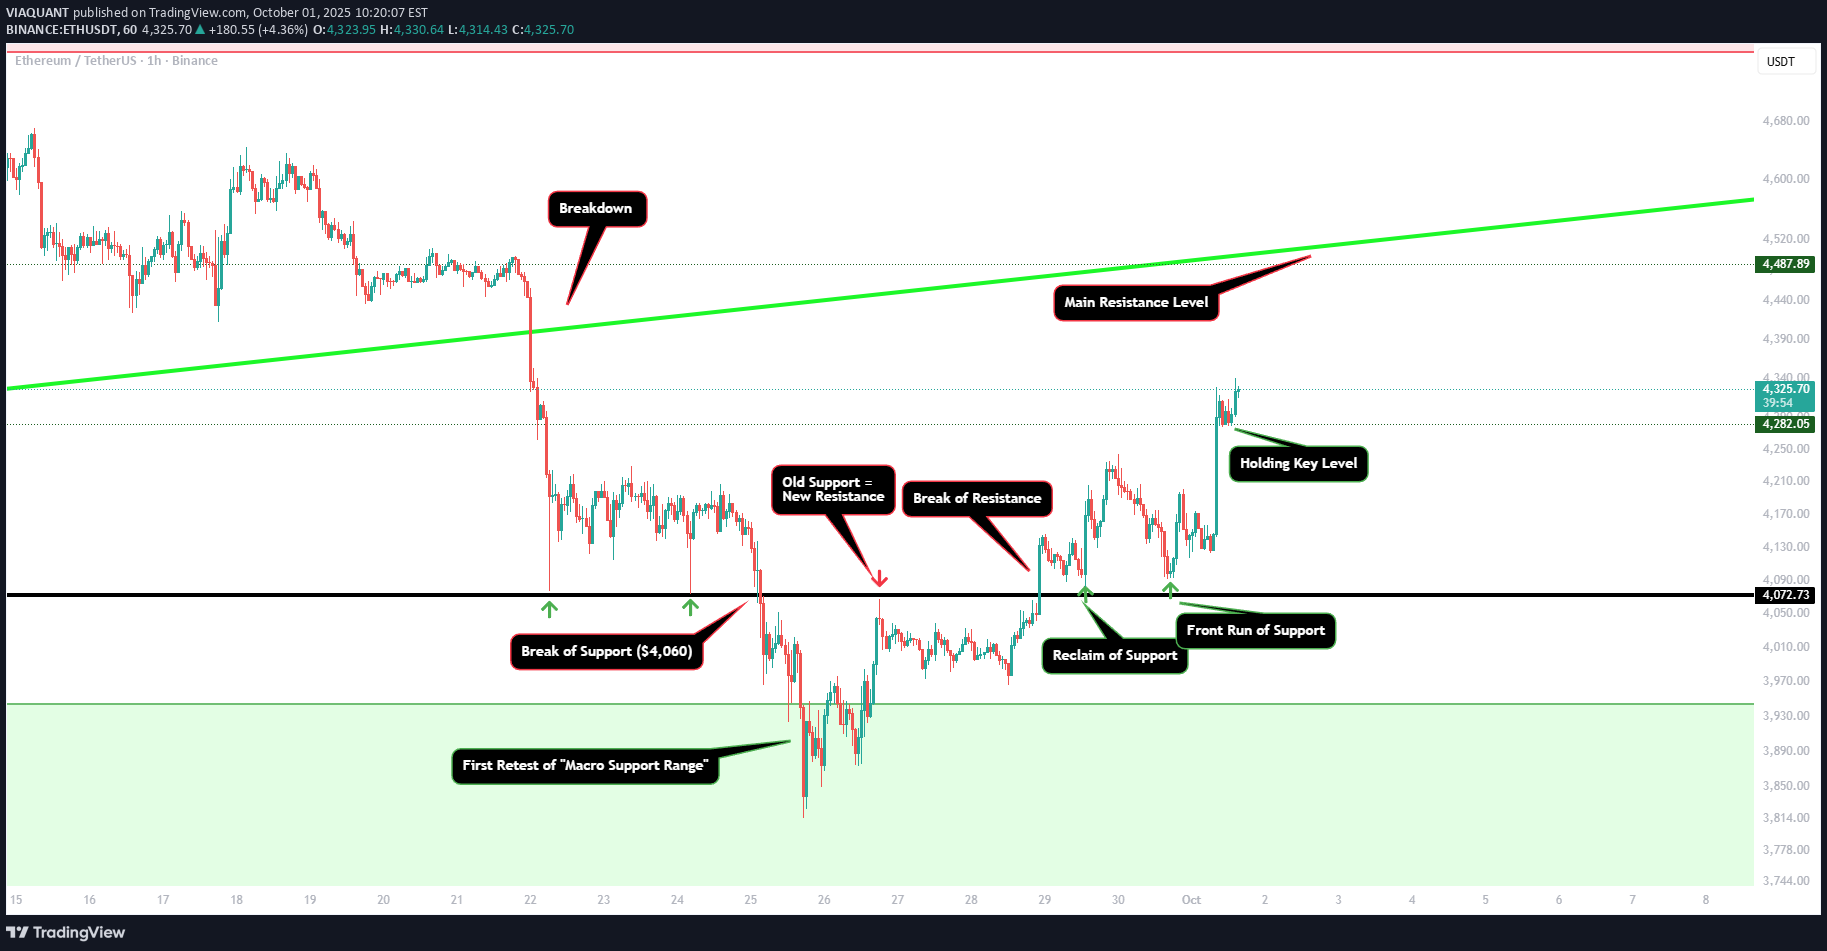
در ادامه پست قبلیمان، این یک بهروزرسانی است: در پست قبلی اشاره کردیم که ETH در حال آزمایش حمایت کلان کلیدی خود در محدوده "جعبه سبز" است و به دنبال کف قیمتی تثبیتشده در این محدوده بود. شاهد شکست سطح حمایتی ۴,۰۶۰ دلاری بودیم که باعث شد قیمت به داخل "جعبه سبز" سقوط کند. پس از اولین جهش قیمت از "جعبه سبز"، در سطح ۴,۰۶۰ دلاری به اوج رسیدیم (حمایت قبلی به مقاومت جدید تبدیل شد). پس از افت ثانویه به سطح ۳,۹۵۰ دلاری، قیمت دوباره جهش کرد و مقاومت ما را شکست. پس از اصلاح قیمت، مجدداً سطح ۴,۰۶۰ دلاری را به عنوان حمایت پس گرفتیم! این اولین سیگنال صعودی major ما بود. سپس در افت بعدی، گاوها front قیمت را تا حدود ۴,۰۹۰ دلار بالا بردند که نشاندهنده تقاضای قوی پس از بازپسگیری سطح حمایت بود. اکنون شاهد یک move به اولین سطح کلیدی خود در حدود ۴,۲۸۰ دلار هستیم. تمام بدنههای کندل (candle bodies) بالاتر از این سطح باقی ماندهاند و باید به این روند ادامه دهند تا به طور بالقوه یک move به سمت سطح مقاومت اصلی خود ایجاد کنیم. این سطح، خط روند سبز رنگ حمایت قبلی بود که اکنون میتواند به عنوان مقاومت جدید act عمل کند، بنابراین مراقب آن باشید.
VIAQUANT
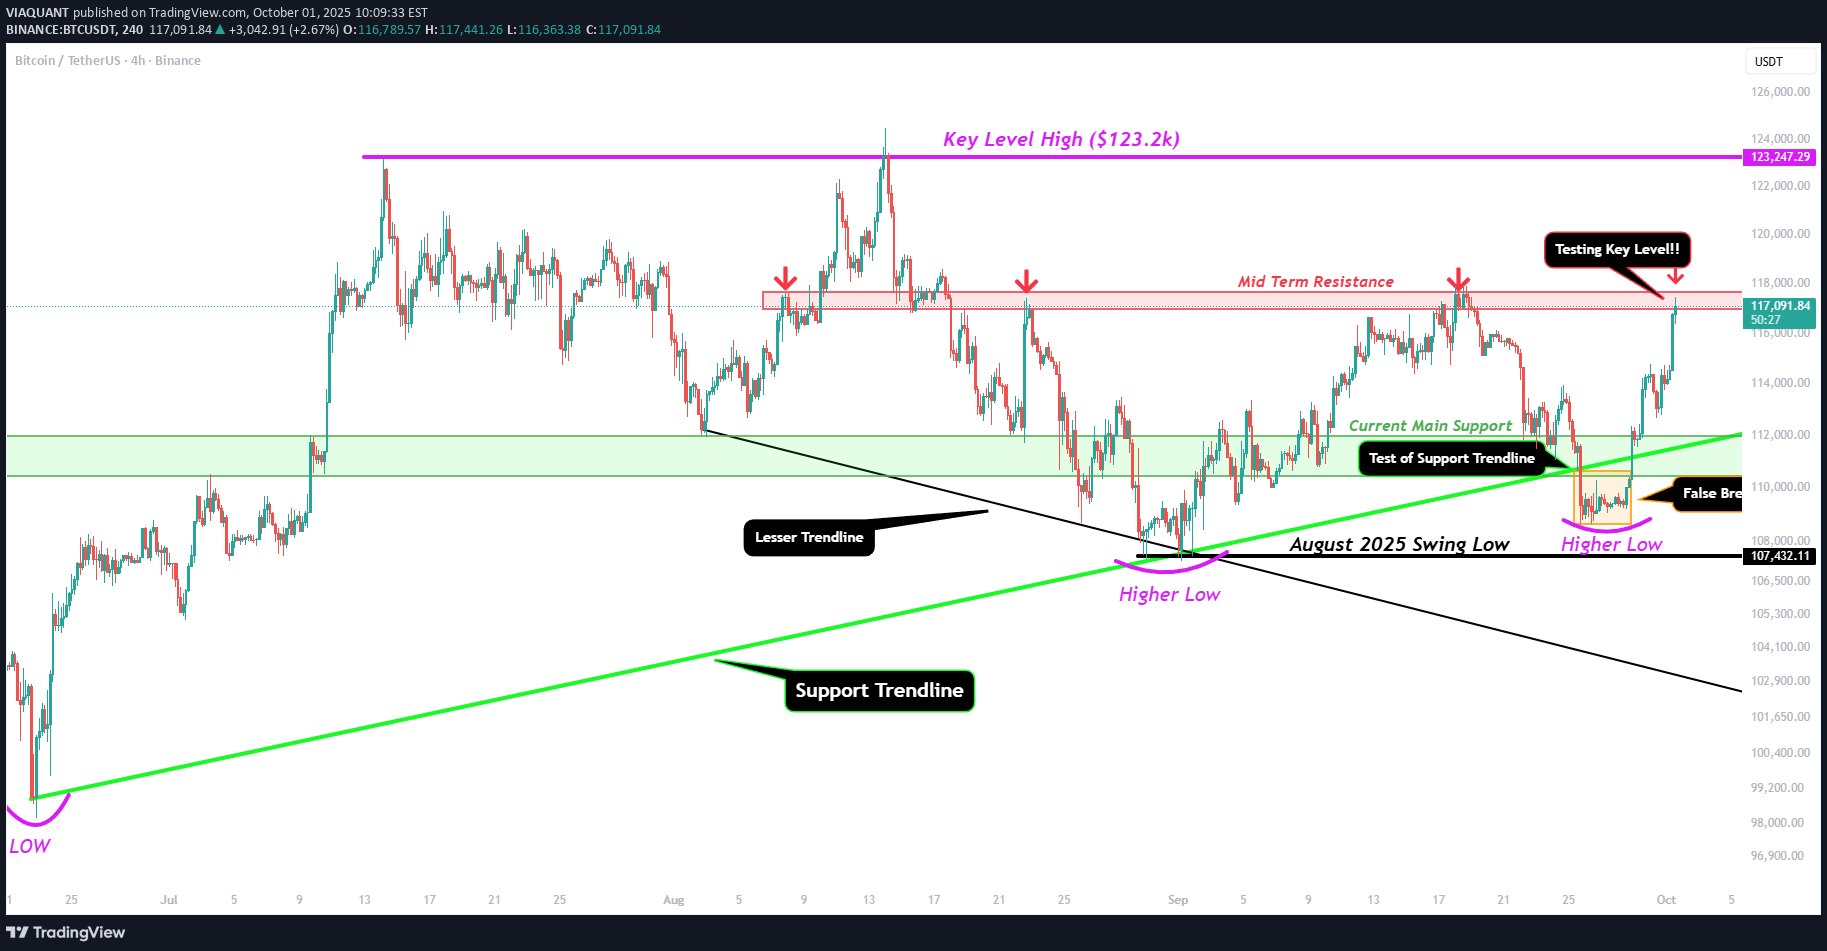
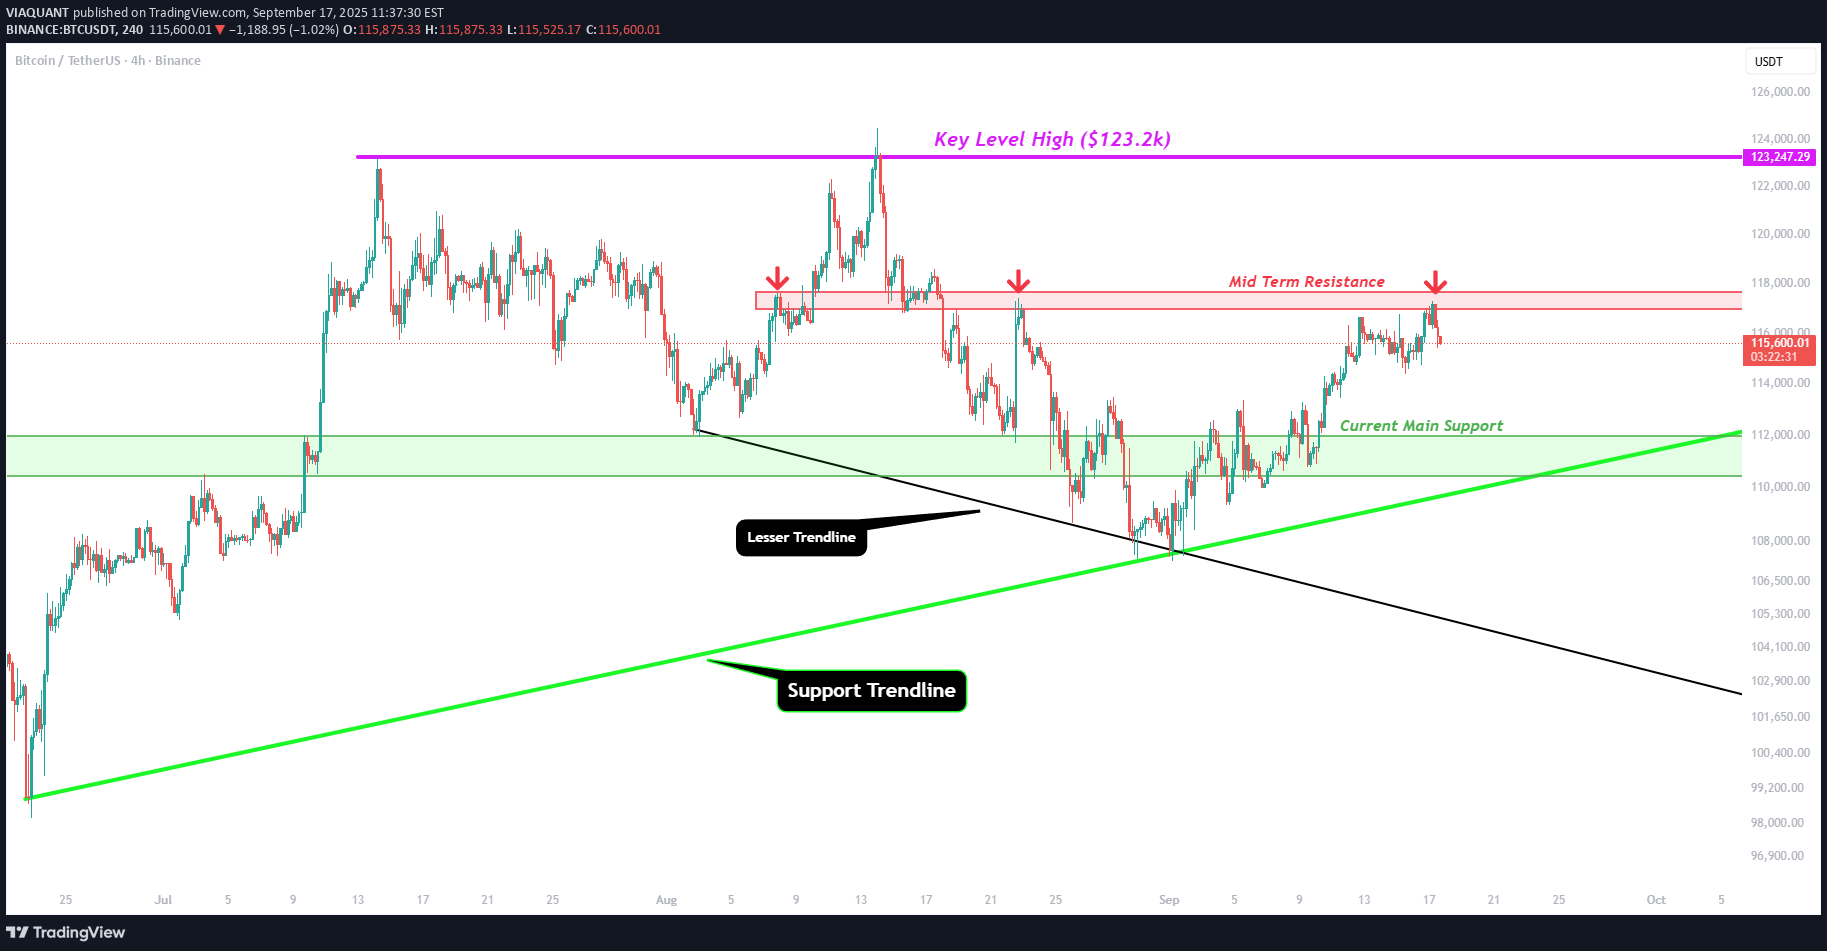
این یک بهروزرسانی برای پست قبلی من است: در پست قبلی، من توضیح میدادم که چگونه BTC تلاش میکرد از حمایت خط روند خود محافظت کند. برای مدت کوتاهی، قیمت شکسته شد و یک "شکست کاذب" از خط روند ایجاد کرد. با این حال، این اتفاق همچنان یک کف بالاتر در روند ایجاد کرد که نشاندهنده حرکت صعودی است. به محض اینکه قیمت به خط روند سبز بازگشت، شاهد یک رالی بزرگ به سمت بالا بودیم. اکنون، BTC در حال آزمایش سطح کلیدی مقاومت ما، "مقاومت میانمدت" است. این باکس red قبلاً به عنوان یک منطقه فروش عالی عمل کرده است، قبل از اینکه قیمت یک move به سمت پایین انجام دهد. پس قدم بعدی چیست؟ اگر BTC بتواند شروع به بستن کندلها بالای باکس red ما کند، آنگاه مراقب این سطوح به سمت بالا باشید: سطح 1: 120,000 - 120,400 دلار (سطح کلیدی روزانه) سطح 2: 123,200 - 124,400 دلار (ATH) سطح 3: 129,000 - 130,000 دلار (اولین 1.618) سطح 4: 135,400 دلار (پیشبینی اوج 1.618) با این حال، اگر قیمت دوباره از باکس red رد شود، میخواهیم ببینیم که خط روند سبز یا باکس سبز حفظ میشود تا یک کف بالاتر دیگر ایجاد شود. اگر نتوانیم یک کف بالاتر ایجاد کنیم، این میتواند نشاندهنده شروع بازار نزولی بعدی باشد، اما در حال حاضر روند دست نخورده است!
VIAQUANT
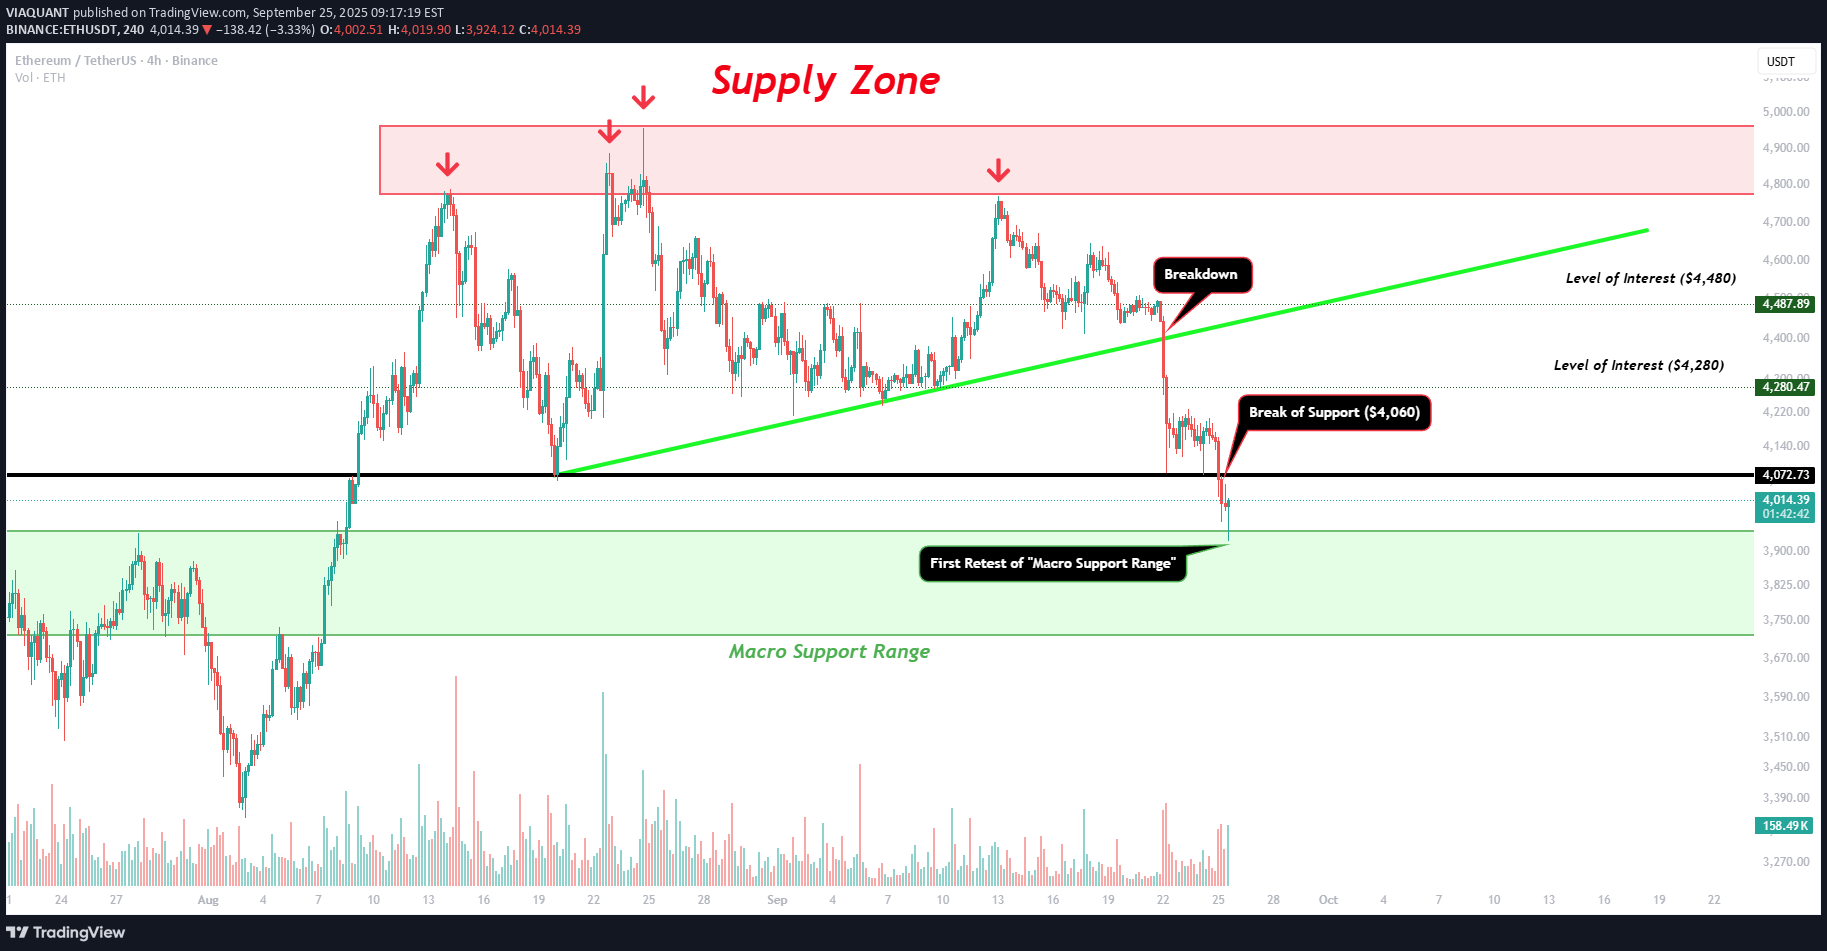
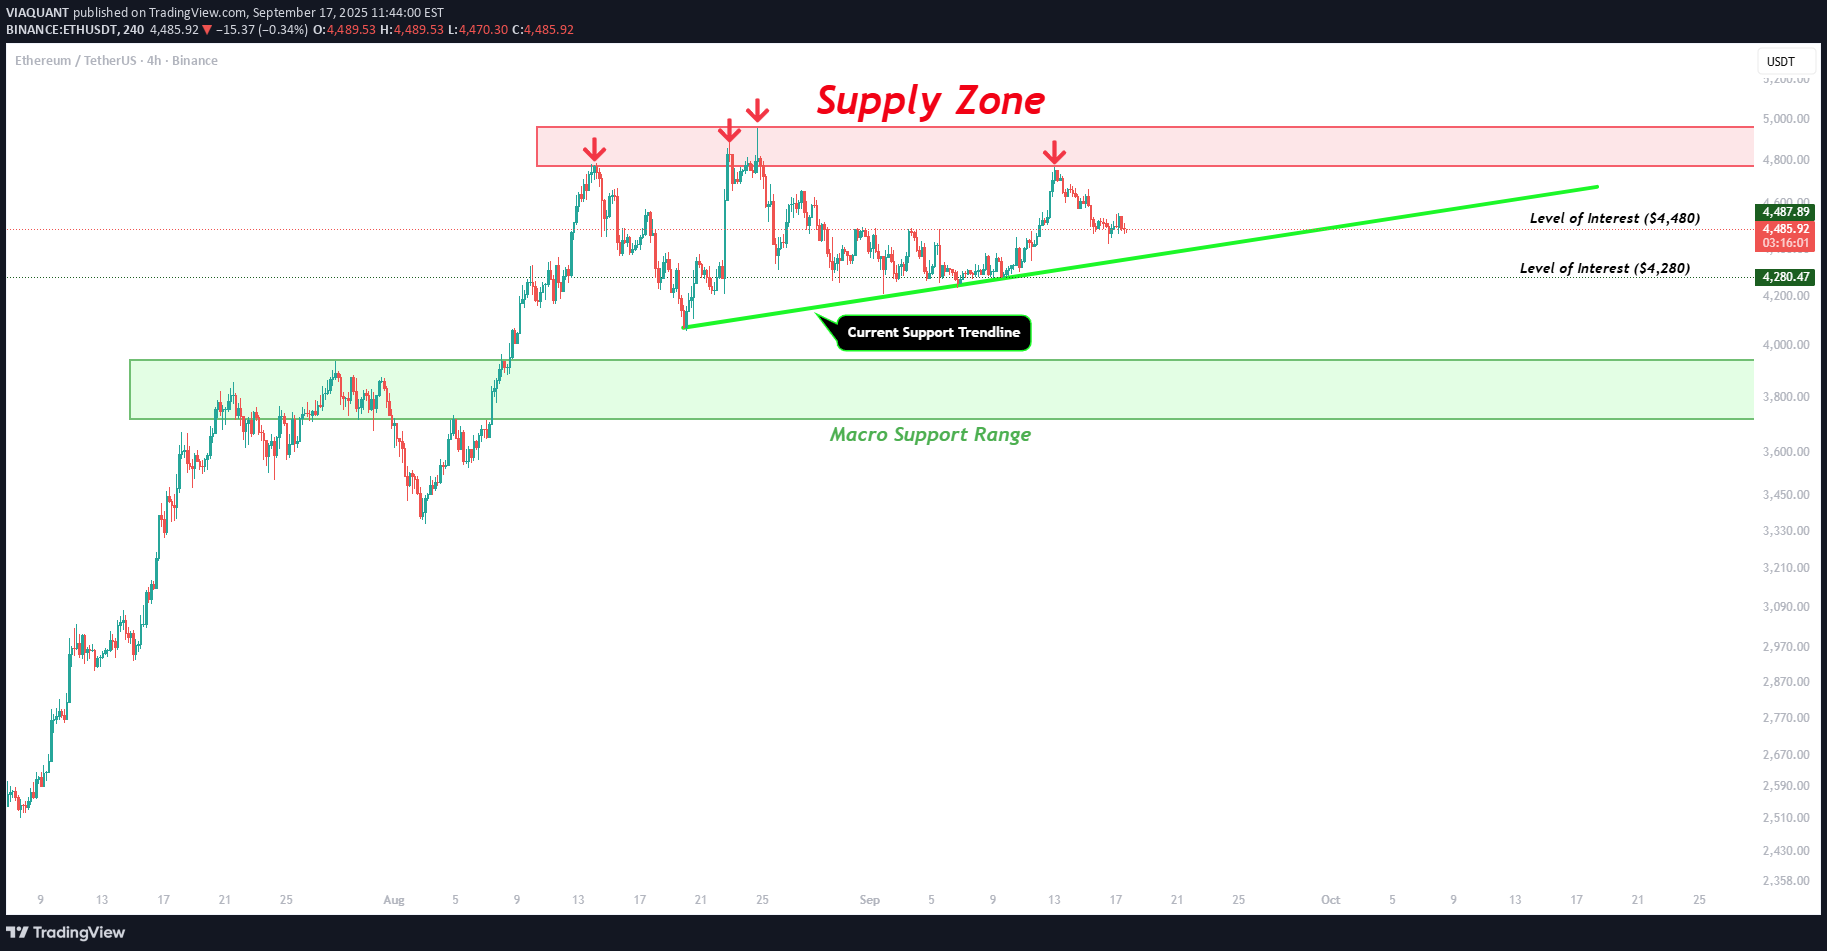
اینجا یک link به پست قبلی ما است: ما شاهد شکلگیری ساختار بازار با سه کف متفاوت در حدود سطح 4060 دلار بودیم. با این حال، شب گذشته آن کفها شکسته شدند که ما را به اولین آزمایش محدوده حمایت کلان سوق داد. این ناحیه از حدود 3700 تا 3950 دلار متغیر است. این ناحیه بسیار مهم است زیرا سالها سطح مقاومت بوده است و ما میخواهیم بازار این ناحیه را به عنوان سطح حمایت جدید تثبیت کند. اگر این امر تثبیت شود، روند برای رسیدن به اوجها دست نخورده باقی ماند. ما به تازگی اولین آزمایش و جهش از بالای باکس در 3950 دلار را مشاهده کردیم. نظارت بر نحوه واکنش بازار به این حرکت قیمت و جستجوی هرگونه تحولات بیشتر در کف در این محدوده حمایت کلان، کلیدی بود.
VIAQUANT
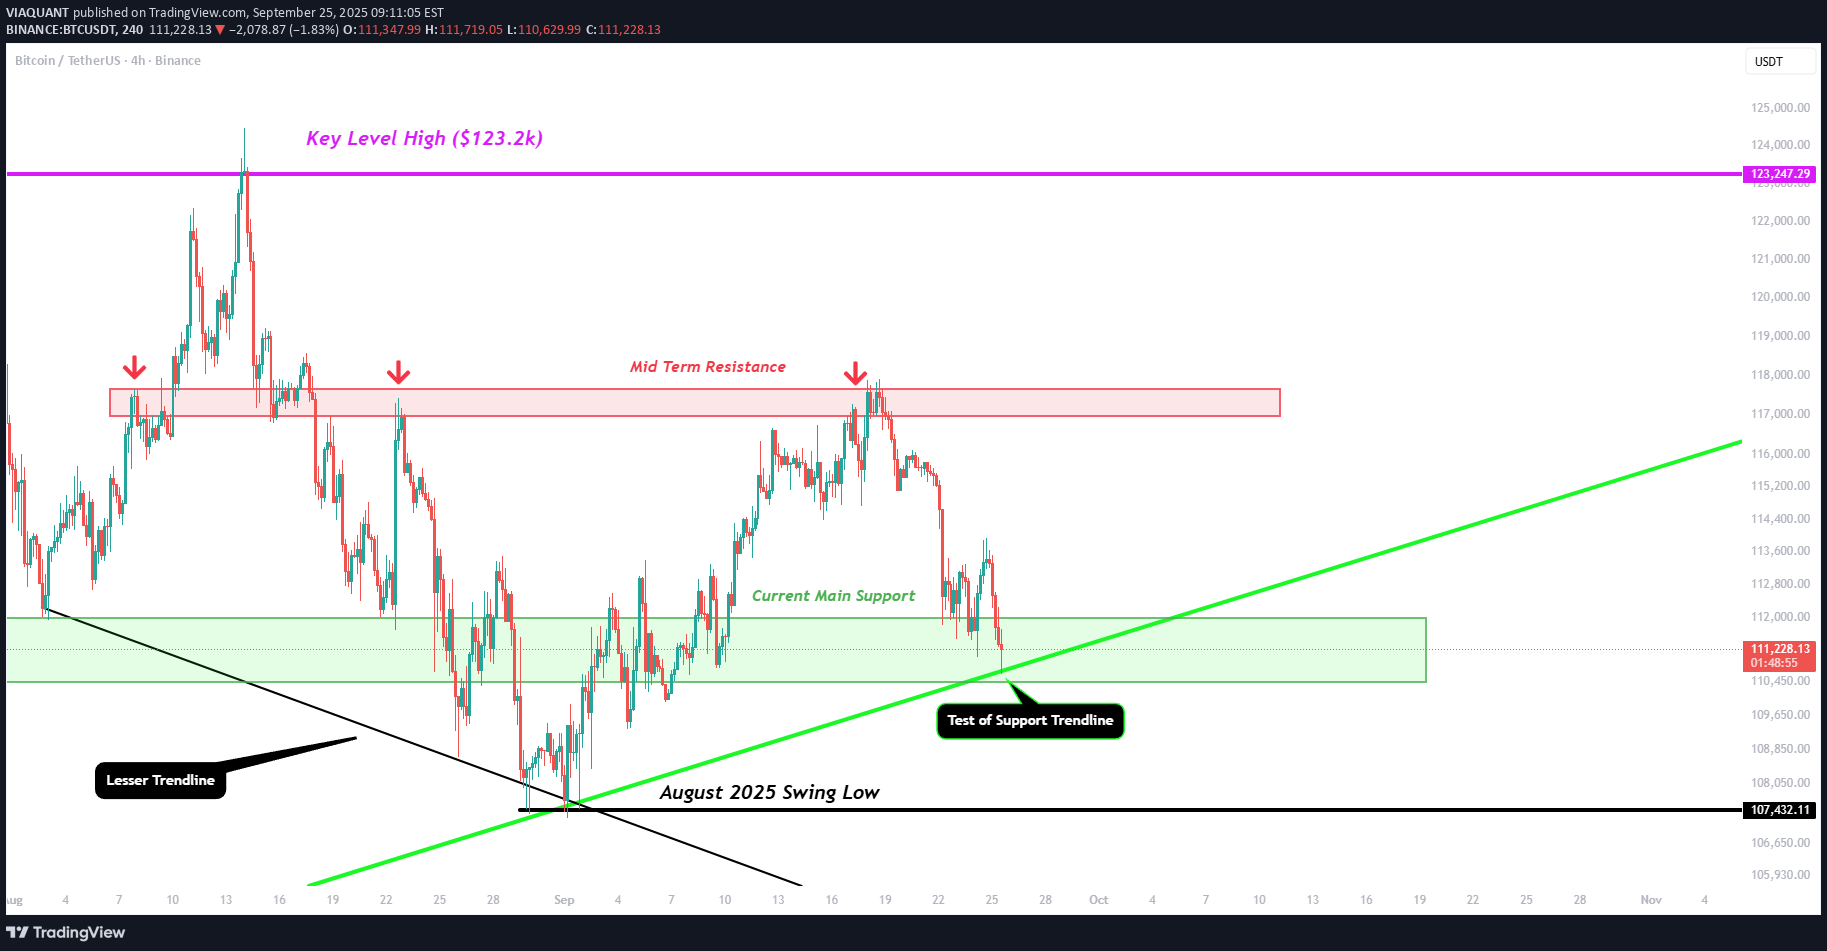
ما شاهد بودیم که قیمت دوباره به محدوده سبز حمایتی ما سقوط کرد. این سقوط همزمان با آزمایش خط روند سبز ما بود. این واقعیت که خریداران از قبل در این خط روند وارد عمل شدهاند، نشانه خوبی است. این میتواند یک نقطه پایین دیگر برای روند باشد که آزمایش حمایت دیگری را بر روی آن خط روند تثبیت میکند. با این حال، اگر این خط روند شکسته شود، پایینترین نوسان آگوست 2025 در حدود 107,500 دلار را زیر نظر داشته باشید. اگر شاهد بسته شدن کندلها در زیر این سطح باشیم، یک کف پایینتر برای روند ما ایجاد میکند و به احتمال زیاد به سطوح زیر 100 هزار دلار منجر شد.
VIAQUANT
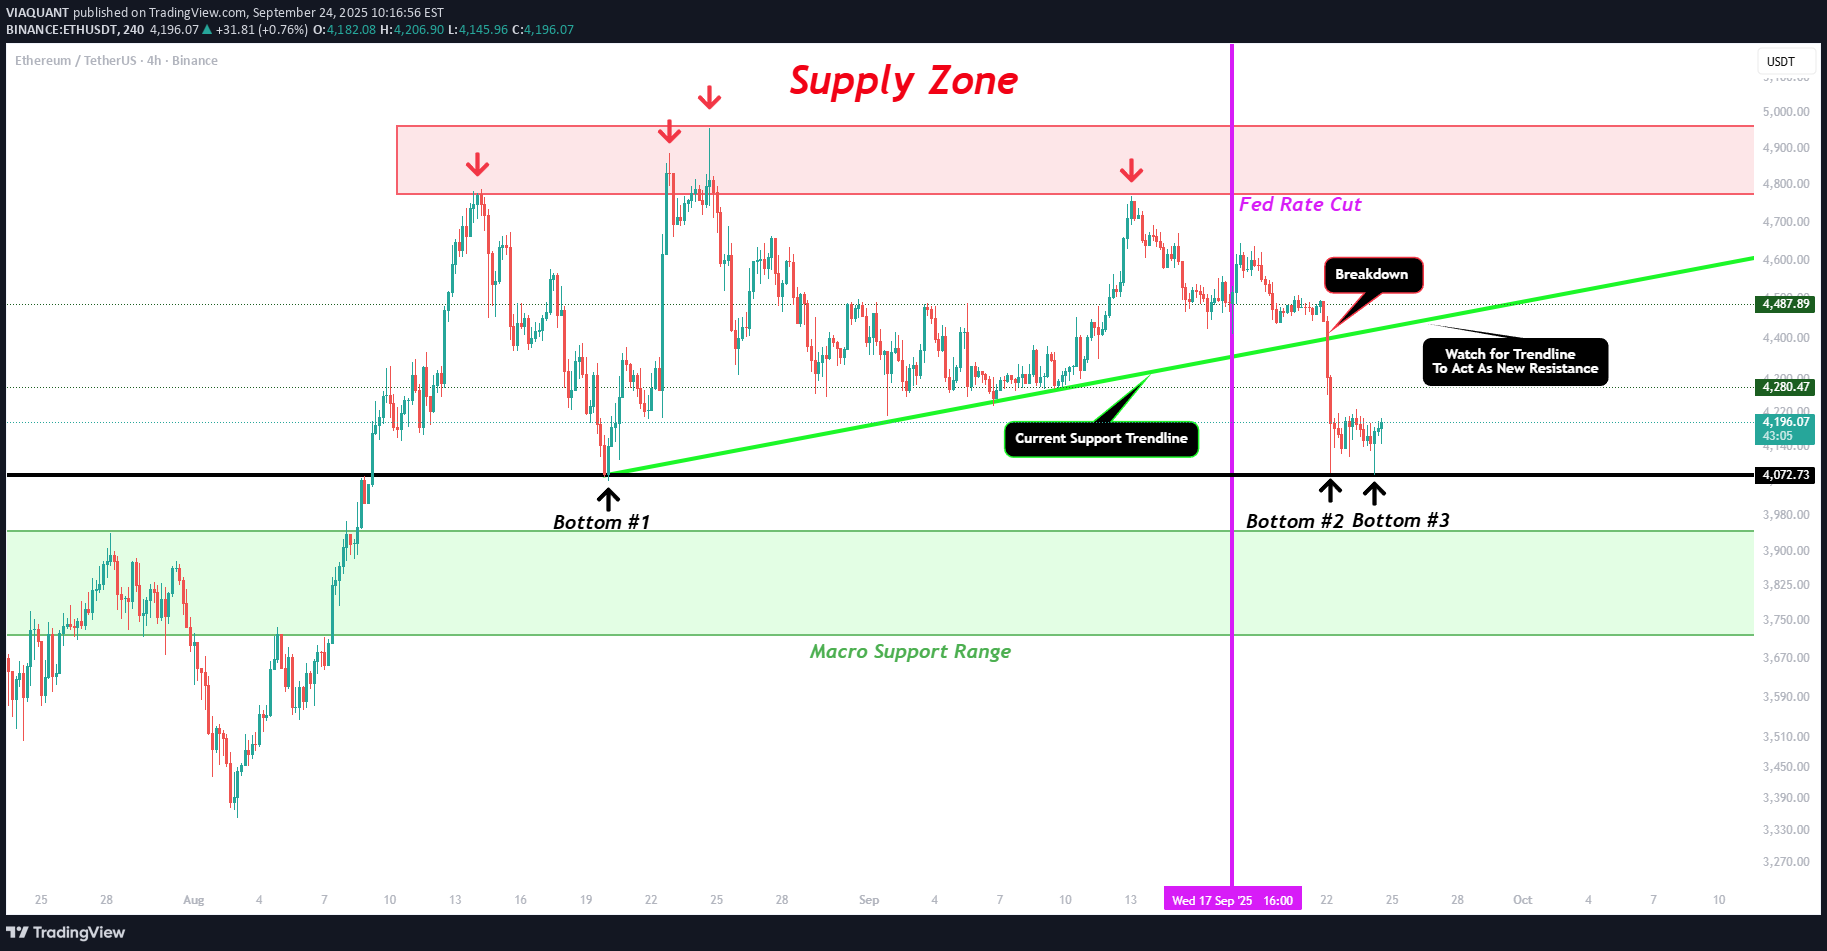
در اینجا نمودار کاهش پیش از نرخ قرار دارد: بعد از گذشت حدود یک هفته از توسعه اقدامات قیمت ، ما ایده بسیار بهتری برای پتانسیل بعدی move برای ETH داریم. پس از کاهش نرخ (خط بنفش عمودی) ، دیدیم که قیمت دارای یک تجمع کوچک است که به دنبال آن یک سوئیفت move به نزولی است. خط روند سبز ما (روند پشتیبانی فعلی) نقض شده است که باعث سقوط از حدود 4،400 دلار به 4،070 دلار شد. اکنون قیمت برای زمان 4،070 دلار کمترین میزان مشخصی را ایجاد کرده است. این نشان می دهد که به نظر می رسد مانند پایین سه گانه (فلش های سیاه + سیاه ray)! در حال حاضر تقاضای شدیدی در سطح وجود دارد که باید کمک کند تا قیمت را به سطح 4،400 تا 4500 دلار برگرداند. اگر این کار را انجام دهیم این move به صعود ، تماشای نحوه عملکرد قیمت با روند پشتیبانی سبز ما بسیار مهم بود. اکنون این قیمت زیر آن خط روند است ، هرگونه آزمایش مجدد می تواند act به عنوان سطح جدیدی از فشار فروش باشد. در حال حاضر همه چیز برای move به آن سطح خوب به نظر می رسد ، اما اگر پایین سه گانه ما در حدود 4،070 دلار در زیر بسته شود ، در آن move در آن محدوده پشتیبانی کلان محتمل بود.
VIAQUANT
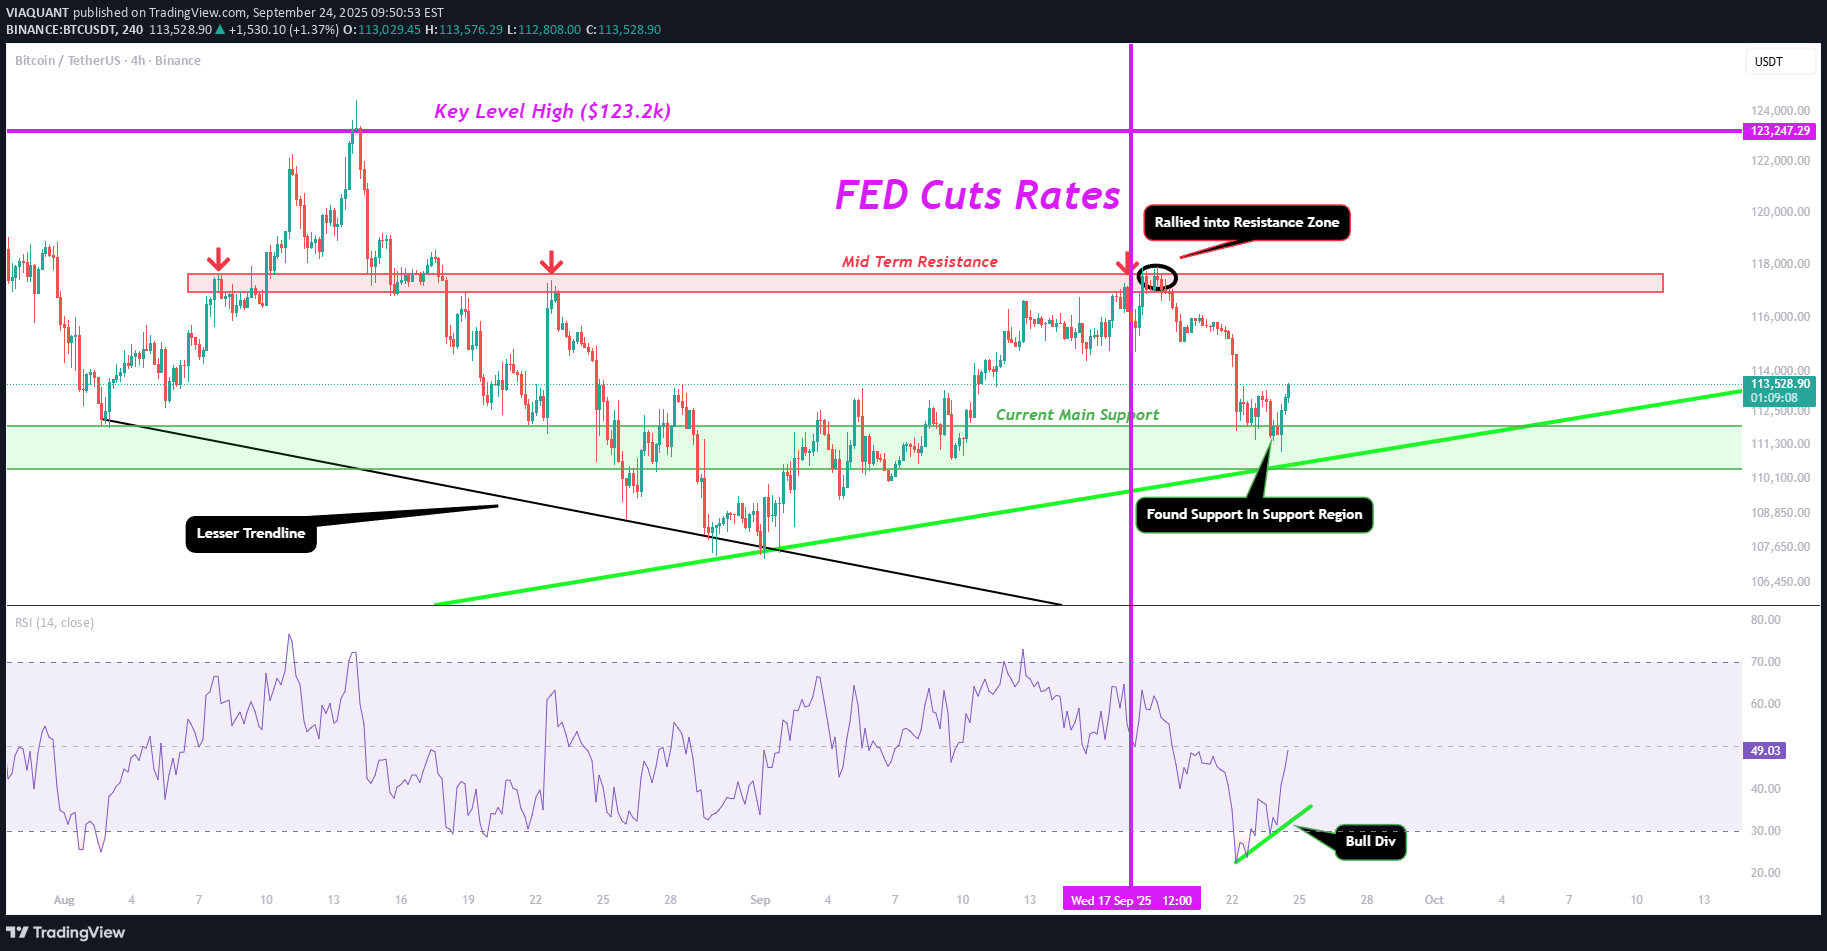
یک هفته از زمانی که فدرال رزرو نرخ بهره را کاهش داد میگذرد. اکنون زمان آن رسیده است که عملکرد قیمت را در مقایسه با نمودار قبل از کاهش نرخ بهره مجدداً بررسی کنیم. آن پست را می توانید در اینجا پیدا کنید: پس از کاهش نرخ بهره (خط عمودی بنفش)، شاهد افت شدید قیمت در حین سخنرانی پاول بودیم. پس از پایان سخنرانی او، BTC تا محدوده red (مقاومت میان مدت) صعود کرد. همانطور که انتظار می رفت، قیمت پس از آن از آن سطح مقاومت شروع به کاهش کرد. خریداران کنترل عملکرد قیمت را در محدوده سبز ما (حمایت اصلی فعلی) دوباره به دست گرفتند. همانطور که انتظار می رفت شاهد سایه های زیادی در این محدوده بودیم که به سرعت توسط خریداران جذب شدند. در حال حاضر، ما در تلاش هستیم تا شاهد شکست بالای سطح مقاومت خرد خود در 113.5 هزار دلار باشیم. اگر این سطح شکسته شود، شتاب صعودی باید ادامه یابد. با این حال، ما نمی شاهد بسته شدن کندل های 4 ساعته BTC در زیر خط روند سبز خود (خط روند حمایت) باشیم. این نشان می دهد حمایتی که در حال ایجاد آن هستیم از بین رفت و حرکت نزولی بیشتر قیمت تضمین شد. اما بر اساس تکنیکال های فعلی، به نظر می رسد BTC آماده یک move به سمت بالا است.
VIAQUANT
فقط می خواستم نمودار را همانطور که قبل از کاهش نرخ قرار دارد ، ترسیم کند. هنگامی که بازار move را از اعلامیه خارج می کند ، ما مجدداً مورد تجزیه و تحلیل قرار می گیریم و پست پیگیری در مورد آنچه در آینده می تواند باشد ، ایجاد کرد.
VIAQUANT
خواستم نمودار را در وضعیت فعلی، پیش از کاهش نرخ بهره، خلاصه کنم. به محض اینکه بازار move را از اعلامیه نشان دهد، مجدداً تحلیل کرد و در یک پست تکمیلی، اقدامات احتمالی بعدی را بررسی کرد.
VIAQUANT
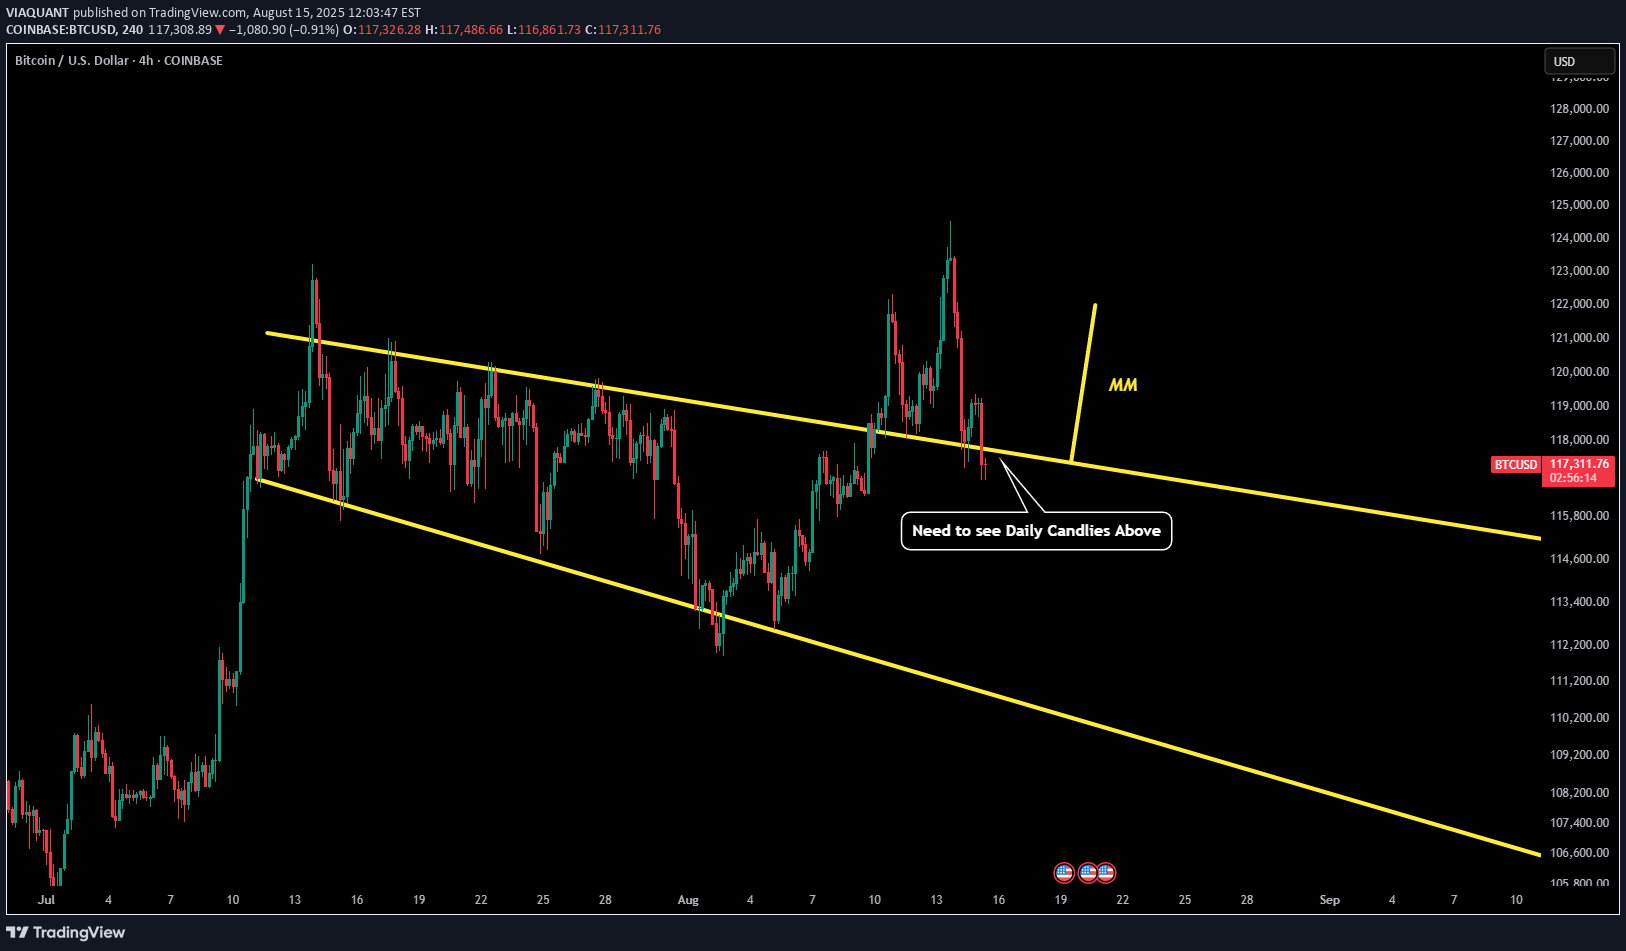
من a پستی منتشر کردم که سناریوی نزولی را شرح میدهد، که در حال حاضر محتملتر به نظر میرسد، اما با توجه به ساختار فعلی بازار، یک سناریوی صعودی a نیز وجود دارد و میخواهم آن را هم همین حالا تشریح کنم. بنابراین در این نمودار دو خط زرد داریم. خط اصلی که باید به آن توجه کنید خط بالایی است. این تایم فریم 4 ساعته است، بنابراین میتوانید تمام نقاط تماس را ببینید، اما تأییدیهها در تایم فریم روزانه مشخص شد. اگر BTC بتواند به حفظ خط زرد به عنوان حمایت در تایم فریم روزانه ادامه دهد، این میتواند نوعی الگوی شکست مثلثی + پولبک در نظر گرفته شود. اگر اینطور باشد، ما a MM (هدف اندازهگیری شده move) با 122 هزار دلار داشت. اگر شکست بتواند ادامه یابد و ما را به ATH برساند، آنگاه 130 هزار دلار به عنوان 1.618 هدف بعدی بود. هدف نهایی بالاتر در کوتاه مدت 134.4 هزار تا 135.6 هزار دلار بود. مراقب این سطوح باشید، زیرا میتوانند سقف بالقوه دیگری در آینده باشند.
سلب مسئولیت
هر محتوا و مطالب مندرج در سایت و کانالهای رسمی ارتباطی سهمتو، جمعبندی نظرات و تحلیلهای شخصی و غیر تعهد آور بوده و هیچگونه توصیهای مبنی بر خرید، فروش، ورود و یا خروج از بازارهای مالی نمی باشد. همچنین کلیه اخبار و تحلیلهای مندرج در سایت و کانالها، صرفا بازنشر اطلاعات از منابع رسمی و غیر رسمی داخلی و خارجی است و بدیهی است استفاده کنندگان محتوای مذکور، مسئول پیگیری و حصول اطمینان از اصالت و درستی مطالب هستند. از این رو ضمن سلب مسئولیت اعلام میدارد مسئولیت هرنوع تصمیم گیری و اقدام و سود و زیان احتمالی در بازار سرمایه و ارز دیجیتال، با شخص معامله گر است.