
Skyrexio
@t_Skyrexio

تریدر چه نمادی را توصیه به خرید کرده؟
سابقه خرید
تخمین بازدهی ماه به ماه تریدر
پیام های تریدر
فیلتر
نوع پیام
Skyrexio
Deep Dive Into Keltner Channel
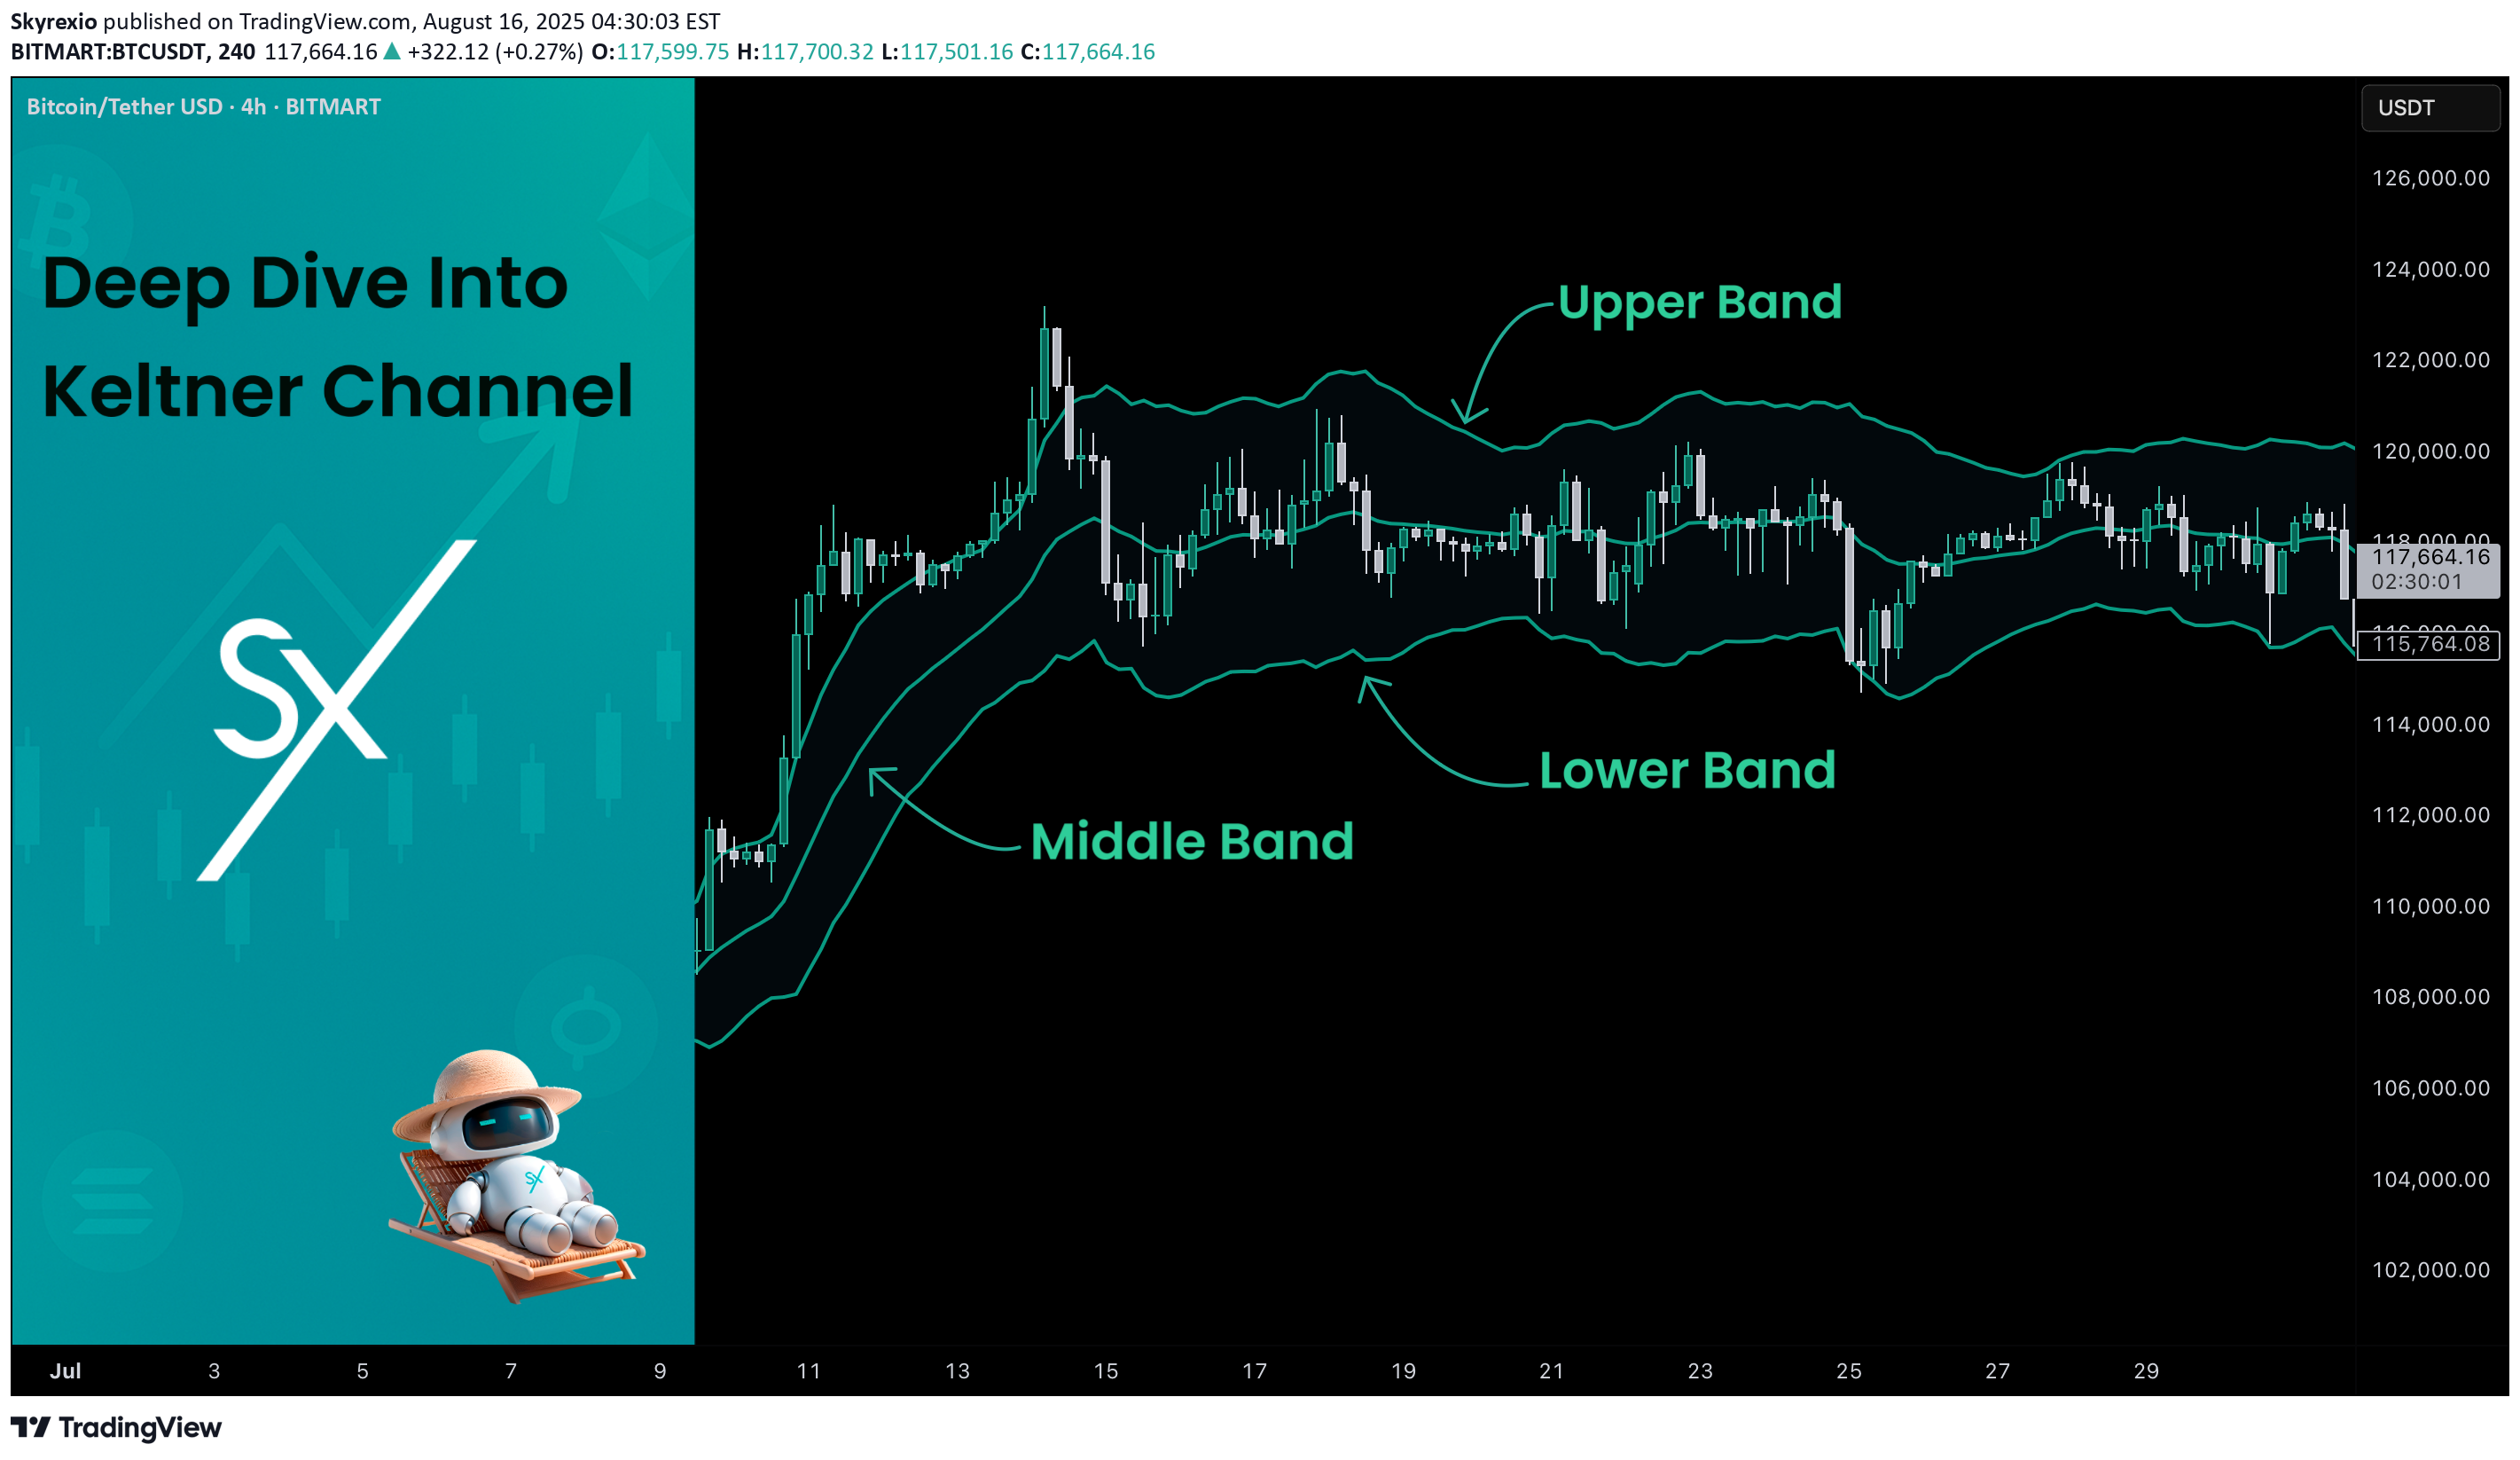
🗓The Keltner Channel is a volatility-based technical indicator that helps traders identify market trends, breakout opportunities, and potential reversal zones. Built using an Exponential Moving Average (EMA) and the Average True Range (ATR), it adapts dynamically to price movement and provides a smoother alternative to Bollinger Bands. 📚 Introduction The Keltner Channel is a versatile volatility-based trading indicator that helps traders identify trend direction, spot potential breakout opportunities, and determine overbought or oversold conditions. Unlike Bollinger Bands, which use standard deviation, the Keltner Channel is built around the Average True Range (ATR), making it less reactive to sudden price spikes and better at adapting to steady market trends. At its core, the channel consists of three lines: Middle Line – an Exponential Moving Average (EMA) of the price Upper Band – EMA plus a multiple of ATR Lower Band – EMA minus the same multiple of ATR When price stays close to the upper band, it indicates strong bullish momentum. When price hugs the lower band, bearish pressure dominates. Periods of narrow channel width often precede breakouts, while wide channels may signal trend exhaustion. 📚 Calculation The Keltner Channel is typically calculated as follows: Middle Line = EMA(n) , where n is the chosen period length (commonly 20) Upper Band = EMA(n) + ATR(m) * Multiplier , where m is chosen period length for ATR Lower Band = EMA(n) - ATR(m) * Multiplier , where m is chosen period length for ATR EMA smooths price data while giving more weight to recent values. ATR measures volatility by accounting for true price ranges, including gaps. Multiplier (often 2) determines how far the bands are from the EMA. 📚 How to Use Keltner Channel in Trading Strategies ⚡️Keltner Channel Breakout Strategy The Keltner Channel breakout strategy is built on the idea that the channel defines a normal range of price movement. The middle line reflects the average trend, while the upper and lower bands expand with volatility. Most of the time, price stays inside this range, so a close outside the channel signals unusual strength. A breakout above the upper band shows that buyers are strong enough to push price beyond what is typical, while a breakout below the lower band shows the same for sellers. This behavior suggests momentum is likely to continue, making it a potential point to join the trend. Long Setup: Price candle shall be closed above 200-period EMA Candle closes above the Kelner's Upper Band, indicating strong bullish breakout Put your trailing stop-loss at the Middle Band, close trade only when candle closes below it Short Setup: Price candle shall be closed below 200-period EMA Candle closes below the Kelner's Lower Band, indicating strong bearish breakdown Put your trailing stop-loss at the Middle Band, close trade only when candle closes above it 📈Long Trading Strategy Example 1. Price candle shall be closed above 200-period EMA. In our example we have BTCUSDT.P 4h time frame. 2. Open long trade when price candle closed above the Keltner's Upper Band. 3. Close trade when price candle closes below the Middle Band In our case we have 2:1 risk to reward trade if we compare initial stop loss and exit price. 📉Short trading strategy example 1. Price candle shall be closed below 200-period EMA. In our example we have ETHUSDT.P 4h time frame. 2. Open short trade when price candle closed below the Ketlner's Lower Band. 3. Close trade when price candle closes above the Middle Band In this case we have not a good trade. After closing short price continues dropping but then suddenly pumped and destroyed all gained profit. We think it's also important to show such trades it will make you more prepared for real market when you start trade using this strategy. 🧪 Important: as you could see stop-loss on the candle close above/below Middle Band can't be the best decision in every case. It will help you to avoid the false trade close, but usually significantly cut your profit. As always we highly recommend to make your out backtest using different trade exit approaches. You can try 3:1 RR or close exactly at the Middle Band and compare the results with provided close only approach. ⚡️Pullback to the Middle Line The pullback-to-the-middle-line strategy focuses on the EMA at the center of the Keltner Channel, which acts as dynamic support in uptrends and resistance in downtrends. In trending markets, price often retraces to this middle line before continuing in the direction of the prevailing move. When the EMA is sloping upward, traders look for buying opportunities when price returns to the middle line, expecting the trend to resume. In a downtrend, the EMA slopes downward, and touches of the middle line can be used as selling points. Exits are usually made at the opposite channel band, since price tends to extend from the EMA toward one of the outer boundaries. This gives the setup a favorable risk-to-reward profile: stops are placed near the middle line or the most recent swing, while profit targets are naturally defined by the channel structure. The key is to apply the strategy only in clear, directional markets, as pullbacks lose reliability in sideways or choppy conditions. Long Setup: Middle Band's slope shall be upward indicating the short-term uptrend. Open long trade when price pulled back to the Middle Band. Put stop-loss below the Lower Band. Take profit at the Upper Band. Short Setup: Middle Band's slope shall be downward indicating the short-term downtrend. Open short trade when price pulled back to the Middle Band. Put stop-loss above the Upper Band. Take profit at the Lower Band. 📈Long Trading Strategy Example 1. Middle Band's slope shall be positive. We use BTCUSDT.P 4h time frame. 2. Open long trade when the price pulled back to Middle Band. 3. Put initial stop loss at the Lower Band. 4. Take profit at the Upper Band. 📉Short trading strategy example 1. Middle Band's slope shall be negative. We use BTCUSDT.P 4h time frame. 2. Open short trade when the price pulled back to Middle Band. 3. Put initial stop loss at the Upper Band. 4. Take profit at the Lower Band. 🧪 Important: this strategy provides high frequent fast trades with poor risk to reward. Typically it equals approximately 1:1, but this setup has the high probability to play out well. Moreover, this strategy can be used in conjunction with the strategy from point 1 described above. Conditions don't contradict to each other and can allow you to earn money on two different market conditions. ⚡️Mean Reversion Strategy The mean reversion strategy with the Keltner Channel is based on the assumption that price tends to return toward its average after moving too far away. The outer bands of the channel serve as dynamic thresholds that help identify when the market is stretched. When price closes near or beyond the upper band, it suggests temporary overextension to the upside, creating an opportunity to anticipate a move back toward the EMA. Conversely, when price touches or moves below the lower band, traders look for a rebound toward the middle line. The trade idea is to enter counter to the extreme move, with exits placed around the central EMA. Stop losses are typically set just outside the channel to protect against strong breakouts. This approach works best in sideways or range-bound markets, where prices oscillate around a fair value, but it tends to underperform in strong trends. Long Setup: Price candle shall be closed above 200-period EMA. Open long when price touches the Lower Band. Put initial stop-loss according to your money management system. Close trade the Upper Band. Short Setup: Price candle shall be closed below 200-period EMA. Open short when price touches the Upper Band. Put initial stop-loss according to your money management system. Close trade the Lower Band. 📈Long Trading Strategy Example 1. Price candle shall be closed above 200-period EMA. In our example we have BTCUSDT.P 4h time frame. 2. Open long at the Lower Band 3. Put stop-loss. In our case we use 2%, you can use stop-loss based on your asset/time frame volatility and money-management. 4. Take profit at the Upper Band. 📉Short trading strategy example 1. Price candle shall be closed below 200-period EMA. In our example we have ETHUSDT.P 4h time frame. 2. Open short at the Upper Band 3. Put stop-loss. In our case we use 3%, you can use stop-loss based on your asset/time frame volatility and money-management. 4. Take profit at the Lower Band. 📚 Conclusion The Keltner Channel is a versatile tool that adapts to different market conditions and trading styles. Whether applied as a breakout system to capture momentum, as a pullback framework to ride established trends, or as a mean reversion setup in ranging markets, it provides traders with a structured way to interpret price action. Like any strategy, its effectiveness depends on matching the approach to the prevailing market environment and applying consistent risk management. By understanding the underlying logic of each method and practicing disciplined execution, traders can make the Keltner Channel a valuable part of their technical toolkit.
Skyrexio
Deep Dive Into Bollinger Bands

🗓This article explores the Bollinger Bands indicator—a powerful volatility tool used by traders worldwide. You'll learn how it works, how to calculate it, and how to use it to detect potential breakouts, trend reversals, and overbought or oversold conditions in the market. 📚 Introduction to Bollinger Bands In the fast-paced world of trading, understanding market volatility is key to making informed decisions. Bollinger Bands, developed by John Bollinger in the 1980s, offer a visual and statistical method to measure this volatility. Unlike simple moving averages, which only tell you the trend, Bollinger Bands expand and contract based on recent price action, helping traders spot overbought, oversold, or consolidation phases. These bands dynamically adjust to market conditions, making them one of the most popular indicators for trend-following, mean-reversion, and breakout strategies. Whether you’re trading crypto, stocks, or forex, Bollinger Bands can help you identify high-probability setups by combining trend direction with volatility. 📚 How Bollinger Bands Are Calculated Bollinger Bands consist of three lines: Middle Band – This is a simple moving average (SMA) of the price, typically over 20 periods. Upper Band – The middle band plus two standard deviations. Lower Band – The middle band minus two standard deviations. Middle Band = SMA(n) Upper Band = SMA(n) + (k × σₙ) Lower Band = SMA(n) - (k × σₙ) Where σₙ is the standard deviation of the price for n periods and k is the multiplier, typically set to 2, which captures ~95% of price action under normal distribution. The middle band shows the average price over the last 20 candles. The upper and lower bands adjust based on how volatile the price has been — expanding in high volatility and contracting in low volatility. 🤖 For those traders who want to implement Bollinger Bands into algorithmic strategy we provide formula it's calculation in Pine Script: Pine Script® basis = ta.sma(src, length) // Middle Band (SMA) dev = mult * ta.stdev(src, length) // Standard Deviation × Multiplier upper = basis + dev // Upper Band lower = basis - dev // Lower Band 📚 How to Use MACD in Trading Strategies ⚡️Bollinger Band Squeeze (Volatility Contraction and Expansion) The idea is pretty simple, а squeeze indicates low volatility and often precedes a breakout. The squeeze is the situation when the Upper Band and Lower Band contract, and BB width is at a local minimum. In this case you shall be prepared for the high volatility after the period of low volatility. This strategy doesn’t predict direction — it prepares you for volatility. Long setup: Price is in long-term uptrend, you can use 200 EMA as a major trend approximation - price shall be above it. Bollinger Bands is narrow in comparison to the previous period. Price usually is in sideways. Open long trade when candle shows a breakout and closes above the Upper Band. Set a trailing stop-loss at the Middle Band. Short setup: Price is in long-term downtrend, you can use 200 EMA as a major trend approximation - price shall be below it. Bollinger Bands is narrow in comparison to the previous period. Price usually is in sideways. Open short trade when candle shows a breakdown and closes below the Lower Band. Set a trailing stop-loss at the Middle Band 📈Long Trading Strategy Example 1. Price candle shall be closed above 200-period EMA. In our example we have BTCUSDT.P 4h time frame. 2. Bollinger Bands shall be narrow in comparison with the previous periods. 3. Open long trade when candle closes above the Upper Band. 4. Close trade when price touched the Middle Band. 📉Short trading strategy example 1. Price candle shall be closed below 200-period EMA. In our example we have BTCUSDT.P 4h time frame. 2. Bollinger Bands shall be narrow in comparison with the previous periods. 3. Open short trade when candle closes below the Lower Band. 4. Close trade when price touched the Middle Band. ⚡️Mean Reversion (Rebound from the Bands) This is the most common approach to use Bollinger Bands. The idea is also very simple, we just want to open long if price touches Lower Band and short if price reaches Upper Band. Price tends to revert to the mean (Middle Band), especially in range-bound markets. It's very important to trade in the direction of the major trend to reduce the probability of the large move against you. Long setup: Price is in long-term uptrend, you can use 200 EMA as a major trend approximation - price shall be above it. Open long trade when price touches the Lower Band. Set the initial stop-loss at the fixed percentage below entry price. Choose this percentage number with your personal risk/money management, you shall be comfortable to lose this amount of money in case of stop-loss hit. If price reached Middle Band set stop-loss at breakeven. Close trade when price reached the Upper Band. Short setup: Price is in long-term downtrend, you can use 200 EMA as a major trend approximation - price shall be below it. Open short trade when price touches the Upper Band. Set the initial stop-loss at the fixed percentage above entry price. Choose this percentage number with your personal risk/money management, you shall be comfortable to lose this amount of money in case of stop-loss hit. If price reached Middle Band set stop-loss at breakeven. Close trade when price reached the Lower Band. 🧪 Important: the most common approach to close trades is the Middle Band touch, this is classic mean reversion. We experimented multiple times with different approached and revealed that usually it's better to take profit at the Upper/Lower band for long/short trades and use Middle Band only for setting stop-loss at breakeven. This approach provides better risk to reward ratio. 📈Long Trading Strategy Example 1. Price candle shall be closed above 200-period EMA. In our example we have BTCUSDT.P 4h time frame. 2. Open long trade the Lower Band. 3. Put Initial stop-loss 2% below the entry price. 4. When price reached Middle band place stop-loss at the breakeven. 5. Close long trade at the Upper Band. 📉Short trading strategy example 1. Price candle shall be closed below 200-period EMA. In our example we have BTCUSDT.P 4h time frame. 2. Open short trade the Upper Band. 3. Put Initial stop-loss 2% above the entry price. 4. When price reached Middle band place stop-loss at the breakeven. 5. Close short trade at the Lower Band. 🧪 Important tip: notice that initial stop-loss is needed only to avoid disaster in case of price moves strongly against you. This percentage shall give enough space to avoid its reaching too often. Mean reversion strategy provides fast trades with the small average gain, so you shall maintain the high win rate (perfectly above 70%). You have to choose stop-loss based on particular asset volatility. ⚡️Combined Approach: Mean Reversion + Trend Following Skyrexio made multiple researches about Bollinger Bands strategies and we found that we can receive better gains in combination of different approaches. Mean reversion gives you great entry with discount but you don't need to exit that early. Use the trading stop and allow to gain profit while market is moving in your direction. This approach you can find in our advanced strategy Bollinger Bands Enhanced Strategy which we shared in 2024. Click on the link to read about it and understand how you can combine best features of this popular indicator. 📚 Conclusion Bollinger Bands are more than just a volatility indicator — they provide a flexible framework for understanding price dynamics and market conditions. By visualizing the relationship between price and standard deviation around a moving average, traders can gain valuable insights into whether an asset is consolidating, trending, or preparing for a breakout. The real strength of Bollinger Bands lies in their versatility. They can adapt to different trading styles — whether you’re a short-term scalper, a swing trader, or a long-term position holder. From identifying squeeze setups to riding strong trends or capturing mean reversion moves, BBs offer a strategic edge when used correctly. However, Bollinger Bands should never be used in isolation. Like any technical tool, they work best when combined with momentum indicators like RSI or MACD, volume analysis, and price action signals. Context is key: a signal that works well in a ranging market may fail during high momentum trends. Ultimately, Bollinger Bands help traders make more informed, disciplined decisions by clarifying where price stands relative to recent history. When paired with sound risk management and broader market awareness, they become a powerful ally in navigating market uncertainty.
Skyrexio
Deep Dive Into Moving Average Convergence Divergence (MACD)

🗓 The Moving Average Convergence Divergence (MACD) is one of the most popular momentum indicators in technical analysis. Whether you're a beginner or an experienced trader, understanding how the MACD works can significantly enhance your trading decisions. 📚 Introduction: What Is MACD and Why It Matters The MACD (Moving Average Convergence Divergence) is one of the most powerful and widely used momentum indicators in technical analysis. It was developed by Gerald Appel in the late 1970s and has since become a staple in the toolkit of traders and investors across markets — from stocks and forex to cryptocurrencies. At its core, MACD helps traders understand the relationship between two moving averages of an asset’s price, providing insight into both trend direction and momentum strength. By analyzing how these averages converge and diverge, the indicator offers valuable signals for entries, exits, and trend reversals. What makes MACD especially popular is its versatility — it works well in trending markets, can be used across all timeframes, and combines both leading and lagging components. Whether you're a day trader or a long-term investor, understanding how MACD works gives you an edge in making timely and informed trading decisions. 📚 How the MACD Is Calculated: The Components Explained The MACD is built from three core components: MACD line, Signal line and MACD histogram. 🔹 Calculating the MACD Line: The MACD line is the difference between two Exponential Moving Averages (EMAs), typically 12-period EMA (fast) and 26-period EMA (slow). The formula is: MACD Line = EMA(12) − EMA(26) This line captures momentum by tracking how the shorter-term average diverges from the longer-term average. When the MACD line rises, the short-term momentum is increasing faster than the longer-term trend — a sign of bullish acceleration. The reverse implies bearish momentum. 🔹 Calculating the Signal Line: To reduce noise and provide clearer signals, a 9-period EMA of the MACD line is plotted on top. This is the Signal Line, and it acts as a trigger: When the MACD line crosses above the signal line → bullish signal (buy) When the MACD line crosses below the signal line → bearish signal (sell) Signal Line = EMA(9)(MACD Line) 🔹 Calculating the MACD Histogram: The Histogram shows the difference between the MACD Line and the Signal Line: Histogram = MACD Line − Signal Line It provides a visual representation of momentum strength. The histogram bars expand when momentum strengthens and contract as it fades. It helps you spot shifts in momentum earlier than a basic crossover. 📚 How to Use MACD in Trading Strategies ⚡️MACD Signal Line Crossover Buy Signal: MACD Line crosses above the Signal Line from below (bullish crossover) Preferably when both lines are below the zero line (early in the trend) Price closes above the long-term trend approximation, in our case we use 200-period EMA Sell Signal: MACD Line crosses below the Signal Line from above (bearish crossover) Preferably when both lines are above the zero line (early in the trend) Price closes below the long-term trend approximation, in our case we use 200-period EMA 📈Long Trading Strategy Example 1. Wait until MACD line crosses over the Signal line from down to up. In our example we use 1D time frame for BTCUSDT.P . Open long trade if point 2 will be completed. 2. Price candle shall be closed above the 200-period EMA. This is long-term trend filter to increase the probability that trades will be open only in the direction of the main trend. 3. Close the long trade when the MACD line crosses under the Signal line. This is an approximation that short-term impulse is over and correction is about to start. In our case we have +20% return on this long trade, but, please, notice that we have not used initial stop-loss in this strategy. Trade was closed according to the technical condition, this approach can violate the risk management rules, but also can be applicable if you trade the amount ready to lose using this strategy. We will talk about stop-loss later. 📉Short trading strategy example 1. Wait until MACD line crosses under the Signal line from up to down. In our example we use 1D time frame for ETHUSDT . Open short trade if point 2 will be completed. 2. Price candle shall be closed below the 200-period EMA. This is long-term trend filter to increase the probability that trades will be open only in the direction of the main trend. 3. Close the short trade when the MACD line crosses over the Signal line. This is an approximation that short-term impulse is over and correction is about to start. In this case we have +15% return on the short trade. Again, strategy used the technical condition to close the trade and now let's cover how to place the stop-loss. There is no right answer how to use stop-losses. The first and the most obvious way to place stop-loss is using recent swing low/high, but the problem is that all traders are seeing them and do the same. Price tends to reach such levels to collect liquidity. Another one way to place stop-loss is using the signal candle's high/low. This is so-called 1 candle stop-loss. Usually it's very tight and can allow to have the fantastic risk to reward ratio, but we are now recommend to use it if you are not a professional trader because win rate of such strategy decreases. Third approach in placing stop-loss which we often use in our algorithmic strategies is the Average True Range (ATR). ATR is the volatility measurement, it allows to take into account the current volatility. Sometimes it helps to avoid the stop-loss hit when trade finally goes in your direction. You can just simply subtract (in case of long trade) or add (in case of short trade) ATR value to the entry price and obtain the dynamic stop loss based on current market condition. Also multiplier can be used for ATR. You shall choose the approach which is more comfortable for you, backtest all these approached to make your choice. 🧪Important: we used the long signals only below the zero-line and short signals above it in the attempt to catch the beginning of a trend and have large potential move. On the picture below you can see the same BTCUSDT.P , but what will happen if we open long on the lines crossover above zero line? This trade will not be profitable because of restricted potential. ⚡️MACD Zero Line Crossover Buy Signal: MACD Histogram crosses above the zero line (momentum shifts from bearish to bullish) Price closes above the long-term trend approximation, in our case we use 200-period EMA Sell Signal: MACD Histogram crosses below the zero line (momentum shifts from bullish to bearish) Price closes below the long-term trend approximation, in our case we use 200-period EMA 📈Long Trading Strategy Example 1. Wait until MACD Histogram crosses over zero line. Open long trade if point 2 will be completed. 2. Price candle shall be closed above 200-period EMA. This is long-term trend filter to increase the probability that trades will be open only in the direction of the main trend. 3. Take profit when price reaches 3:1 risk to reward ratio according to the stop-loss from point 4. 4. Stop-loss shall be placed below recent swing low. This point can be discussed, you can use any stop-loss technique described earlier in this article. We demonstrate the simplest one, the key here is using at least 3:1 RR. 📉Short trading strategy example 1. Wait until MACD Histogram crosses under zero line. Open short trade if point 2 will be completed. 2. Price candle shall be closed below 200-period EMA. This is long-term trend filter to increase the probability that trades will be open only in the direction of the main trend. 3. Take profit when price reaches 3:1 risk to reward ratio according to the stop-loss from point 4. 4. Stop-loss shall be placed above recent swing high. This point can be discussed, you can use any stop-loss technique described earlier in this article. We demonstrate the simplest one, the key here is using at least 3:1 RR. ⚡️MACD Divergence Strategy MACD Divergence is a strategy that helps traders identify potential reversals in market direction before they become obvious on the price chart. This makes it a favorite tool among swing traders and crypto enthusiasts looking to catch major moves early. But what exactly is a divergence? In simple terms, divergence occurs when price and momentum (MACD) are moving in opposite directions — signaling that the current trend may be losing strength and preparing for a reversal. There are two main types of divergence. 🐂 Bullish Divergence Price makes a lower low MACD Histogram makes a higher low This suggests that while price is still falling, downward momentum is weakening. The bears are losing control, and a bullish reversal may be near. Trading signal is very simple, when bullish divergence happens wait for the first increasing column on MACD histogram and open long trade. Place stop-loss under recent swing low and take profit at 3:1 RR. 🐻Bearish Divergence Price makes a higher high MACD makes a lower high This suggests that while price is still falling, downward momentum is weakening. The bears are losing control, and a bullish reversal may be near. Trading signal is very simple, when bearish divergence happens wait for the first decreasing column on MACD histogram and open short trade. Place stop-loss above recent swing high and take profit at 3:1 RR. 🧪 Important hint: MACD histogram shall cross the zero line between two lows/high to create the most reliable divergence signals. We are not recommend to use it without zero-line crossover to decrease number of false signals. 📈Long Trading Strategy Example 1. MACD Histogram shall create higher low. 2. Price shall create lower low. 3. MACD Histogram shall cross the zero line between lows. 4. MACD Histogram shall show the first increasing column. 5. Put stop-loss under the recent swing low. 6. Put take profit at 3:1. 🧪 You can enhance the long signal with the MACD Line divergence. In our case we have both divergences: with MACD Histogram and MACD Line. 📉Short trading strategy example 1. MACD Histogram shall create lower high. 2. Price shall create higher high. 3. MACD Histogram shall cross the zero line between lows. 4. MACD Histogram shall show the first decreasing column. 5. Put stop-loss above the recent swing high. 6. Put take profit at 3:1. 🧪Divergence is extremely strong signal, but when price continue it's move in the direction of a trend and it's not reversing it can also be the signal for the trend continuation. This situation is called "Baskerville Hound" signal, this name was given by famous trader Alexander Elder. We don't recommend to use it for novice traders, but it's useful to know about it. 📚 Conclusion The Moving Average Convergence Divergence (MACD) is more than just a crossover tool — it's a powerful momentum indicator that offers deep insight into the strength, direction, and timing of market trends. By understanding how the MACD line, Signal line, and Histogram interact, traders can uncover early trend shifts, spot momentum divergences, and time entries and exits with greater confidence. Whether you're a short-term trader using fast crossovers for scalping or a long-term investor watching for weekly divergences, MACD can adapt to your style when used thoughtfully. Like all indicators, it works best when combined with price action, support/resistance levels, and other indicators — not in isolation. Ultimately, mastering MACD is not about memorizing patterns, but about learning to read the story of momentum that unfolds beneath the surface of price. With disciplined application and practice, MACD can become a reliable compass in your trading strategy.
Skyrexio
Bitcoin Is Entering Into Very Difficult Times

سلام ، SkyRexians! من فکر کرده ام که با BTCUSDT چه اتفاقی افتاد و بدیهی است که تصحیح آغاز شده است ، می توانید به راحتی به روزرسانی اخیر من را در Bitcoin پیدا کنید و آن را بررسی کنید ، اما بعد از آن چه شد. امروز تصمیم گرفتم که اولین ضربه هنوز ظریف نشده است و ما برای تکمیل این رشد قبل از تصحیح قابل توجه به یک پا کوچک دیگر نیاز داریم. نوسان ساز عالی به من این ایده را داد که فقط موج 3 بالاتر از 110 کیلو دلار به پایان رسیده است. اکنون قیمت در حال چاپ موج 4 است. موج 4 دارای هدف بین 0.38 تا 0.5 فیبوناچی است ، اما این بار قطعاً 0.38 با 101K دلار بود. در اینجا 4 پایه موج درجه کوچکتر بود. موج 5 کوتاه می شود زیرا موج 3 گسترش یافته است ، بسیار منطقی است. پس از آزمایش مجدد 111K ، موج major موج 2 تقریباً به 90K دلار می رود. من فکر می کنم این دوره فقط در پایان ماه ژوئن به پایان می رسد. با احترام ، ایوان SkyRexio__________________________________________________________________________________________ ، این مقاله را تقویت کرده و اگر دوست دارید تجزیه و تحلیل را مشترک کنید!
Skyrexio
LDO Is About To Explode

سلام ، SkyRexians! امروز من به روزرسانی در Ldousdt می کنم که با قیمت متوسط با 0.8 دلار در محل قرار می گیرم. اول از همه من توضیح داد که چگونه این پیش بینی صعودی می تواند با تجزیه و تحلیل دیروز من در مورد افت Altcoins مطابقت داشته باشد. به راحتی! چارچوب زمانی 2D - تجزیه و تحلیل دوره میانی وجود داشت. این نمودار هفتگی است. من می توانم اجازه دهم که برخی از قطره ها برای Lido Dao یا ALT های دیگر امکان پذیر باشد اما تصویر جهانی یکسان بود. در نمودار برخی از شما تجمع را مشاهده کرد. در واقع این Wave 2 ABC بسیار طولانی است. جالب نیست که در مورد waves A و B. بگوییم تنها یک چیز مهم است که اکنون موج C در 2 با واگرایی بین waves 3 و 5 به پایان رسیده است. موج بعدی مجنون بود و به بسیار بالا می رسد ، بالاتر از $ 6.best ، ایوان SkyRexio_______________________________________________________________________________________________________________________________________________________________________________________________________________________________________________________________________________________________________________________________________________________________________________________________________________________________________________
Skyrexio
Bitcoin - Correction Is Finally Happening!
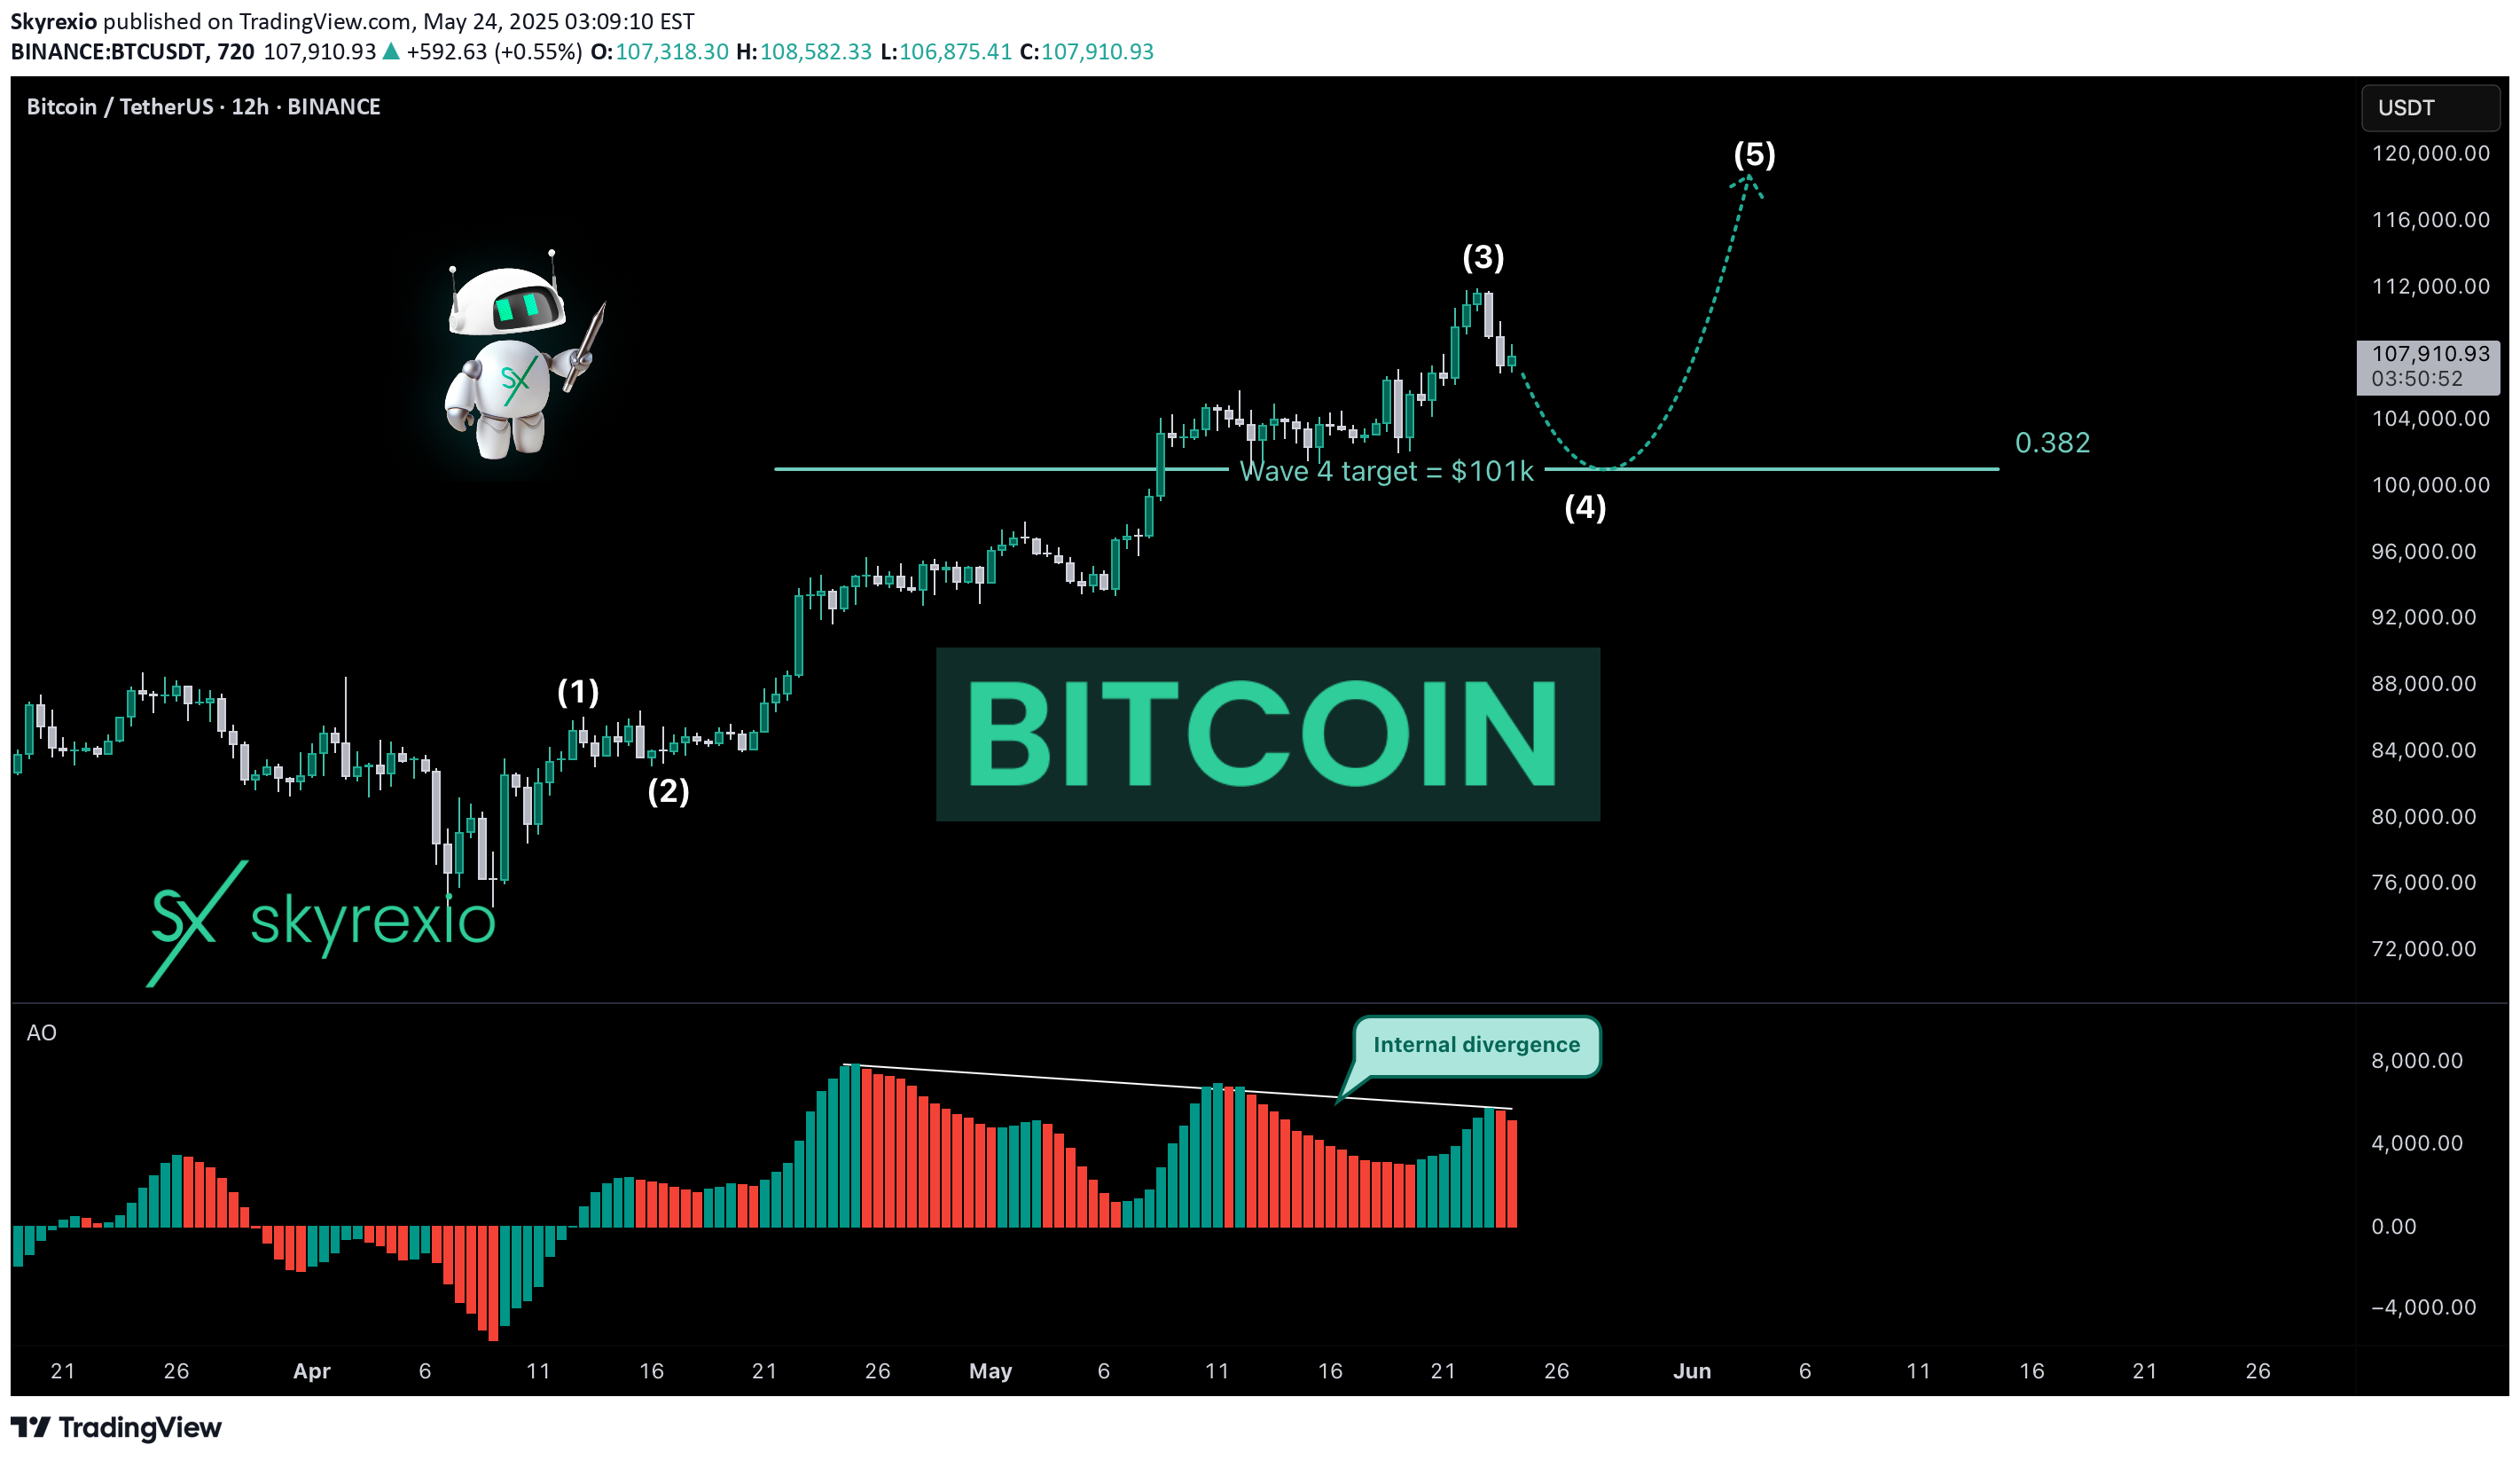
سلام اسکایرکسیانیها! بیایید به تلاش برای حدس زدن زمان اصلاح قیمت BTCUSDT ادامه دهیم. این بار احتمال اصلاح بسیار زیاد است، اما من توصیه نمیکنم که در این اصلاح موقعیت فروش (short) باز کنید زیرا این معامله خلاف روند major است. بیایید به تایم فریم 12 ساعته نگاهی بیندازیم. به احتمال زیاد موج 3 با واگرایی مضاعف داخلی در Awesome Oscillator به پایان رسیده است. اکنون بالاخره زمان موج 4 فرا رسیده است. فیبوناچی 0.38 محتملترین هدف در 101 هزار دلار است. پس از آن، انتظار میرود موج 5 شروع شود و این فقط موج 1 درجه بالاتر بود. با احترام، ایوان اسکایرکسیو ___________________________________________________________ لطفا این مقاله را تقویت کنید و اگر از تحلیل خوشتان آمد صفحه ما را دنبال کنید!
Skyrexio
AVAX Is My The Most Confident Investment!

سلام، اسکایرکسیانی ها! وقتشه تحلیل قبلی AVAXUSDT رو به روز کنم، چون وقتی گفتم اصلاح تموم شده، خیلیا تو کامنتا ازم بدشون اومد. بهم میگفتن چطوری میشه رو رشد یه آلت کوین و ریزش اون یکی شرط بست - خیلی آسونه! این کریپتو واضح ترین ساختار رو برای من داره. موج 1 خیلی پرقدرت بود و بعدش یه اصلاح تقریبا مسطح دیدیم. موج B کمی پایین تر از بالای موج 1 تموم شد، موج C کمی پایین تر از کف موج A تموم شد. واگرایی روی Awesome oscillator و رشد مومنتوم نشون میده که اصلاح تموم شده و هدف بعدی 1.61 فیبوناچی بالای 100 دلاره توی موج 3. با احترام، ایوان اسکایرکسیو ___________________________________________________________ لطفا این مقاله رو به اشتراک بذارید و اگه از تحلیل خوشتون اومده صفحه ما رو دنبال کنید!
Skyrexio
Bitcoin Is Printing Irregular Correction

سلام اسکایرکسیها! با وجود نظرات منفی مبنی بر اینکه BTCUSDT به جای پیشبینی نزولی من، پامپ کرد و با وجود خریدهای Bitcoin سیلور، من همچنان به سناریوی خود پایبندم - هیچ چیز تغییر نکرده است. بر اساس تجربه من، قیمت در حال حاضر پیچیدهترین شکل اصلاح، یعنی ABC نامنظم را به نمایش میگذارد. در تحلیلهای اخیر توضیح دادم که چرا باید از تایم فریم ۱۲ ساعته استفاده کنیم. در این تایم فریم، Awesome Oscillator باید خط صفر را قطع کند تا اصلاح به پایان برسد. هدف برای اصلاح نامنظم معمولاً در فیبوناچی ۰.۳۸ در قیمت ۹۷.۵ هزار دلار است، اما ممکن است با یک سایه (wick) قیمت ۹۵ هزار دلار را نیز لمس کند. با احترام، ایوان اسکایرکسی ___________________________________________________________لطفاً این مقاله را تقویت کنید و اگر تحلیلها را دوست دارید، صفحه ما را دنبال کنید!
Skyrexio
Where Is The Correction For Bitcoin?

سلام اسکایرکسیانیها! اخیراً در مورد اصلاح احتمالی BTCUSDT صحبت کردیم و پامپ فعلی هیچ چیزی را تغییر نداده است، جز اهداف این اصلاح. اشتباه من این بود که موج 5 داخل 3 را به عنوان موج 5 در نظر گرفتم، اما به شما هشدار دادم که اغلب این اشتباه را مرتکب میشوم. اکنون با نگاهی به نوسانگر عالی (Awesome Oscillator) واضح است که موج 4 هنوز شروع نشده است. به هر حال، موج 3 از قبل بالاتر از 1.61 فیبوناچی پامپ شده است، این بدان معناست که موج 5 گسترش یافت. به زودی موج اصلاحی 4 آغاز شد. هدف اکنون بین سطوح اصلاحی 0.38 و 0.5 فیبوناچی، تقریباً در 95 هزار دلار است. به هر حال، گرفتن موقعیت شورت بر خلاف روند ایده خوبی نیست. تنها راهی که میتوانید از این اطلاعات استفاده کنید این است که منطقهای را مشخص کنید که بتوانید در آن معامله لانگ باز کنید، اما من این کار را انجام داد. من در یکی از تحلیلهایم دو ماه پیش، زمانی که Bitcoin 76 هزار دلار بود، گفتم که رشد بالای 140 هزار دلار شروع شده است، دوست ندارم حرکات کوچک را پیشبینی کنم. این پیشبینی کلی من بود. با احترام، ایوان اسکایرکسیو ___________________________________________________________ لطفاً این مقاله را تقویت کنید و اگر تحلیلها را دوست دارید، صفحه ما را دنبال کنید!
Skyrexio
WARNING For ATOM Holders: -50% Crash Incoming!

سلام اسکایریکسیها! همانطور که میدانید، من در چند روز گذشته مطمئن نبودم که فصل آلتکوینها شروع شده است یا خیر، و سرانجام تصمیم گرفتم که نه. سلطه Bitcoin به 67% رسید و آلتکوینهای بزرگ مانند ATOMUSDT به من این نشانه را میدهند که آلتکوینها میتوانند در 2-3 هفته آینده 50% افت کنند! بیایید نگاهی به بازه زمانی 2 روزه بیندازیم. برای اندازهگیری انگیزه، این اکنون معتبر است. میبینیم که قیمت پس از رسیدن به هدف موج 3 در موج 4 جهش کرد. موج 4 به فیبوناچی 0.38 رسیده و پس از red dot در اندیکاتور معکوس صعودی/نزولی Bar [Skyrexio] شروع به پایین رفتن کرده است. علاوه بر این، Awesome Oscillator از خط صفر عبور کرده و نشان میدهد که موج 4 ممکن است به پایان رسیده باشد. اکنون قیمت در موج 5 است. هدف 2-3.5 دلار است. من فکر میکنم در این بازار نزولی، اندکی پایینتر، در 3 دلار به پایینترین حد خود برسد که تقریباً 50% سقوط از قیمت فعلی است. با احترام، ایوان اسکایریکسیو ___________________________________________________________ لطفاً این مقاله را تقویت کنید و اگر از تحلیلها خوشتان میآید، صفحه ما را دنبال کنید!
سلب مسئولیت
هر محتوا و مطالب مندرج در سایت و کانالهای رسمی ارتباطی سهمتو، جمعبندی نظرات و تحلیلهای شخصی و غیر تعهد آور بوده و هیچگونه توصیهای مبنی بر خرید، فروش، ورود و یا خروج از بازارهای مالی نمی باشد. همچنین کلیه اخبار و تحلیلهای مندرج در سایت و کانالها، صرفا بازنشر اطلاعات از منابع رسمی و غیر رسمی داخلی و خارجی است و بدیهی است استفاده کنندگان محتوای مذکور، مسئول پیگیری و حصول اطمینان از اصالت و درستی مطالب هستند. از این رو ضمن سلب مسئولیت اعلام میدارد مسئولیت هرنوع تصمیم گیری و اقدام و سود و زیان احتمالی در بازار سرمایه و ارز دیجیتال، با شخص معامله گر است.