
Shotokhan
@t_Shotokhan

تریدر چه نمادی را توصیه به خرید کرده؟
سابقه خرید
تخمین بازدهی ماه به ماه تریدر
پیام های تریدر
فیلتر
نوع پیام
Shotokhan
ETH at resistance!

خوب ، سرانجام ETH همه برآوردگرهای خود را خوشحال می کند ، اما من می به این نکته اشاره کنم که نزدیک به ATH است ، بنابراین شاید صبر کنید تا ببینید قبل از خرید چه اتفاقی می افتد. من منتظر برخی از تنظیمات کوتاه بود مگر اینکه شکستن a Stronk وجود داشته باشد! من انتظار دارم چیزی شبیه به آنچه در آنجا ترسیم کردم. من a ETH را ندارم اما به یاد داشته باشید که پس از ETH پول در کلاه های بزرگ جریان می یابد و این ما را خوشحال می کند. موفق باشید!
Shotokhan
BTC: the breakout should be legit
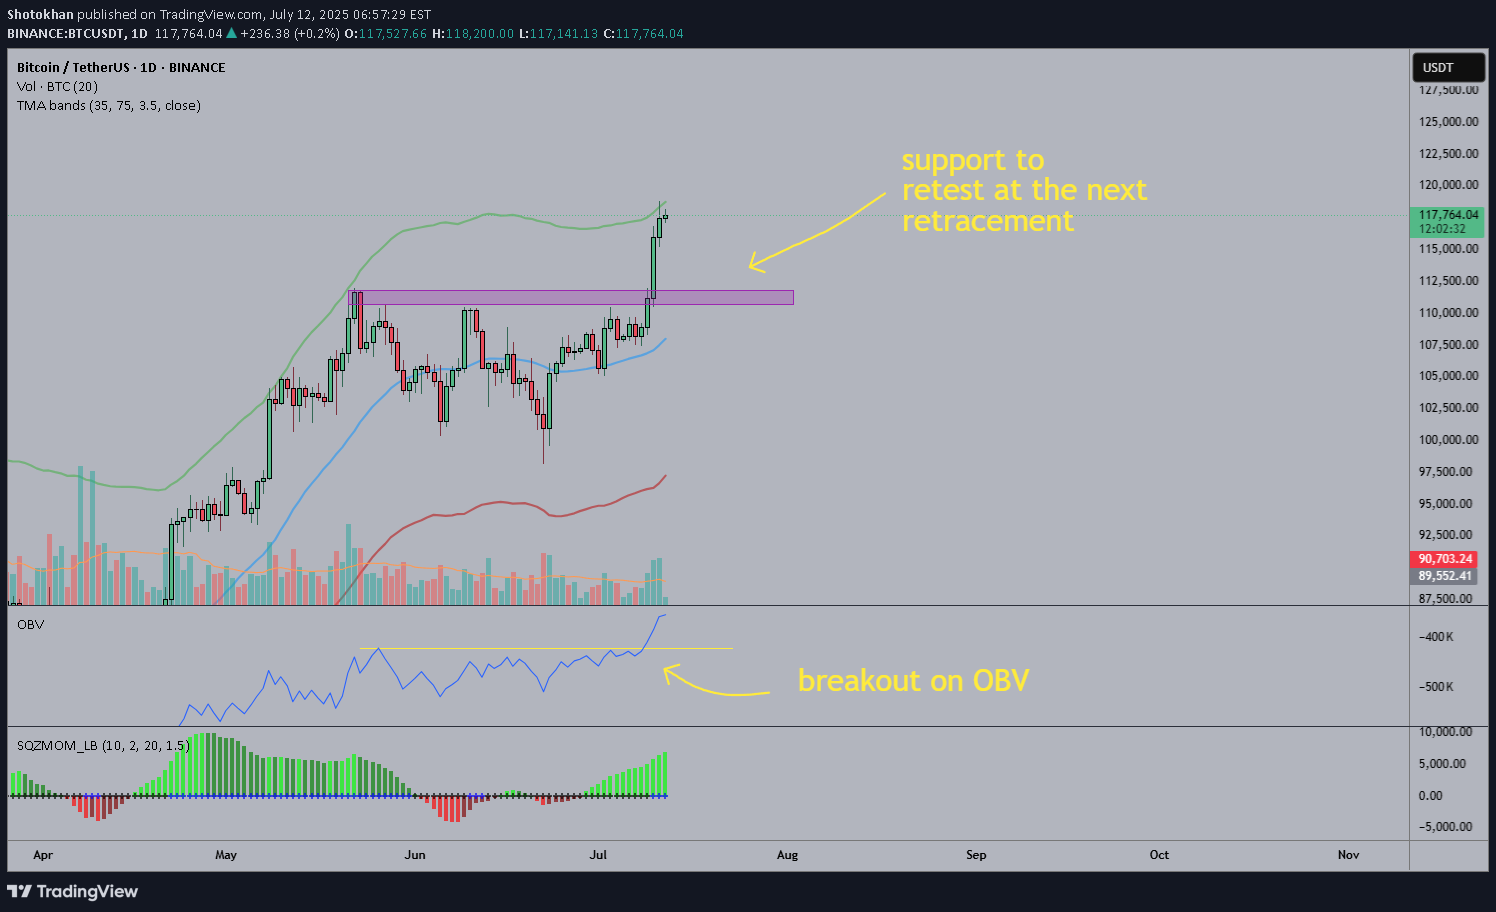
همانطور که میبینید، این شکست قیمتی با ۳ روز افزایش حجم معاملات همراه بوده و اندیکاتور OBV هم صعودی شده، بنابراین به نظر میرسد معتبر باشد. در نمودار روزانه، سقف باند TMA در حال تست شدن است، احتمالاً به زودی شاهد یک اصلاح قیمتی بود. به نظر من مقاومت قبلی، حالا تبدیل به حمایت شده و باید آن را تست کند. با این حال، اگر خوشبینی ادامه پیدا کند، ممکن است شاهد یک قله قیمتی دیگر باشیم در حالی که RSI همچنان زیر ناحیه «اشباع خرید» باقی بماند. من به دنبال فرصتهای فروش (short) بود، اگرچه معمولاً بیت کوین معامله نمیکنم. بیشتر از بیت کوین به عنوان یک شاخص برای زمان خرید آلتکوینها استفاده میکنم. موفق باشید.
Shotokhan
ETH is loading up for another run

برای کسانی که به یاد می آورند من ماهها پیش با این الگوی زیر نمودار هفتگی ارسال کرده بودم: ایده من این بود که اولین توقف آخرین بار بود ، سطح جایی که قیمت می توانست برای مدتی متغیر باشد. با وجود همه انتقادات اخیر به ETH ، من فکر می کنم ما هنوز در مسیر آن هدف هستیم. بله ، ETH کم تحرک است و راه حل های بهتر و ارزان تر در آنجا وجود دارد (مثال: Solana هزینه ها در مقایسه با ETH ارزان قیمت هستند) اما همه اینها مهم نیست زیرا در نهایت به هر حال پمپ شد. همانطور که می بینید در قیمت روزانه یک مثلث نامتقارن (الگوی ادامه) و RSI و Divs های صعودی موجود تشکیل شده است. در عوض ، فشار را فشار دهید. اگر درست است ، شکستن باید قیمت را به روزنامه R و از آنجا به ATH برساند. من فکر می کنم لحظه خوبی برای خرید ETH است ، حتی اگر ETHBTC را بررسی کنید ، می توانید ببینید که این نوع پایین است و من نمی بینم که آن را بیشتر از آن خط (حداکثر -16 ٪) منحرف می کند (حداکثر -16 ٪) در حالی که دارای یک پتانسیل صعودی عالی به سمت بالا است: اگر BTC بالا از 150 یا 170 باشد ، این مقاومت به معنای ETH باید بین 12.3k تا 15k USDT باشد. موفق باشید! P. S. از نظر FA بیشتر ، من مشکل gas Ethereum را یک مورد بزرگ می دانم. ویتالیک سالهاست که آن را برطرف کرده است و او به معنای واقعی کلمه هر کاری را انجام داد ، اما این چراغ سبز را به رقابت می بخشد. این به همین دلیل است که من در Ethereum blockchain و دلیل خرید SOL و SUI به جای ETH تجارت نمی کنم). اگر ویتالیک هری نکند ، برای گرفتن ETH خیلی دیر شد (نه این که من اهمیت می دهم).
Shotokhan
BTC: broadening wedge or channel retest? Bullish or bearish?

در حال حاضر سه الگوی ممکن در شکل گیری وجود دارد که دو مورد از آنها صعودی و یک نزولی است. من 100 ٪ در کدام یک انتخاب نمی کنم ، بنابراین سه مورد را در اینجا ارائه می دهم. [1] گوه گسترده زاویه دار (مورد صعودی): - پیوندهای زیر را بررسی کنید https://www.forex-central.net/chart-patterns/right-angled-broadening.php وت https://www.centralcharts.com/en/gm/1-learn/7-technical-analysis/27-chart-patterns/522-Right-Angled-Descending-Wroading-DegeDege در این حالت باید انتظار داشته باشیم که یک زباله به سطح 86K و سپس یک گزاف گویی به شکست و فشار قیمت به 125k: [2] گوه گسترده ای زاویه دار (مورد نزولی): برای مثال به پیوندهای قبلی مراجعه کنید. در این حالت ، پشتیبانی گوه باعث شکستن و آوردن قیمت به منطقه 75K نمی شود. توجه کنید که مقاومت بالایی گوه نیز دو برابر دو برابر را نشان می دهد که یک الگوی بسیار نزولی است: [3] کانال نزولی مجدد: برای این مورد من از نمودار Coinbase استفاده کرده ام ، فقط به این دلیل است که نمودار کمتر کثیف است. همانطور که می بینید که این اتفاقات از چند روز پیش اتفاق افتاده است و این می تواند آزمایش مجدد R. باشد. این یک مورد صعودی است که باعث می شود قیمت قیمت به 109k برسد در حال حاضر من نمی دانم کجا باید لاغر شوم زیرا روده من می گوید بازار نسبت به این هیاهو بیش از حد واکنش نشان می دهد ، بنابراین من به هر امکان باز می مانم و هیچ تجارت حاشیه ای را انجام نمی دهم ، فقط خرید آنچه فکر می کنم پتانسیل دارد. موفق باشید
Shotokhan
ENS bouncing after retest

ENS از یک گوه در حال سقوط بیرون آمد ، با موفقیت آن را دوباره انجام داد و گزاف گویی کرد. این همان الگوی DOT است که من دیروز ارسال کردم و صادقانه این روزها الگوی بسیار گسترده ای است. متفاوت از DOT ، در این حالت ENS به دنبال ETH و به نظر می رسد ethereum از خواب بیدار می شود ، و به شدت در ارتباط است ، به احتمال زیاد آنها هر دو بالا می روند. ویتالیک ماهها پیش اظهار داشت که ENS super برای ethereum اکوسیستم مهم است. خیلی ها از ETH ناامید شده اند ، اما من معتقدم که در بعضی مواقع از خواب بیدار می شود و من هرگز آن را تجارت نمی کنم ، اما کاملاً منطقی است. ماهها پیش در W من چیزی شبیه به این را پیش بینی کرده بودم و هنوز هم فکر می کنم ممکن است: آنچه من می دانم این است که من به جای ETH ENS را خریداری کردم زیرا فکر می کنم می تواند ROI بالاتری انجام دهد که همان چیزی است که به من علاقه مند است. من فکر می کنم شما هنوز هم می توانید با قیمت فعلی وارد شوید. فقط نزدیک به منطقه مقاومت در آنجا خریداری نکنید. من فکر می کنم اولین هدف واقعی پس از استراحت از منطقه مقاومت 66 و 88 USDT بود موفق باشید
Shotokhan
BTC: correction incoming

بهره باز و RSI در Div Bearish است و قیمت مدتی در اینجا گیر کرده است. بعد از پمپاژ زیاد ، فکر می کنم وقت آن رسیده است که یک اصلاح جدی انجام شود. من دو مسیر ممکن را می بینم ، بیایید ببینیم کدام یک بازی می کند. نمودار D مانند خسته به نظر می رسد: موفق باشید
Shotokhan
GALA: another awakening pattern

این شگفت انگیز است وقتی که در اطراف بسیاری از مثلث صعودی می بینید ، این بدان معنی است که Cryptomarket بیدار می شود و Altseason آغاز می شود. برخی می توانند بگویند که این اتفاق در حال حاضر اتفاق افتاده است اما فکر می کنم هنوز این کار را نکرد ، وقتی می بینم که شمع در حال بسته شدن در این منطقه است ، احساس اطمینان بیشتری می کنم. من فکر می کنم هنوز یک منطقه نسبتاً safe برای خرید است. حتی اگر این راه دور شود ، طولانی بود. بازی Crypto بسیار بزرگ بود ، حتماً چیزی را در کیف خود داشته باشید. هفتگی نیز خوب به نظر می رسد: موفق باشید
Shotokhan
ETH broke out, ATH is next target

ETH در یک سرنشین صعودی بود که هفته ها پیش از آن شکسته بود اما واقعاً پس از انتخابات ایالات متحده شروع به حرکت به سمت هدف خود کرد. من به اهداف الگوی چیز زیادی اعتقاد ندارم زیرا در تجربه من خیلی اوقات به آنها نرسیده است ، اما با توجه به اینکه این بار هدف با آخرین Ath همزمان است ، فکر می کنم به احتمال زیاد به آن رسیده است. این فقط اولین قدم بود ، من فکر می کنم ETH باید تا 10-12k برسد. من معمولاً تجارت نمی کنم ETH اما فکر می کنم در نهایت 3-4 برابر می کند. اگر مجبور به خرید هستید ، پیشنهاد می کنم از آنجا که 7 روز پشت سر هم پمپ شده است ، خرید کنید. موفق باشید
Shotokhan
PYTH still hasn't awakened

PYTH با وجود کل Solana اکوسیستم به دنبال خود SOL خود را پمپاژ نکرده است. عجیب است زیرا همه ما انتظار داریم که این LINK جدید باشد. می باور کنم که دیر شروع می شود اما به دست می آید. من خط و منطقه مقاومت را ترسیم کردم تا به شما نشان دهم که قیمت در حال حاضر به نوعی مثلث صعودی است. من این ALT را در نظر می گیرم که قیمت آن منطقه مقاومت در آنجا را از بین می برد. همانطور که از نمودار هفتگی می بینید شمع های اخیراً بسته شده است ، امیدوارم که این یک قیمت علامت باشد hit مقاومت به زودی اگرچه صادقانه باشد ، در بازه زمانی روزانه یک بخش نزولی روشن در RSI وجود دارد با درپوش فعلی بازار حدود 1.5 میلیارد PYTH می تواند به راحتی 10 برابر از اینجا انجام دهد و این یک هدف محافظه کارانه است. من قبلاً یک کیسه کوچک دارم اما هنوز در منطقه خرید هستم. توجه: این یک TA در اواسط تا بلند مدت است. موفق باشید
Shotokhan
UMA deserves more credit and hype

بزرگترین بازار پیش بینی فعلی (Polymarket) از UMA بهره می برد و هیچ کس در این باره صحبت نمی کند. برای من این دیوانه است زیرا بدون قیمت اعتیاد به مواد مخدره نشان دهنده اهمیت این پروژه نیست. این پشتیبانی برقرار شده است ، من فکر می کنم ما فقط به یک کانون توجه نیاز داریم! هفتگی: چه موقع/اگر مردم متوجه شوند که چقدر خوب کار می کند این کار را باید به خوبی انجام دهد و پمپ کند! من یک کیسه از این دارم. موفق باشید
سلب مسئولیت
هر محتوا و مطالب مندرج در سایت و کانالهای رسمی ارتباطی سهمتو، جمعبندی نظرات و تحلیلهای شخصی و غیر تعهد آور بوده و هیچگونه توصیهای مبنی بر خرید، فروش، ورود و یا خروج از بازارهای مالی نمی باشد. همچنین کلیه اخبار و تحلیلهای مندرج در سایت و کانالها، صرفا بازنشر اطلاعات از منابع رسمی و غیر رسمی داخلی و خارجی است و بدیهی است استفاده کنندگان محتوای مذکور، مسئول پیگیری و حصول اطمینان از اصالت و درستی مطالب هستند. از این رو ضمن سلب مسئولیت اعلام میدارد مسئولیت هرنوع تصمیم گیری و اقدام و سود و زیان احتمالی در بازار سرمایه و ارز دیجیتال، با شخص معامله گر است.