
NoOneWhoIsSomeone
@t_NoOneWhoIsSomeone

تریدر چه نمادی را توصیه به خرید کرده؟
سابقه خرید
تخمین بازدهی ماه به ماه تریدر
پیام های تریدر
فیلتر
نوع پیام
NoOneWhoIsSomeone

در طول تاریخ ، همیشه می توان به عقب نگاه کرد و دوره زمانی مانند "جنگ بزرگ" ، "افسردگی بزرگ" ، "دوران مترقی" ، "عصر طلاکاری" و غیره را طبقه بندی کرد. هیچ فکر شناختی وجود ندارد که بتواند مشخص کند که ما در یک دوره تاریخی هستیم تا اینکه به آنچه که به عنوان عقب شناخته می شود برسیم. یک نکته مهم تأمل در گذشته که به شکلی که قبلاً امکان پذیر نبود ، روشن می شود. این پویا دقیق به همین دلیل است که نمودارها و نمودارها در پیش بینی آینده بسیار مهم هستند ، بلکه با در نظر گرفتن یک درک محاسبه شده بدون این اطلاعات امکان پذیر نیست. بنابراین ، بیایید از این اطلاعات به نفع خود استفاده کنیم. در اینجا فقط چند واقعیت تاریخی آورده شده است: ~ هیچ بازار خرس در تاریخ قبل از رکود به پایان نرسید ~ هیچ بازار خرس در تاریخ با نرخ افزایش فدرال رزرو به پایان رسید ~ هیچ بازار خرس در تاریخ قبل از محوری فدرال رزرو پایان یافت ~ هیچ وارونگی مداوم در بازار خرس توسط رکود اقتصادی دنبال نشده است (US10Y-US02Y از ماه ژوئیه معکوس شده است) و (US10Y-US03M در ماه اکتبر معکوس شده است). هفته گذشته رئیس جمهور بایدن اظهار داشت: "اقتصاد ایالات متحده در حال گسترش است و درآمد سریعتر از تورم افزایش یافته است". خوب خوب ، دو چیز: اول ، در اینجا یک واقعیت ساده اما تأثیرگذار وجود دارد. از آغاز سال جاری ، ضرر و زیان بازار سهام 9 تریلیون دلار از ثروت آمریکایی ها از بین رفته است cnbc.com/2022/09/27/stock-market-losses-wipe-out-9-trillion-fromericans-wealth-.html دوم ، اگر دستمزدها سریعتر از تورم در حال رشد هستند (تورم در مقایسه با 40 سال گذشته به صورت نمایی رشد می کند) ، پس چرا data شکاف عظیمی بین هزینه های نیروی کار و سود شرکت ها نشان می دهد؟ epi.org/blog/corporate-profits-have-contributed-dispratety-to-inflation-how-should-policymakers-reponse/ بهترین کار برای دیدن data برای خودتان است ، اما در اینجا یک قطعه وجود دارد: سود شرکت- (2020 Q2-2021 Q4 = 53.9 ٪) و (1979-2019 = 11.4 ٪) هزینه کار واحد- (2020 Q2-2021 Q4 = 7.9 ٪) و (1979-2019 = 61.8 ٪) این تقریباً 155 ٪ اختلاف در جهت اشتباه است. (هزینه کار واحد) این دقیقاً همان پویا دلیل اصلی افسردگی بزرگ در وهله اول بود. سود شرکت در حالی که دستمزد نیروی کار بسیار عقب مانده بود ، بزرگتر شد. این نه تنها منجر به فروپاشی کامل هزینه های صنعتی شد بلکه اقتصاد را به تقریباً یک دهه بدبختی و میانه روی محکوم می کند. بیایید به مهمترین قسمت پست که شاخص رکود اقتصادی مورد نظر فدرال رزرو است ، حرکت کنیم. (US10Y-US3M). سرانجام از سال 2000 هشدار رکود اقتصادی را به دست آورد. این را با بحران انرژی در سراسر جهان جفت کنید که همچنین سیگنال های رکود بسیار معتبری را نشان داده است: همچنین به خوبی شناخته شده است که بازار مسکن اکثریت ثروت فردی را در خود جای داده است ، بنابراین بیایید نگاهی بیندازیم که در آن قرار دارد: این نمودار از دیدگاه فنی تقریباً پس از افزایش قیمت مسکن تقریباً 27 ٪ پس از بهبودی 2020 ، تقریباً 27 درصد را تضمین می کند. نگاهی به RSI جفت شده با شتاب سریع به صعود بپردازید. آنچه در زیر می آید ، حداقل در محلی کاملاً واضح است. به اندازه کافی جالب ، یک اوج محوری/تورم تغذیه شده از محبوب ترین روایاتی است که در آن عبور می کنند و از نظر چهره آن معقول است ، اما هنگامی که شما عمیق تر می شوید موضوع چیزی را به جز حس می کند. بگذارید توضیح دهم: در اینجا تورم با نرخ صندوق فدرال پوشش داده شده است: همانطور که می بینید ، نه تنها فدرال رزرو حزب در مورد سیاست برای مبارزه با تورم (احتمالاً عمدی به دلیل بدهی نمایی) دیر شد ، بلکه تا زمانی که نرخ بهره با سطح تورم مطابقت نداشته باشد ، زمانی نبود که تورم واقعاً به اوج خود رسید. این امروز برآورده نشده است. علاوه بر این ، بیایید ببینیم چه اتفاقی می افتد پس از محوری فدرال رزرو و دوباره کاهش نرخ ها را شروع می کند: باز هم ، اگر متوجه شدید زمانی که فدرال رزرو شروع به کاهش نرخ می کند ، بازار به روشی که عموم مردم انتظار دارند امروز واکنش نشان دهند ، انجام نداد. این یک گزاره ضد انعطاف پذیر است زیرا مثبت است که سیاست پولی مطلوب تر است اما چرا فدرال رزرو نرخ کاهش می یابد؟ به احتمال زیاد به دلیل ضعف اقتصادی. اگر فدرال رزرو با اطمینان پیاده روی کند ، این بدان معنی است که اقتصاد هنوز دست نخورده است و قادر به حفظ تأثیر است. این پویا توسط اکثریت زیادی از شرکت کنندگان در بازار از دست رفته است. یک مورد که می در آخرین نمودار به آن توجه کنم ، شکستن روند 40 ساله سیاست پولی است. ما این شکست را در تمام نمودارها نشان می دهیم که بازده/نرخ را از نظر بخش های دولتی نشان می دهد. به عنوان مثال ؛ در اینجا US10y است: شکستن یک روند 40 ساله و همچنین وام با نرخ ثابت 30 ساله دقیقاً همان کار را انجام می دهد: این برای من نشان می دهد که ما در یک دوره انتقالی تاریخی هستیم. اگر در واقع اینگونه باشد ، این بدان معنی است که ما از روند قدیمی به یک روند جدید منتقل می شویم. حال بیایید در مورد حداقل 20 سال گذشته فکر کنیم. این QE نجومی و چاپ پول بی پایان است که امروز ما را به ارمغان آورده است. در سمت تلنگر این سکه چیست؟
NoOneWhoIsSomeone

This is going to be a very extensive post so it will take some time to fully grasp most of these concepts but I am going to try my best to explain my perspective of the current economic landscape and what implications certain factors can have going forward. First, let us look at the Original Chart in the post and explain it: As you can see I have laid out the Resistance and 3 different layers of support. One local support at ($3850) and Two long Term Supports at ($3400) & ($2850) respectively. Current Criteria: IF the price pushes past the current Resistance labeled in the chart , I expect more upside over the next few weeks to months as the market expands and ignores recession fears for now. Remember, in this scenario, markets can remain irrational FAR longer than you can remain solvent. IF the price rejects off of this Resistance , it highly suggests Local support will be tested and if that is lost then the two long-term supports will come into play. I have labeled why the price would make it there and where the sentiment would likely be in this scenario. Now let's try to understand the current Recession Delima and where we stand: Today we live in a world where the past isn't considered a measure. To be a historian today would mean you would be doubted by most, saying "This time is different", "Past performance is not indicative of future performance", "Dinosaurs didn't exist", Etc etc. Our perception of the world and the lives we live are constantly changing. This new digital Era has connected the world in ways never seen before in humanity. So inherently, the way we think, what we believe, and how we anticipate the future has changed and is ever-changing. So much so, that even the most basic understanding of an economy comes into question. Over the last week, we have seen the "Definition" of a Recession be explained in vastly different ways. To such an extent Wikipedia actually blocked any edits in relation to the actual definition. The White House has downplayed Recession fears repeatedly and we have heard Powell mention a "Strong economy" just about every time he has spoken. Let us ask ourselves this first; what were these same people saying before the snowball actually started to roll down the hill? "Inflation is transitory", "No Recession Risks". Today we find this guidance to be incredibly misleading and incorrect. "But no one could have predicted this".... Wrong. Many people saw the red flags and predicted the tailwind effects of these dynamics. Even if the ones in power ultimately know, they can never let us in on the "know". If you've ever run a company or led any kind of extensive group, there are information highways. Certain information goes to certain groups, while others are left in the dark. Think of us, the regular working-class individuals, as the group that's left in the dark. Governments are run on the base concept of the people do not know what's best for them so we created a system that we believe will lead to better decisions for the betterment of society. A real downside to this reality is that there will always be a communication deficiency between the Government and the People. This is where the strange Re-Definition of a Recession comes into play. A commonly accepted definition of a Recession is simply, Two or more Quarters of Negative GDP Prints. We have seen just that. Although this isn’t the end all be all definition, it is one check mark down. "Real gross domestic product (GDP) decreased at an annual rate of 0.9 percent in the second quarter of 2022, following a decrease of 1.6 percent in the first quarter. The smaller decrease in the second quarter primarily reflected an upturn in exports and a smaller decrease in federal government spending". bea.gov/data/gdp/gross-domestic-product But US President Biden rejected the idea that the U.S. is in a recession, and instead touted continued job growth, low unemployment, and growing investment from manufacturers. Sure these are valid reasons, but WHY is that the case? Is it from pure organic growth or is it coming after the complete shut down of an entire country for 2 years? To put the job growth into perspective, we aren't even back to 2020 Employment levels before Covid hit: tradingeconomics.com/united-states/employment-rate So to play their game, What exactly is the definitely of Job Growth or Strong Employment? You see, words and data can be very misleading. This is why, "Don't trust, but verify" is crucial to surviving in this world. If you're waiting on someone to give you a warning or for someone to give you the official green light on something, you'll hear about it after it's already too late. It is very likely if there is a true Recession coming, most officials won't claim it so until we are already about 25% into it. We may very well look back on today a year or two from now and think, "It was so obvious". Now that we have covered the psychological aspect of the situation, let us look at it objectively and with some charts. Here I will first show a comparison between 2000 and 2008: This shows the Price Action of both 2000 and 2008 leading up to the ultimate wipe-out of the economy. I have labeled the percentage (%) of Drawdowns relative to both the peak and the rejection off resistance. These percentages can prove important because it reflects a potentially pivotal point in which the market finds a new Fair Value. Now, if we look at our current position, you can see just how similar the Price Structure is. Price has seen a significant breakdown and then followed up with a retest of this support that has now turned resistance. I have labeled the same percentages as 2000 & 2008 just so the comparison can be made and why these levels are truly significant: We are currently seeing the retest of the lost support, which occurred both in 2000 and 2008 very similarly. Although it is not guaranteed to repeat, it is something significant to note nonetheless. Next lets look at the US10Y-US01Y which has been a signal for the last 6 Recessions, which occurs after there has been a significant Yield Inversion: (I have outlined each time we have seen the beginning of the inversion so what happens after can be perceived) If you look at the chart, you can see there has been a significant inversion after inverting for a very short time back in March. We haven’t seen an inversion of this caliber since 2000 and 2008. To further support this development, if you just look at the US10Y, you can see it has once again parabolically rallied from its sharpest drop to its strongest impulse up to reach the historical trend line: I have labeled what has occurred following this development, as well as showing SPX in relation. Pay attention to each RSI level as well. Okay? So What? You can also say there have been gains after an inversion occurred… Sure this is true, but ask yourself this, are you prepared, and do you have a well enough plan laid out to properly secure those profits when the time comes? You have to remember, timing is absolutely everything so while an Index may have a 10% rise overall if you didn’t buy the absolute bottom, that 10% would actually be more like 5% or 6% for you. Furthermore, unless you sell with the right timing, those profits are not secured. Let's lay out some quick math because this concept seems to be missed by quite a few. Let us say an index goes from 1,000 to 6,000 and generated a 500% return on your money. Great. So now why worry about just a correction when you are up 500% already? Well, here's a reason… A 50% correction from this level does NOT leave you with a 450% gain. Instead, a 50% correction subtracts 3,000 points, reducing that 500% gain to just 200%. Then the problem becomes of regaining those lost 3,000 points to recover lost profits or to cut and make sure that the last 200% profit is secured. Long story short, profits are not profits until you sell. End of story. These decisions could mean early retirement or no retirement. I know this is a really extended post but let's touch on just a few more things I deem very important. Let's take a look at the Dow Jones (DJI) and see where it stands: Here you will see a very similar approach in a few other charts below where I have labeled the Deviations from the original trend which marks a “Blow off the Top” type of event. Whenever the value is extended beyond usual terms, is when the chances of a significant reversal increase. It marked warnings for both 2000 and 2008. Next, let's look at an aspect of the Housing Market which would be the Average Sales Price of Homes sold in the US: As you can see I have once again labeled a possible Deviation. This along with the massive RSI Divergence building over a 40-year period, the “Safe Heaven” of the housing market may not be as bulletproof as most would believe. Furthermore, let's analyze the 30-Year Fixed Rate Mortgage Average in the US: We have seen the sharpest impulse in Fixed Mortgages since 1980 and a possible break of a 40-year downtrend. What exactly would that mean for new homeowners over the next 20 years? Moving on, let's look at the VIX and what it can mean for the market: A general rule of thumb is if using the VIX as a reference, you want to look for positions when VIX is at significant resistance (Or after a parabolic rise) and you want to exit positions/use caution when VIX is at support. This is very prevalent in thinking Medium/Long term. As you can see the VIX has been steadily trending upwards since February of 2018 and I have labeled other points in time for reference. Here’s a small reference to DXY which has had a historical rally in a time that no one really expected: As you can see there has been a breakout of very important resistance, and if DXY holds strength and investors continue to value the dollar in ways not consistent in the past, liquidity will remain dry in relation. Now, let's talk about USOIL which holds a significant % in CPI changes. If Oil/Energy continues to climb here over the next few months then so will CPI. If Oil falls below its deviation zone, then CPI will likely subside for some time before any significant changes. Here is a reference to see this deviation level with respect to the SPX: I have marked every time USOIL lost this level to see possible effects. This does not mean the "Inflation Peak" narrative is one of any substance. Inflation peaking will not inherently change anything as it will take most likely Years to get Inflation down to FED target of 2%. So the actual strain of inflation on most of society will remain even despite an inflation peak. In fact, If CPI prints at 0% every single month between now and December, we will still finish 2022 with 6.3% YoY inflation. Also, in 2000 and 2008, it wasn't until after USOIL lost its deviation zone is when the worst was seen in the economy. Remember again, all those that said Inflation is "Transitory", "Controlled", and "Peaking" were all dead wrong. Remember that despite the consensus and despite leadership, the SPX Year-To-Date Performance (In Real Terms) is the WORST since 1872. That may sound extreme but check for yourself (Source: BofA Global Investment Strategy, Bloomberg). Please keep in mind even if Markets continue to rally, DONT forget where we are and where we were. As everyone has said this would be the most anticipated Recession of all time, it will likely be when everyone either forgets about it or expects the worst is over, which is when the Recession actually hits. Stay Focused. To further understand more about the current Economy I will refer you to my last extensive post on the SPX which I will link here below: This post expands on things I do not touch on here and will give greater insight overall. Most information is complementary to each other from post to post, so the more you understand about one, the more you will understand about the other. If you've made it this far into the post I would like to Thank You immensely for taking the time to read the analysis. My goal is to expand thought and perspectives to hopefully give a greater understanding of the current situation. Please let me know if there are any questions, as I would be more than happy to answer or converse on the subject. Again, Thank you!
NoOneWhoIsSomeone

من منتظر ارسال بروزرسانی در BTC هستم زیرا تحولات چشمگیر در فضا وجود دارد. ما سرانجام شاهد کاپیتولاسیون من در طی چند ماه گذشته بودیم و اکنون زمان آن رسیده است که دوباره ارزیابی کنیم. آیا ما به پایین بلند مدت رسیده ایم ، آیا به زودی به اوج های جدید جدید می رود؟ به احتمال زیاد ، نه Crypto برای اولین بار در طول زندگی خود خود را در وسط یک بحران اقتصادی قرار داده است. نه فقط یک بحران در یک کشور بلکه کل جهان. این منجر به فروپاشی لونا ، که تأثیر گذاشت سه فلش سرمایه برای ورشکسته شدن ، همراه با Celcius تمام دارایی ها را انجماد می کند و تمام سرمایه ها را از هر کسی که دارای حساب باشد قفل می کند. شما می توانید این موضوع را به عنوان FUD ارائه دهید اما من به شما یادآوری می کنم که این رهبران صنعت هستند. پیشگامانی که قرار بود تکامل رمزنگاری را هدایت کنند ، اما حرص و طمع را بر سلامت آینده انتخاب کردند. اینها فقط مواردی هستند که ما در مورد آنها می دانیم ، اثرات موج دار احتمالاً برای مدتی آینده waves ایجاد می کند. 100 میلیارد میلیارد نفر در این فاجعه از دست رفته بودند. این توسط کل بازار بازار در اینجا نشان داده شده است که خود را در 200 W کارشناسی ارشد با 75 درصد حیرت انگیز پیدا کرده است: و ما حتی در "رکود" نیستیم. پیش بینی ها به 50 ٪ احتمال رکود اقتصادی اجتناب ناپذیر رسیده است. برای اینکه به طور عینی به اوضاع نگاه کنم ، نمی پیش بینی های hard را انجام دهم ، بلکه در حال حاضر معیارهای تمیز برای صعود کوتاه مدت یا نزولی را ارائه می دهم. اگر به نمودار بالا نگاه کنید ، من یک کانال آبی را تشریح کرده ام که برای BTC بسیار مهم است. اگر قیمت موفق به بستن بالای کانال آبی شود ، احتمالاً صعود کوتاه مدت نیز وجود دارد. اگر قیمت بتواند زیر پایین کانال آبی بسته شود ، احتمالاً روند نزولی کوتاه مدت نیز وجود دارد. دو روش برای ترسیم این نمودار وجود دارد ، هر دو سطح یکسان را نشان می دهند اما چیزهای کمی متفاوت را پیشنهاد می کنند: اگر در این مورد توجه کنید ، می توانید ببینید که در حال حاضر یک نقطه BTC چقدر بد است. این نه تنها از پایین کانال در حال اعتراف که در آن قرار داشت شکسته شد ، بلکه اکنون به سختی این منطقه را مجدداً آزمایش می کند. اما باز هم ، معیارها یکسان هستند. این زمانی است که چیزهای خارج از رمزنگاری همچنان بر فضا تأثیر می گذارد ، بنابراین اگر شما در حال حاضر چشم انداز خود را بر روی عناصر مرتبط با رمزنگاری قرار می دهید ، چند ماه آینده را پیدا کرد+ بسیار گیج کننده است. من متوجه می شوم که من این پست را ترک کرده ام که حاکی از آن است که نیروهای خارج از کریپتو می در بازار وزن خود را ادامه دهم ، بنابراین فکر می کنم Id <8 8> آنچه را که من از آن استفاده کردم. امیدوارم که این دیدگاه بیشتری داشته باشد: همانطور که می بینید ، قیمت هنوز هم تحت مقاومت آویزان است که مکانی وحشتناک برای ماندن BTC است. این بدان معناست که در تصویر بزرگ ، دومینوها هنوز آماده ادامه سقوط هستند. به نظر نمی رسد که به پایان هر چیزی رسیده ایم ، و من هنوز هم فقط سعی در حرکت در آبها دارم. مدتی از آخرین پست های من گذشته است اما باور کنید یا نه ، خیلی تغییر نکرده است. اگر هر چیزی با وارونگی دیگری US10Y-US02Y که اساساً رکود اقتصادی تمام عیار را تضمین می کند ، کمی بدتر شده است. بله ، شما این حق را خوانده اید ، ما حتی به طور رسمی رکود اقتصادی را "وارد" نکرده ایم. من می بینم که "پایین در" یا زمان "تجمع" است. من کاملاً معتقدم که زمان پول آسان در سال 2021 به پایان رسید. آنچه مردم پس از رونق 2020 انتظار داشتند ، انتظارات را در سراسر هیئت مدیره رنگ کرده است. این یک بازار پول گنگ است که خرده فروشی در تلاش برای front هر شیب دارد ، اما چیزی که باید بفهمید "پول هوشمند" می داند که این اتفاق می افتد ، و به جای مبارزه با بازار ، آنها در حال طعمه خریداران خرده فروشی هستند. آنها را طعمه می زنند ، و سپس آنها را پاک می کنند ، بشویید و تکرار کنید. هیچ کس نمی داند بازار به کجا هدایت می شود ، اما ما احساسات و عادات انسانی را می دانیم. فقط می خواستم چند کلمه برای به روزرسانی ارائه دهم تا نشان دهد طرز فکر من کجاست و من در حال توسعه تحلیل بیشتر هستم. در زمانی مانند امروز که مطمئناً در کتابهای تاریخ پایین می آییم ، من اعتقاد ندارم که یک ton پست ها به هر کسی در خدمت هرگونه عدالت است. این جزئیات مهم و بسیار خاص است که مهم است. با ما همراه باشید!
NoOneWhoIsSomeone

Anyone who has followed me for a while has already seen some iteration of this chart, but I bring it up again today because it has proven to be one of the most reliable charts to date. It is essential to understand when we are looking at charts, sometimes it is not about the actual chart itself but rather what the data means and the implications. We are in unprecedented times. The FED is behind the curve and now they are trying to gain back control of the Inflation Train but there is only one problem; The train has already left the station. Prediction after prediction of Inflation is "Transitory", "Peaking", "Controlled". They even have gone as far to say Inflation was a "good" thing. https://www.washingtonpost.com/opinions/2021/07/22/republicans-are-scaremongering-about-inflation-derail-democratic-agenda/ https://www.forbes.com/sites/georgecalhoun/2021/05/01/the-inflation-scare-doesnt-match-reality/?sh=7bcc94c71049 https://www.cnbc.com/2021/06/26/inflation-looks-bad-now-but-its-pretty-much-sticking-to-the-script.html This one in particular used to be Titled "Why the inflation we're seeing now is a good thing" But they have since changed that to something more cryptic as if we the people are dumb: https://www.msnbc.com/opinion/how-covid-became-unlikely-hero-our-inflation-crisis-n1283443 I just wanted to establish that before I went any deeper. Credibility is not seen in today's world. Currently, Total Revolving Credit is at a historical all-time high by a long shot. (Please go check out a chart representing this data) It not only represents the hardship most are suffering but it solidifies the fact that most can't maintain their current lifestyle with cash. As financial situations grow tighter, it forces people to then start running their credit in the face of the "Recession". This is not only bad for now but it condemns the future as well. Because that problem is only solved by rapid economic deceleration or by propping the market back up with Easy Monetary Policy. But there is a critical issue here, the FED can't possibly pivot Dovish now. Their party has only just started. QE/Stimulus, paired with Macro cyclical patterns, and Geopolitical tensions force the FED to stay the course. If they pivot now, not only will no real problem be solved, but it will inherently make them worse. Back on the Credit Delima, we have also seen the sharpest credit impulse contraction in 10 years. Liquidity runs all markets, when liquidity is dried, it causes mayhem. Okay so what about USOIL and why is it on the chart? Well as you can see, each time USOIL has significantly deviated from its current trend, it has led to a recession. 6 Times in the last 20+ years has this perfectly signaled economic hardship. This time is no different. Even further still, 2 out of the last 3 times, it was not until after USOIL has peaked is when the most pain was to be had. Combine this with 50 Year High Inflation, War, FED hiking into a slowing economy, QT, Supply Chain shocks, Sanctions/Embargoes, Energy soaring, and Gas at $4-5 in every state in America for the first time in history. Ask yourself this, if this recipe isn't enough for concern, what exactly is? Continuing on, let's focus on a few other charts: First, let's just take a look at where SPX & NDQ currently stand: As you can see, both have only just now reached Mid-Channel and still have quite a ways until the bottom of the channel. Second, let's remind ourselves of the US10Y-US02Y Curve inversion that took place a few months back. This inversion has predicted the last 6+ Recessions, just as the exponential rise in Energy has. Here is my first post explaining this correlation with SPX: Here is an Updated View: As you can see, it may even be headed for a second Inversion which would likely be another huge red flag. Third, Lets look at the Tech Leader AAPL and see where it stands. AAPL represents the leader of the tech market and where AAPL goes, the market goes. Here is my most recent post: Fourth lets look at the DXY and consider where it stands. It currently is in the midst of a 30+ year breakout, further proving the economic hardship most are facing. Furthermore, in times of great fear and inflation, money is usually the last thing people want but yet here we see the opposite playing out. Complete deviation of a regular historical trend: And Fifth, let's just speculate on the worst possible outcome here, which I did a little while back when I Noticed Elon Musk somehow timed the exact top in the Market (See for yourself below): I thought his perfect timing was really strange and led to the credibility of his words. Although the chart seems extreme now, from a technical standpoint it absolutely is possible as I've laid out. Although it's important to consider the worst, it is critical you don't expect the worst. Many things can change between now and the end of the year which is why it is important to stay updated and pivot when needed. I can honestly go on about specific factors such as the housing market and the VC's/Hedge Funds controlling supply while cutting out the regular buyer. Not to mention companies like Zillow doing the same exact thing, basically acting like a Broker to the overall housing market. Cutting out an entire class of buyers because theoretically, they don't ever have to sell to regular families just trying to buy a home. Global food shocks from inflation make fertilizer unaffordable to harvest the right yield of crop. As well as the Ukraine War making it even more difficult. China causing supply chaos because they have locked down their country again, 2 years into the pandemic. This thesis is only valid in the scenario it takes far longer to tackle these challenges listed above. If the FED and the overall World Economy can begin to tame these challenges better than what we have seen thus far, things will begin to become more positive. No matter what, these challenges must be solved not only for the health of the economy but for the betterment of the people. If you've made it this far, I thank you immensely and you will be rewarded for putting in the effort now to understand the big picture. Leave any opinions below;As we have seen, Markets continue to weigh CPI expectations and a FED "Reversal" but price steadily ranges lower. It means in the big picture, the dominoes are still ready to keep falling. We do not seem to have reached the end of anything, and I'm still just trying to navigate the waters. It's been some time since my last few posts but believe it or not, not much has changed. If anything things have gotten a bit worse with yet another US10y-US02y inversion which basically guarantees a full-blown recession. Yes, you've read that right, we haven't even officially "Entered" the Recession yet. I see over and over "Bottom is in" or time for "Rally". I wholefully believe the time for easy money ended in 2021. What people have come to expect after the 2020 Boom, has tainted expectations across the board. It's a dumb money-driven market with retail trying to front run every dip, but the thing to understand is the real money "Smart money" knows this is happening, and rather than fighting the market, they are preying on retail dip buyers. They bait them in, and then they wipe them out, rinse and repeat. Nobody knows where the market is headed, but we do know human emotions and habits. Just wanted to give a few words for an update to show where my mindset is and that I'm developing more analysis. In a time like today where we are for sure going down in the history books, I do not believe a ton of posts serve anyone any justice. It's the important, very specific details that matter. It takes a long time to develop these points and structure them in a way that is useful for the many. More posts will be coming. Stay Tuned!
NoOneWhoIsSomeone

اگر خودتان را تعجب کرده اید که چرا BTC تقریباً یک ماه دیگر کاری جز خرد کردن و forth انجام نداده است ، دیگر نگاه نکنید. این نشان دهنده آخرین بازداشت مطلق بالاترین روند صعودی فعلی است. این نگه داشتن پشتیبانی مورد اصلی من برای BTC نبوده است ، زیرا انتظار داشتم قیمت خود را حداقل به 200 W ma برای مدت طولانی پیدا کند. نکته مهم این است که این کانال فقط به در نظر گرفتن Covid Low متکی است تا یک نکته معتبر در نمودار باشد. من فکر می کنم می توان استدلال کرد که از آنجا که این یک رویداد کامل قو سیاه (دور) بود ، منطقی است که یک نکته معتبر بعدی را که در اینجا بود ، بیان کنیم: همانطور که می بینید تصویری کاملاً متفاوت است ، اما باز هم ، من فکر می کنم اعتبار در اینجا برای تفسیر به پایان رسیده است. نکته ای که باید توجه داشته باشم که فکر می کنم بسیار مهم است ، مقایسه با اجراهای قبلی گاو نر است. اگر نگاهی به نمودار بیندازید ؛ این به شما نشان می دهد که رد شدید BTC درست قبل از شکستن منجر به ضربه از بالای صفحه (مه 2021) بشر هر چرخه در گذشته منجر به افزایش پارابولیک شد که این کانال شکسته شد و وقتی این بار نبود ، بازار گیج شد. سازندگان بازار فکر می کردند که می توانند کمی بیشتر از آن استفاده کنند (که آنها انجام دادند) از آنجا که ما ندیدیم که این ضربه را از بالای سر و BTC بار دیگر در ژوئیه سال 2021 به دست آورد. نکته کلی من در اینجا این است که این به ما نشان می دهد که سرکوب واقعی در بازارها وجود دارد. نیروهای چرخه ای در ترکیب وجود دارد. چیزی بزرگتر از سیاست فدرال رزرو ، زیرا به یاد داشته باشید ، آنها فقط ارتجاعی هستند. اگر بازار آنها را مجبور نمی کرد ، آنها هرگز عمل نمی کردند. بنابراین آنها فقط یک پیاده روی یک تخته شطرنج بزرگ هستند. من از فدرال رزرو صحبت می کنم زیرا سیاست آنها بر بازار سهام تأثیر می گذارد ، که به نوبه خود بر رمزنگاری تأثیر می گذارد. به نظر می رسد بسیاری این را نمی دانند ، اما همان موجودات بزرگی است که هر دو بازار را بازی می کنند. همان پول بزرگی که سهام پیشانی ، همچنین (Id دقیق تر استدلال می کند) رمزنگاری جلوی آن. اقتصاد جهانی در وضعیت بسیار ناچیزی قرار دارد. بین تنش های ژئوپلیتیکی ، مسائل مربوط به زنجیره تأمین ، افزایش قیمت انرژی (Gas با 5.00 دلار) ، تورم هنوز هم در حال افزایش است ، بحران غذایی و غیره ، زندگی بسیاری از افراد واقعاً تحت تأثیر قرار می گیرد. بسیاری از افراد حتی نمی توانند به درستی زندگی خود را انجام دهند و یک سقف را روی سر خود نگه دارند ، و به ذکر کسانی که هنوز در تلاش هستند تا اعتبار خود را برای ادامه کار خود داشته باشند ، ذکر نکنند. اعتبار گرداننده کل از لحاظ تاریخی در همه زمانها است (آن را جستجو کنید). در طی چند سال گذشته ، بحران بی سابقه ای رخ داده است. ثروتمندان قادر به سرمایه گذاری در این فرصت ها هستند و فقرا می توانند عواقب آن را متحمل شوند. شکاف ثروت که امروز می بینیم هرگز در زندگی ما و صادقانه فراتر از آن هرگز بیشتر نبوده است. عواقبی برای پرداخت این شکاف ثروت که طبقه متوسط را کاملاً پاک کرده است ، بود. به بیان ساده تر ، تعجب آور است که می بینیم قیمت برای مدت طولانی در این منطقه بدون شکستن یا پایین آمدن ، نگه داشته می شود. این نشان می دهد که چقدر عدم اطمینان وجود دارد. من می توانم یک استدلال قوی مطرح کنم که چرا ما برای مدتی شاهد حرکات طولانی مدت شدید به سمت صعود بود ، اما این چیزی نیست که این پست برای آن باشد. این با یک پست پیگیری همراه بود. در حال حاضر ، من فقط می که این نمودار برای خودش صحبت کند و پرونده خود را بدون سر و صدا اعلام کند. در حالی که به چند مورد لمس می کنم ، من مهم می دانم. من می دانم که این یک پست گسترده است ، اما فکر می کنم مهم است که درک ما را گسترش داده و اصول وسیع تر را درک کنیم زیرا در نهایت همه دومینوها به ترتیب سقوط می کنند. پس از درک این موضوع ، دیدن تصویر بزرگ به جای عکس کوچک آسان تر می شود. آخرین چیزی که می گویم که فکر می کنم از همه عجیب ترین است ، به پایین سمت چپ نمودار توجه کنید. توجه کنید که WICK Extended دقیقاً در 21 نوامبر 2011؟ آیا واقعاً عجیب نیست که One Wick نمایانگر بالا و پایین این کانال باشد؟ واقعاً نمی توانم سرم را به دور آن بپیچم. به هر حال ، به سلامتی
NoOneWhoIsSomeone
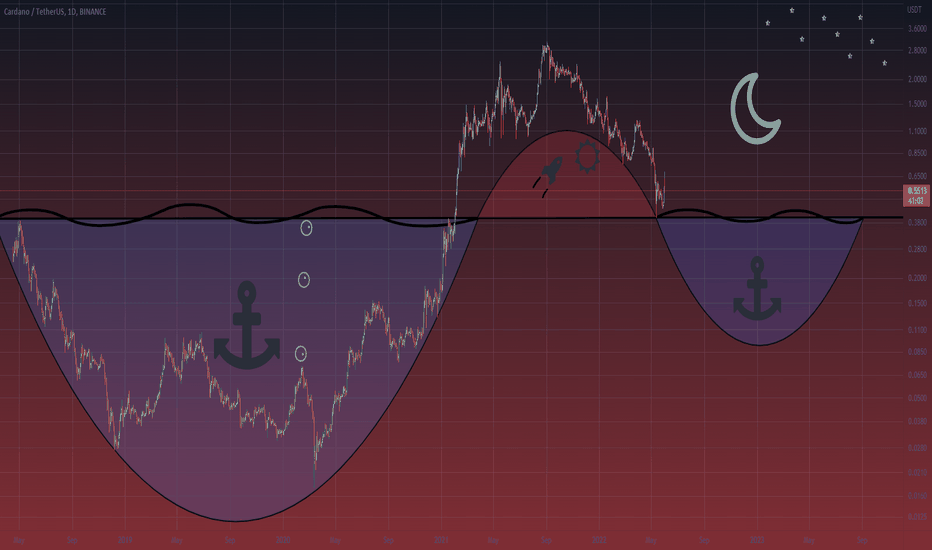
همانطور که با Icarus ، Cardano از سفر خود به sun لذت برد. اما به همان سرعتی که سرخوشی می آید ، می گذرد. احساسات مربوط به ADA در طی سال گذشته غیرقابل انکار است. این پروژه از یکی از محبوب ترین ها رفت ، به یکی از تردیدهای بیشتر. اگر (0.40 دلار) مارک نشان داده شده در نمودار از بین رفته است ، این safe است که می گویند sun تنظیم شده است و دارندگان ADA باید روی دنده های خود را ببندند. این یک سفر طولانی در زیر آب بود.
NoOneWhoIsSomeone

الگوی Clear Head & Shoulders بسیار مشابه با بازار خرس 2018 بازی کرد. آخرین باری که این نوع شکست را دیدیم ، می توانیم ببینیم که ویکهای پایین بسیار مشابه بودند و پایین را پیشنهاد نمی کردند. اولین پشتیبانی 1450 دلار است. پشتیبانی دوم ، اگر شاهد بازی رکود اقتصادی جهانی باشیم ، 460 دلار است. من می دانم که هدف دوم غیرممکن به نظر می رسد اما به شما قول می دهم اگر رکود جهانی بازی کند ، خیلی سریع واقع بینانه می شود. در حال حاضر ، ما فقط پشتیبانی اول را هدف قرار می دهیم. امیدوارم این کمک کند ، موفق باشید! هنوز هم در این مورد بسیار مطمئن است. باید بخاطر بسپار که این کار هفته ها و حتی ماه ها طول می کشد تا اهداف کلی یکسان باشند. به دنبال به روزرسانی در پایین های محلی ممکن است که قیمت آن برای گزاف گویی تلاش کرد. در نهایت ، این روند به هیچ وجه در حال تغییر میان مدت/بلند مدت نیست.
NoOneWhoIsSomeone

این فقط یک بروزرسانی کوتاه مدت در BTC بود زیرا ما در نهایت شاهد ساختار ساختاری form پس از خونریزی اخیر هستیم. این صرفاً یک مجموعه فنی در LTF است. اگر در مورد عنوان تعجب می کنید ، اشاره به آن است پرچم این در ابتدا ما را در وهله اول به ارمغان آورد. و با این حال ما دوباره می رویم ... آخرین نکته ای که باید در اینجا ذکر شود BTC هرگز از این طریق پایین مدت طولانی مدت ایجاد نکرده است. من برای حمایت از این ادعا یک تحلیل پیگیری داشت. در حال حاضر ، فقط به خطوط خط در نمودار اعتماد کنید. هر فکر را در زیر به اشتراک بگذارید.
NoOneWhoIsSomeone

بازارها بیش از حد و به همان اندازه که محیط کلان است بد است ، در همین لحظه همه چیز مارپیچ نمی شود. من گمان می کنم که همچنان که به بقیه این هفته می رویم ، شاهد حرکت در کوتاه مدت صعودی بود. این امکان وجود دارد که ما یک روز دوشنبه شاهد یک حرکت دروغین باشیم اما TA فرصتی عادلانه برای گزاف گویی پیشنهاد می کند. اکنون ، این از احساسات کلی میان مدت من کم نمی شود. زیرا اگر به اینجا نگاه کنید ، چیزهایی در مقیاس کلان هنوز در معرض خطر هستند: این NASDAQ است من تعداد روزهایی را که NDQ به ماهانه 50ma را امتحان کرده است ، اندازه گیری کردم. ما اکنون 607 روز از آخرین بار فراتر رفته ایم. این زوج با قیمت که هنوز در وسط کانال فرود آمده است ، نشانگر نزولی میان مدت است. به RSI نیز توجه کنید. به نظر می رسد مانند یک تجمع بازار خرس درسی است. این همچنین یک سناریوی روز رستاخیز برای SPX است: در اینجا نمای کلان برای مرجع وجود دارد: من گمان می کنم که بازار همچنان به تجمع ادامه می دهد ، پاول ظاهر خود را می کند و بار دیگر بازارها را خنک می کند زیرا او همچنان به مبارزه برای ثبات قیمت و حفظ موضع ناخوشایند ادامه می دهد. در حال حاضر ، ما فقط موج بالقوه را سوار می کنیم تا سطح گمشده را به خود اختصاص داده و از آنجا برویم! لطفاً هرگونه نظر را در زیر بیان کنید.
NoOneWhoIsSomeone

با نزدیک شدن به چهارراه های بحرانی که در آن بازارها به سر می برند ، اجازه می دهیم که چگونه به اینجا رسیدیم. در اینجا پست SPX من است که من در 23 مارس منتشر کردم. سرانجام قیمت در نمودار hit پشتیبانی می کند. برای خودتان ببینید: نکته عجیب این است که NDQ (ارسال شده در 22 مارس) به همان نوع پشتیبانی بلند مدت نرسیده است: اگر ما به سادگی Boom 2020 VS را با هم مقایسه کنیم: (BOOM 2020) ~ SPX قبلاً 35 ٪ ~ تورم پایین را اصلاح کرده است ~ اقتصاد در حال رشد - نرخ های کاهش یافته به 0 ٪ ~ FED qe ~ 10 برگه ترم فدرال ~ فراوانی کالا ~ بدون جنگ ~ نه مجازات ~ هیچ بیماری همه گیر ... نه بحران غذایی جهانی (اکنون) ~ SPX تنها 19 ٪ ~ تورم بالا تصحیح شده ~ اقتصاد آهسته ~ افزایش نرخ افزایش (بالقوه 8 پیاده روی) ~ FED QT ~ بدون برگه ترم فدرال ~ کمبود کالا ~ روسیه/جنگ اوکراین ~ تحریم ها ~ همه گیر (چین بدون قفل سیاست Covid) ~ بحران غذایی جهانی اکنون این قیمت پشتیبانی 13 ساله را آزمایش کرده است ، بعدی چیست؟ خوب ، جواب همیشه خیلی ساده نیست. اگر همه چیز در همین مسیر یا حتی بدترین حالت ادامه یابد ، شروع به باز کردن بیشتر کنید ، در صورت مواجهه با رکود جهانی ، این یک چشم انداز بسیار معقول است. جالب تر از این ، به توییت های Elon Musk نگاه کنید که به نظر می رسد کاملاً به پایان رسیده است. آیا این یک تصادف واقعاً عجیب است یا او به اطلاعاتی که ما نمی کنیم دسترسی دارد؟ به هر حال برای هدایت بیشتر چند امتیاز ، ما نیز انرژی افزایش می یابیم یا به طور خاص روغن. من این را برای مرجع ترک کرد. پست وضعیت را به خوبی توضیح می دهد: نکته دیگری که باید در نظر بگیرید بازده ایالات متحده و همبستگی آن با بازار سهام است: ما هم وارونگی عملکرد و هم از بین بردن بازده ها را مشاهده کرده ایم که پیشرو برای 6+ رکود گذشته بوده است. آخرین چیزی که دو موردی که از آن خارج می شوند ، بحران جهانی غذا و یک مورد آخر در مورد بازده خزانه داری ما است. در اینجا آینده گندم در مقایسه با قبل از GFC در سال 2008 است: و خزانه داری ایالات متحده در رابطه با رکود/تصادفات قبلی بازار سهام: این پست لزوماً پیش بینی نیست ، بلکه فقط تصدیق پتانسیل آن است. اگر شاهد بازی رکود جهانی در سراسر جهان باشیم ، این یک چشم انداز بسیار واقع بینانه به نظر من است. چشم انداز کوتاه مدت وجود دارد:
سلب مسئولیت
هر محتوا و مطالب مندرج در سایت و کانالهای رسمی ارتباطی سهمتو، جمعبندی نظرات و تحلیلهای شخصی و غیر تعهد آور بوده و هیچگونه توصیهای مبنی بر خرید، فروش، ورود و یا خروج از بازارهای مالی نمی باشد. همچنین کلیه اخبار و تحلیلهای مندرج در سایت و کانالها، صرفا بازنشر اطلاعات از منابع رسمی و غیر رسمی داخلی و خارجی است و بدیهی است استفاده کنندگان محتوای مذکور، مسئول پیگیری و حصول اطمینان از اصالت و درستی مطالب هستند. از این رو ضمن سلب مسئولیت اعلام میدارد مسئولیت هرنوع تصمیم گیری و اقدام و سود و زیان احتمالی در بازار سرمایه و ارز دیجیتال، با شخص معامله گر است.