
Magister_Arcanvm
@t_Magister_Arcanvm

تریدر چه نمادی را توصیه به خرید کرده؟
سابقه خرید
تخمین بازدهی ماه به ماه تریدر
پیام های تریدر
فیلتر
نوع سیگنال
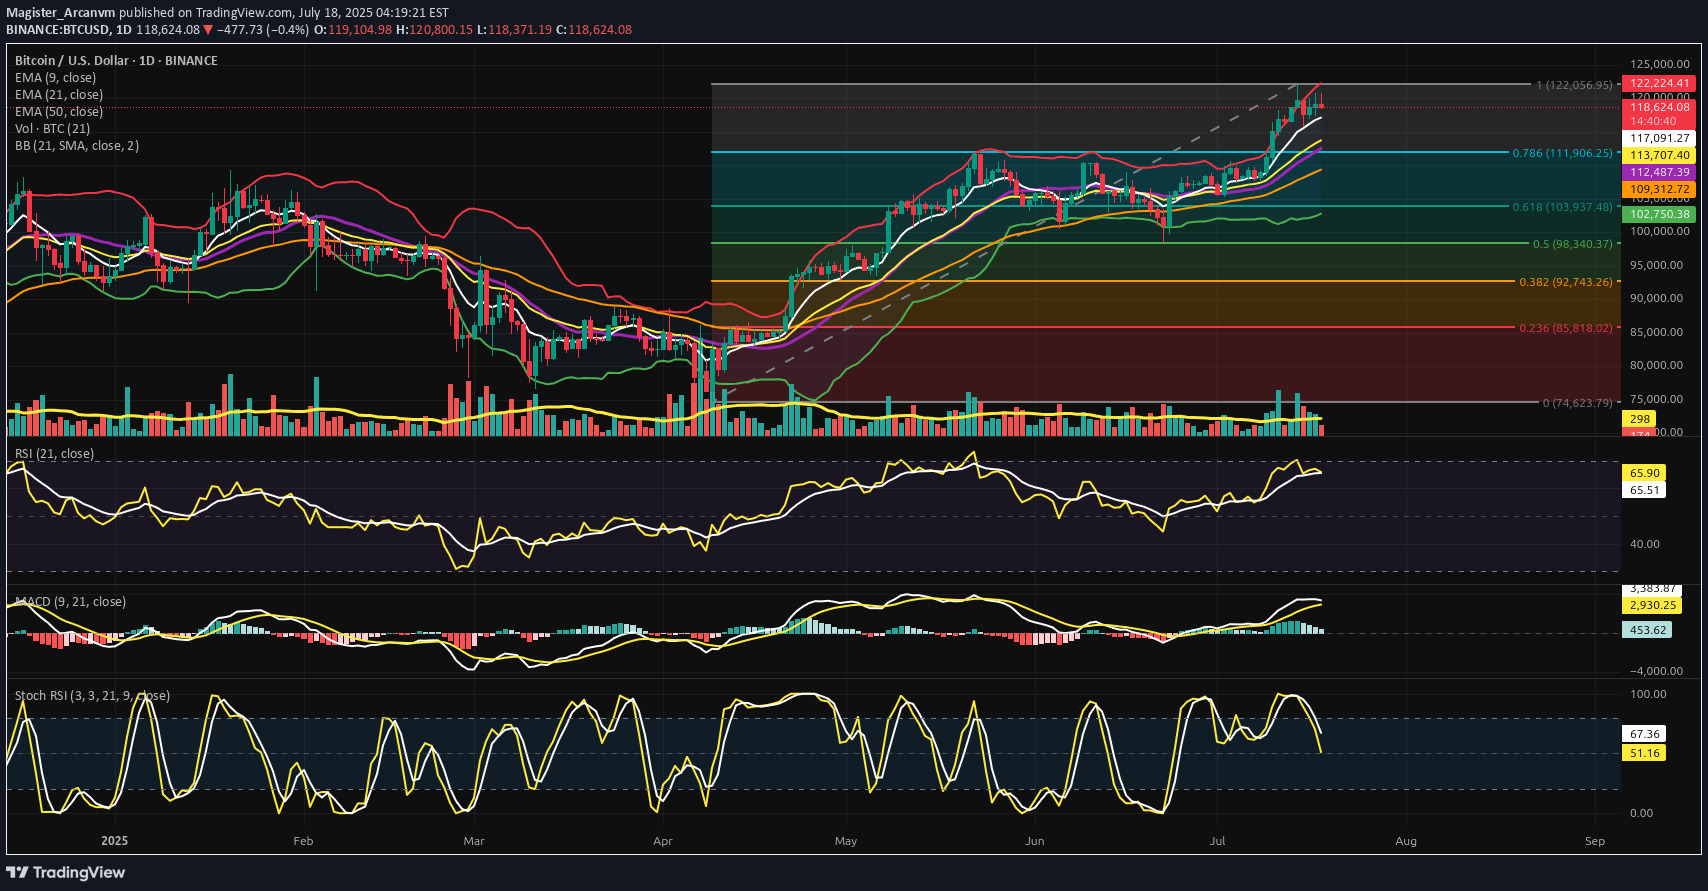
⊣ ⟁ BTC/USD - BINANCE - (CHART: 1D) - (Jul 18, 2025). ◇ Analysis Price: $118,866.60. ⊣ ⨀ I. Temporal Axis - Strategic Interval - (1D): ▦ EMA9 - (Exponential Moving Average - 9 Close): ∴ EMA9 is currently positioned at $119,077.81, closely tracking the current price, acting as dynamic micro-support; ∴ The slope of EMA9 remains upward, with price consistently closing above it in the past sessions; ∴ Compression candles are forming above this line, suggesting it is being defended as a tactical floor. ✴️ Conclusion: EMA9 is structurally supportive, signaling short-term bullish control beneath compression. ⊣ ▦ EMA21 - (Exponential Moving Average - 21 Close): ∴ EMA21 is placed at $118,537.29 and holds a clear upward slope; ∴ Recent pullbacks have tested the region near EMA21 but failed to close beneath it; ∴ EMA21 is establishing itself as the primary mid-range buffer zone within this bullish phase. ✴️ Conclusion: EMA21 confirms intermediate momentum preservation and mid-term trend integrity. ⊢ ▦ EMA50 - (Exponential Moving Average - 50 Close): ∴ EMA50 is located at $116,804.80 and remains untouched during the current rally phase; ∴ The distance between EMA21 and EMA50 is widening, confirming structural momentum; ∴ This line now functions as the lower tier of the bullish envelope - a defensive anchor. ✴️ Conclusion: EMA50 reflects resilient bullish understructure and rising support basin. ▦ Fibonacci Retracement - (ATH = $122,056.95 / Low = $74,623.79): ∴ Price is currently positioned just under the 0.786 level, a classic tension zone before ATH retests; ∴ The 0.618 level has already been claimed and held as support, showing strength through key retracements; ∴ The market is coiling between 0.786 and 1.000 in preparation for decisive expansion or rejection. ✴️ Conclusion: BTC sits within the golden gate - structurally pressurized near final resistance thresholds. ⊢ ▦ Bollinger Bands: ∴ Bands are visibly contracting, forming a volatility funnel around the current price zone; ∴ The price is maintaining proximity to the upper band without closing beyond it; ∴ The base band remains far beneath ($116k zone), indicating untriggered potential. ✴️ Conclusion: Volatility is compressing structurally; directional resolution is imminent. ⊢ ▦ Volume + EMA21: ∴ Volume bars have declined steadily during this upper-range consolidation; ∴ EMA21 on volume confirms weakening participation relative to early July moves; ∴ Absence of breakout-volume suggests either stealth accumulation or passive stalling. ✴️ Conclusion: Volume behavior is non-confirmatory - the structure floats without conviction. ⊢ ▦ RSI - (21) + EMA9: ∴ RSI(21) currently prints 60.45, above its own EMA9 at 59.41, suggesting net upward pressure; ∴ The RSI slope remains neutral-to-positive without entering overbought; ∴ The absence of bearish divergence confirms internal momentum coherence. ✴️ Conclusion: RSI structure is clean, moderate, and aligned with sustainable trend energy. ⊢ ▦ Stochastic RSI - (3,3,21,9): ∴ K = 78.78 | D = 71.55 - both above 70, nearing the overbought ceiling; ∴ The fast line (K) shows minor inflection but no confirmed cross; ∴ Momentum is elevated, but historical context shows price can remain extended. ✴️ Conclusion: Momentum is entering saturation zone - caution on short-term exhaustion. ⊢ ▦ MACD - (9,21): ∴ MACD line (540.52) remains above the signal line (414.93) in sustained bullish crossover; ∴ The histogram has begun flattening, indicating reduced acceleration; ∴ There is no bearish cross yet, but momentum build is slowing. ✴️ Conclusion: MACD supports bullish continuation, but thrust intensity is decaying. ⊢ ▦ OBV + EMA9: ∴ OBV reads 71.13M and is currently flat, with no new highs in accumulation; ∴ EMA9 on OBV closely hugs the raw OBV line, confirming stagnation; ∴ Prior upward surges in OBV are not being extended, showing tactical pause in conviction. ✴️ Conclusion: Liquidity expansion has halted; OBV structure is tactically neutral. ⊢ 🜎 Strategic Insight - Technical Oracle: ∴ The BTC/USD structure is entering a compressed apex between structural momentum (EMA stack, RSI, MACD) and tactical exhaustion signals (Stochastic RSI, Bollinger Band constriction, flattening OBV); ∴ Price is stabilizing just beneath the ATH gate ($122,056), indicating a threshold scenario - where breakout and rejection probabilities are approaching parity; ∴ Volume decline reflects the absence of forced participation, and suggests that the next move will be event-triggered or liquidity-engineered. The current environment favors volatility re-expansion, not trend reversal; ✴️ This is a threshold phase: structurally bullish, tactically suspended, awaiting ignition. ⊢ ∫ II. On-Chain Intelligence – (Source: CryptoQuant): ▦ Exchange Netflow Total + EMA9: ∴ Current Netflow: -938 Bitcoins - sustained negative flow over time indicates coins leaving exchanges; ∴ Persistent outflows reflect holding sentiment and reduced immediate sell pressure; ∴ Price action shows historical upside alignment when netflows remain negative across clusters. ✴️ Conclusion: Exchange behavior signals macro holding bias, not liquidation cycles. ⊢ ▦ Binary CDD + EMA9: ∴ Binary CDD has spiked into high activity zones in the past week, showing awakened dormant coins; ∴ This metric historically precedes localized tops when synchronized with weak flows; ∴ However, no consistent clusters are forming - signals remain scattered. ✴️ Conclusion: Binary CDD reflects isolated movements, not systemic awakening or distribution. ⊢ ▦ Exchange Whale Ratio + EMA9: ∴ Current ratio hovers at ~0.62 - elevated but not extreme; ∴ Sustained whale activity near 0.60+ can precede volatility events; ∴ Trendline is rising since May, showing gradual uptick in dominance from top senders. ✴️ Conclusion: Whale activity is tactically elevated, implying latent strategic intent. ⊢ ▦ Supply-Adjusted Dormancy + EMA9: ∴ Dormancy values are near historical lows, indicating old coins are staying inactive; ∴ EMA9 confirms a downward trend in dormant supply movement; ∴ Long-term holders are not distributing at this level. ✴️ Conclusion: Structural dormancy supports holder conviction - no exit signals from old supply. ⊢ ▦ Realized Cap + EMA9: ∴ Realized Cap is now exceeding $1T, rising consistently without parabolic spikes; ∴ EMA(9) and line are in lockstep - a healthy ascent; ∴ No acceleration = no blow-off = sustainable revaluation. ✴️ Conclusion: Value accumulation remains organic, not euphoric. ⊢ ▦ MVRV Ratio + EMA9: ∴ MVRV sits at 2.36 - below historical overvaluation levels (>3.0); ∴ EMA(9) confirms gradual slope upward, consistent with price; ∴ Ratio is not overheated - risk/reward remains structurally favorable. ✴️ Conclusion: MVRV indicates non-euphoric regime - mid-phase of value appreciation. ⊢ ▦ BTC vs GOLD vs S&P500 - (BGemetrix Comparative Graph): ∴ BTC continues to outperform both GOLD and SPX in long-term slope, even after corrections; ∴ Current phase shows GOLD flattening and SPX slightly lagging BTC in verticality; ∴ This divergence hints at BTC leading in speculative rotation while traditional assets stabilize. ✴️ Conclusion: BTC holds macro-dominance position, operating as the apex volatility proxy in current intermarket structure. ⊢ 🜎 Strategic Insight - On-Chain Oracle: ∴ Despite short-term compression, the on-chain structure reveals no distribution threats; ∴ Holder conviction, realized valuation, and MVRV slope all suggest controlled structural appreciation, not mania; ∴ Whales are tactically present, but dormancy and exchange flows confirm no mass exit; ∴ This is an internally coherent, tactically patient regime. ✴️ Bitcoin is preparing, not peaking. ⊢ 𓂀 Stoic-Structural Interpretation: ▦ Structurally Bullish - Tactically Suspended: ∴ All key EMA's (9/21/50) are stacked and rising; price remains elevated yet non-parabolic; ∴ Fibonacci apex is active, with price compressing beneath the ATH zone ($122,056), not retreating; ∴ On-chain intelligence confirms long-term conviction, with no distribution from whales or dormants. ✴️ Conclusion: The system retains structural strength; pressure is latent, not expired. The architecture is bullish, not euphoric. ⊢ ▦ Tactical Range Caution: ∴ Stochastic RSI and MACD show early-stage exhaustion; ∴ Volume has declined into apex, favoring liquidity traps or volatility bursts; ∴ Whale Ratio elevation implies pre-positioning behavior, not public confirmation. ✴️ Conclusion: Tactical maneuvering is dominant. Breakout potential exists but is not trustable until confirmed by volume and displacement. ⊢ ⧉ Cryptorvm Dominvs · ⚜️ MAGISTER ARCANVM ⚜️ · Vox Primordialis ⌬ - Wisdom begins in silence. Precision unfolds in strategy - ⌬ ⧉ ⊢
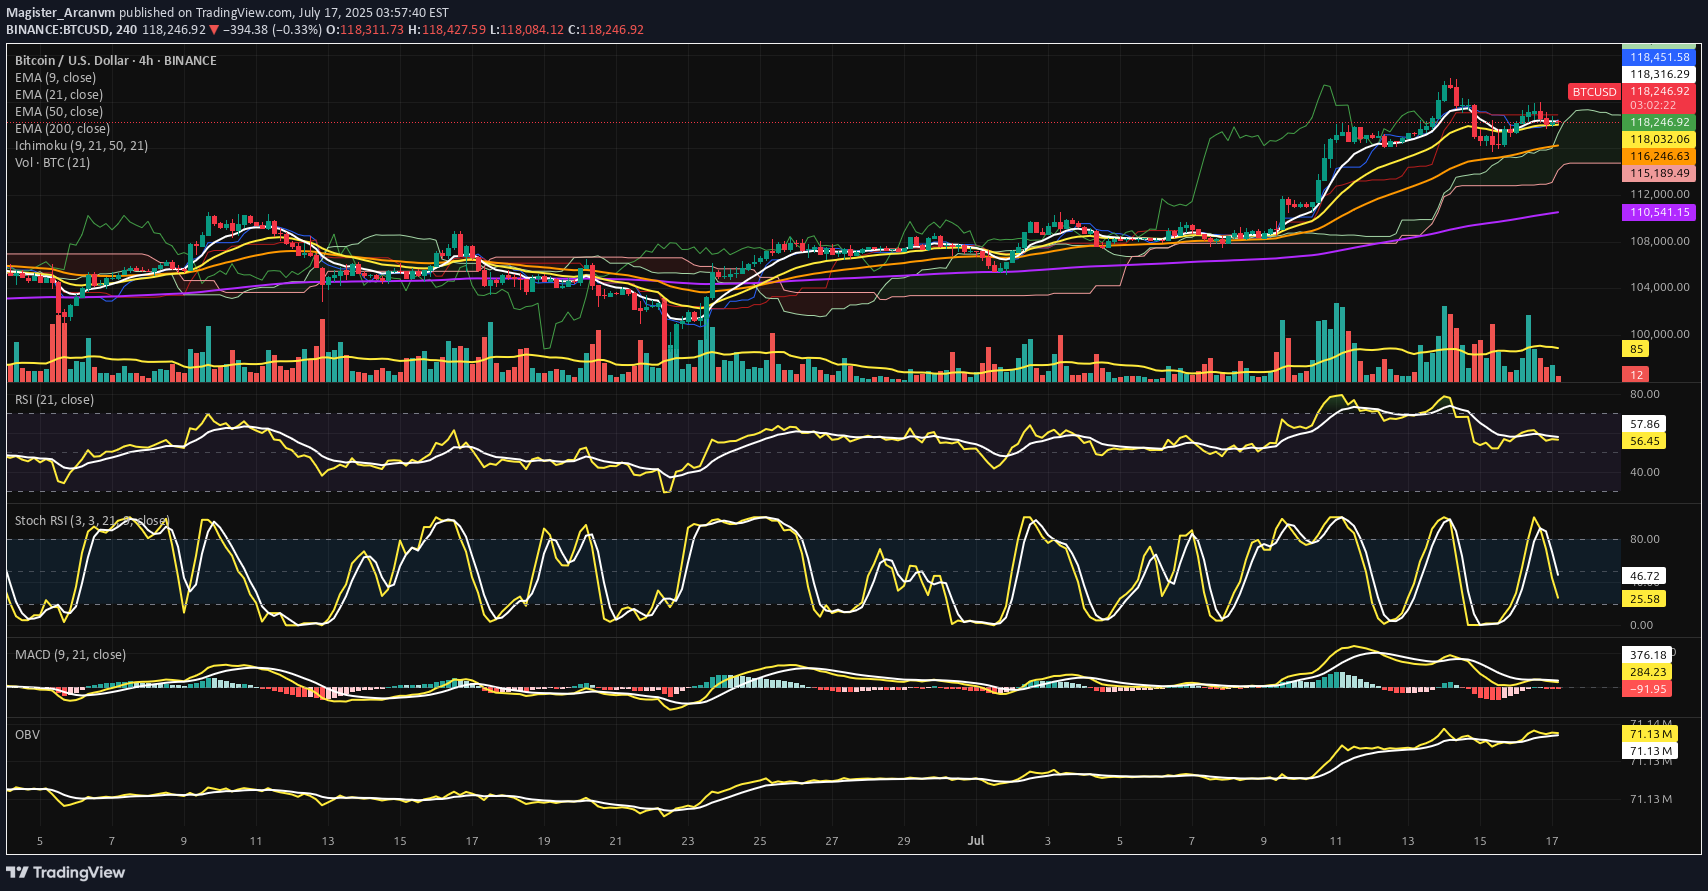
⊣ ⟁ BTC/USD - BINANCE - (CHART: 4H) - (July 17, 2025). ◇ Analysis Price: $118,099.62. ⊣ ⨀ I. Temporal Axis - Strategic Interval – (4H): ▦ EMA9 - (Exponential Moving Average - 9 Close): ∴ EMA9 is currently positioned at $118,286.83, marginally above the current price of $118,099.62; ∴ The slope of the EMA9 has begun to turn sideways-to-downward, indicating loss of short-term acceleration; ∴ The price has crossed below EMA9 within the last two candles, suggesting an incipient rejection of immediate bullish continuation. ✴️ Conclusion: Short-term momentum has weakened, positioning EMA 9 as immediate dynamic resistance. ⊢ ▦ EMA21 - (Exponential Moving Average - 21 Close): ∴ EMA21 is measured at $118,018.67, positioned slightly below both price and EMA9, indicating a recent tightening of trend structure; ∴ The slope of EMA21 remains positive, preserving the medium-range bullish structure intact; ∴ EMA21 has been tested multiple times and held as support since July 15 - confirming tactical reliability as dynamic floor. ✴️ Conclusion: EMA21 stands as a critical pivot zone; any sustained breach would denote structural stress. ⊢ ▦ EMA50 - (Exponential Moving Average - 50 Close): ∴ EMA50 is currently located at $116,240.85, well below current price action; ∴ The curve maintains a healthy positive inclination, affirming preservation of broader intermediate trend; ∴ No contact or proximity to EMA50 over the last 20 candles - indicating strong bullish detachment and buffer zone integrity. ✴️ Conclusion: EMA50 confirms medium-term bullish alignment; not yet challenged. ⊢ ▦ EMA200 - (Exponential Moving Average - 200 Close): ∴ EMA200 stands at $110,539.69, forming the base of the entire 4H structure; ∴ The gradient is gradually rising, reflecting accumulation over a long time horizon; ∴ The distance between price and EMA200 reflects extended bullish positioning, yet also opens risk for sharp reversion if acceleration collapses. ✴️ Conclusion: Long-term structure remains bullish; early signs of overextension exist. ⊢ ▦ Ichimoku Cloud - (9, 21, 50, 21): ∴ Price is currently above the Kumo (cloud), placing the pair within a bullish regime; ∴ Tenkan-sen (conversion) and Kijun-sen (base) lines show narrowing separation, suggesting momentum compression; ∴ Senkou Span A > Span B, and the cloud ahead is bullishly twisted, though thinning - indicating potential vulnerability despite structural advantage. ✴️ Conclusion: Bullish regime intact, but loss of momentum and cloud compression warrant caution. ⊢ ▦ Volume + EMA21: ∴ Current volume for the latest candle is 3 BTC, compared to the EMA21 of 84 BTC; ∴ This indicates an extremely low participation phase, often associated with distribution zones or indecisive consolidation; ∴ Previous impulsive candles (July 15) reached well above 100 BTC - the current contraction is stark and strategically significant. ✴️ Conclusion: Absence of volume threatens trend continuation; energy depletion apparent. ⊢ ▦ RSI - (21) + EMA9: ∴ RSI (21) is positioned at 55.73, marginally above neutral zone; ∴ EMA 9 of RSI is 57.71, crossing downward against RSI - bearish micro signal; ∴ No divergence is present versus price action - oscillator confirms current stagnation rather than exhaustion. ✴️ Conclusion: RSI losing strength above neutral; lacks momentum for breakout, but no capitulation. ⊢ ▦ Stoch RSI - (3,3,21,9): ∴ %K is 21.44, %D is 45.34 - both pointing downward, in deacceleration phase; ∴ Recent rejection from overbought zone without full reset into oversold - signaling weak bullish thrust; ∴ Historical cycles show rhythmical reversals near current levels, but only with supportive volume, which is absent now. ✴️ Conclusion: Short-term momentum failed to sustain overbought breakout - micro-correction expected. ⊢ ▦ MACD - (9, 21): ∴ MACD line is at -104.80, Signal line at 268.16 - large separation, histogram deeply negative; ∴ The bearish crossover occurred with declining volume, implying fading momentum rather than aggressive sell-off; ∴ No bullish divergence formed yet - continuation of correction remains technically favored. ✴️ Conclusion: MACD confirms trend exhaustion; no reversal in sight. ⊢ ▦ OBV + EMA 9: ∴ OBV is 71.13M, perfectly aligned with its EMA9 - indicating equilibrium in volume flow; ∴ No directional bias in accumulation or distribution - flatlining suggests passive environment; ∴ Prior OBV uptrend has stalled since July 15 - reinforcing narrative of hesitation. ✴️ Conclusion: Institutional flow is neutral; no aggressive positioning detected. ⊢ 🜎 Strategic Insight - Technical Oracle: The current price structure presents a classic post-impulse compression configuration within a preserved bullish environment. Despite the higher timeframe alignment, multiple short-term indicators exhibit tactical dissonance and signs of momentum decay. This inconsistency reflects a market caught between structural optimism and tactical hesitation. ♘ Key strategic signals - Structural Alignment: ∴ All major EMA's (9, 21, 50, 200) remain stacked in bullish order with no bearish crossovers imminent; ∴ Price remains above the Ichimoku Cloud and above EMA50 - both confirming structural dominance by buyers. ♘ Momentum Degradation: ∴ RSI (21) is drifting below its EMA9, weakening the momentum required for further upside continuation; ∴ Stochastic RSI has rolled over aggressively, failing to reach oversold before reversing - mid-cycle weakness is confirmed. ♘ Volume Collapse: ∴ The current volume profile is critically weak - 3 Bitcoin against an average of 84 Bitcoins (EMA21); ∴ Price attempting to sustain above EMA's with no conviction signals distribution or passivity. ♘ MACD & OBV: ∴ MACD histogram remains deep in negative territory, and no bullish crossover is visible; ∴ OBV is flat - neither accumulation nor distribution dominates, leaving directional thrust suspended. ✴️ Oracle Insight: ∴ The technical field is Structurally Bullish, but Tactically Compressed. ∴ No breakout should be expected unless volume decisively returns above baseline (84 Bitcoins EMA); ∴ Below $117,800, the structure risks transition into a corrective phase; ∴ Above $118,450, potential trigger zone for bullish extension if accompanied by volume surge. ♘ Strategic posture: ∴ Wait-and-observe regime activated; ∴ No entry condition satisfies both structure and momentum at present; ∴ Tactical neutrality is advised until confirmation. ⊢ ∫ II. On-Chain Intelligence - (Source: CryptoQuant): ▦ Exchange Reserve - (All Exchanges): ∴ The total Bitcoin reserves held on all exchanges continue a sharp and uninterrupted decline, now at ~2.4M BTC, down from over 3.4M in mid-2022; ∴ This downtrend has accelerated particularly after January 2025, with a visible drop into new lows - no accumulation rebound observed; ∴ Historically, every prolonged depletion of exchange reserves correlates with structural bullish setups, as supply becomes increasingly illiquid. ✴️ Conclusion: On-chain supply is structurally diminishing, confirming long-term bullish regime intact - mirrors technical EMA alignment. ⊢ ▦ Fund Flow Ratio - (All Exchanges): ∴ Current Fund Flow Ratio stands at 0.114, which is well below historical danger thresholds seen near 0.20-0.25 during local tops; ∴ The ratio has remained consistently low throughout the 2025 uptrend, indicating that on-chain activity is not directed toward exchange-based selling; ∴ Spikes in this indicator tend to precede local corrections - but no such spike is currently present, reinforcing the notion of non-threatening capital flow. ✴️ Conclusion: Capital is not rotating into exchanges for liquidation - volume weakness seen in 4H chart is not linked to sell intent. ⊢ ▦ Miners' Position Index - (MPI): ∴ The MPI sits firmly below the red threshold of 2.0, and currently ranges in sub-neutral levels (~0.5 and below); ∴ This suggests that miners are not engaging in aggressive distribution, and are likely retaining Bitcoin off-exchange; ∴ Sustained low MPI readings during price advances confirm alignment with institutional and long-term accumulation behavior. ✴️ Conclusion: Miner behavior supports structural strength - no mining-induced supply pressure present at this stage. ⊢ 🜎 Strategic Insight - On-Chain Oracle: ∴ Across the three strategic indicators, no on-chain evidence supports short-term weakness; ∴ Supply is declining - (Exchange Reserve ↓); ∴ Funds are not preparing for exit - (Flow Ratio stable); ∴ Miners are not selling - (MPI subdued). ✴️ This constellation reinforces the thesis of Structural Bullishness with Tactical Compression, and suggests that any pullback is not backed by foundational stress. ⊢ 𓂀 Stoic-Structural Interpretation: ∴ The multi-timeframe EMA stack remains intact and aligned - (9 > 21 > 50 > 200); ∴ Price floats above Ichimoku Cloud, and above EMA21 support, confirming elevated positioning within a macro bull channel; ∴ On-chain metrics confirm supply contraction, miner retention, and absence of fund rotation toward exchanges - structure remains sovereign; ∴ RSI - (21) slips under its EMA9 with low amplitude, indicating absence of energetic flow; ∴ Stoch RSI fails to reset fully and points downward - suggesting premature momentum decay; ∴ MACD histogram remains negative, while volume is significantly beneath EMA baseline (3 BTC vs 84 BTC); ∴ Price faces resistance at Kijun-sen ($118.451), acting as tactical ceiling; no breakout signal detected. ⊢ ✴️ Interpretatio Finalis: ∴ Structural integrity remains unshaken - the architecture is bullish; ∴ Tactically, however, the battlefield is fogged - silence reigns in volume, hesitation in oscillators; ∴ A true continuation requires volume resurrection and resolution above $118,450. Until then, neutrality governs the edge. ⊢ ⧉ Cryptorvm Dominvs · ⚜️ MAGISTER ARCANVM ⚜️ · Vox Primordialis ⌬ - Wisdom begins in silence. Precision unfolds in strategy - ⌬ ⧉ ⊢
⊣ ⟁ BTC/USD - BINANCE - (نمودار: 1d) - (14 ژوئیه 2025). ◇ قیمت تجزیه و تحلیل: 121،662.29 دلار. ⊣ ⨀ I. محور زمانی - فاصله استراتژیک - (1D): ▦ ema9 - (115،313.08 دلار): ∴ EMA9 به طرز تهاجمی به سمت بالا شیب دارد و در آخرین مرحله گسترش به عنوان پشتیبانی پویا خدمت می کند. ✴ نتیجه گیری: کنترل صعودی تأیید شد. حرکت محکم توسط لنگر EMA9 هدایت می شود. ⊣ ▦ EMA21 - (111،636.30 دلار): ∴ EMA21 به طور مثبت تمایل دارد و به عنوان یک پایه روند ساختاری در زیر خوشه های قیمت و حجم عمل می کند. ✴ نتیجه گیری: بازار تا زمانی که قیمت بالاتر از میانگین 21 روزه باقی بماند ، از نظر ساختاری صدا باقی می ماند. ⊣ ▦ حجم + EMA21 - (جلد: 497.79 BTC - EMA21: 262 BTC): ∴ افزایش حجم از میانگین نورد پیشی می گیرد و مشارکت نهادی و مشروعیت برک آوت را تأیید می کند. ✴ نتیجه گیری: گسترش حجم اعتبار حرکت قیمت را تأیید می کند - هیچ نشانه ای از واگرایی یا فرسودگی تشخیص داده نشده است. ⊣ ▦ RSI + EMA9 - (RSI: 77.99 - EMA9: 68.49) ∴ RSI وارد قلمرو Overbought شده است ، اما مسیر آن به سمت بالا و گسترده بالاتر از صاف کردن آن باقی مانده است band. ✴ نتیجه گیری: حرکت صعودی پایدار ؛ شرایط بیش از حد هنوز معکوس نشده است. ⊣ ▦ MACD - (9 ، 21 ، 9) + هموار سازی EMA: ∴ MACD: 3،271.60 | سیگنال: 2،013.81 | واگرایی: +1،257.79 ؛ ∴ خط MACD در حال گسترش مثبت بر روی سیگنال آن است و شتاب شتاب را تأیید می کند. ✴ نتیجه گیری: محکومیت فنی از ادامه صعودی برخوردار است. سیگنال تمیز و اشباع نشده است. ⊣ cloud Cloud Ichimoku - (9 ، 26 ، 52 ، 26): ∴ قیمت قاطعانه بالاتر از ابر Kumo - قلمرو "آسمان پاک" است. ∴ senkou span a = 121،653.30 | senkou span b = 112،486.54 ؛ ∴ خطوط Tenkan و Kijun به شدت بالا می روند و تأیید می کنند که اقتدار روند. ✴ نتیجه گیری: مقاومت صفر در بالا ؛ طرح ریزی ابر از توسعه صعودی بیشتر پشتیبانی می کند. ⊣ 🜎 بینش استراتژیک - اوراکل فنی: ∴ همه شاخص ها در همگرایی هارمونیک rare تراز می شوند ، گسترش روند سیگنالینگ بدون ساختار تاپ جاری. ∴ بازار رفتار یک موج پالس پیشرفته را که وارد فاز دوم می شود ، نشان می دهد. play بازی استراتژیک صعودی باقی مانده است - در صورت وجود ، کشش ها باید کم عمق و سریع باشند. ⊣ 𓂀 تفسیر استوایی ساختاری: ∴ از نظر ساختاری صعودی - پیشرفت تاکتیکی ⊢ ⧉ cryptorvm dominvs · ⚜ Magister Arcanvm ⚜ · vox primordialis ⌬ - خرد در سکوت آغاز می شود. دقت در استراتژی آشکار می شود - ⧉ ⊢
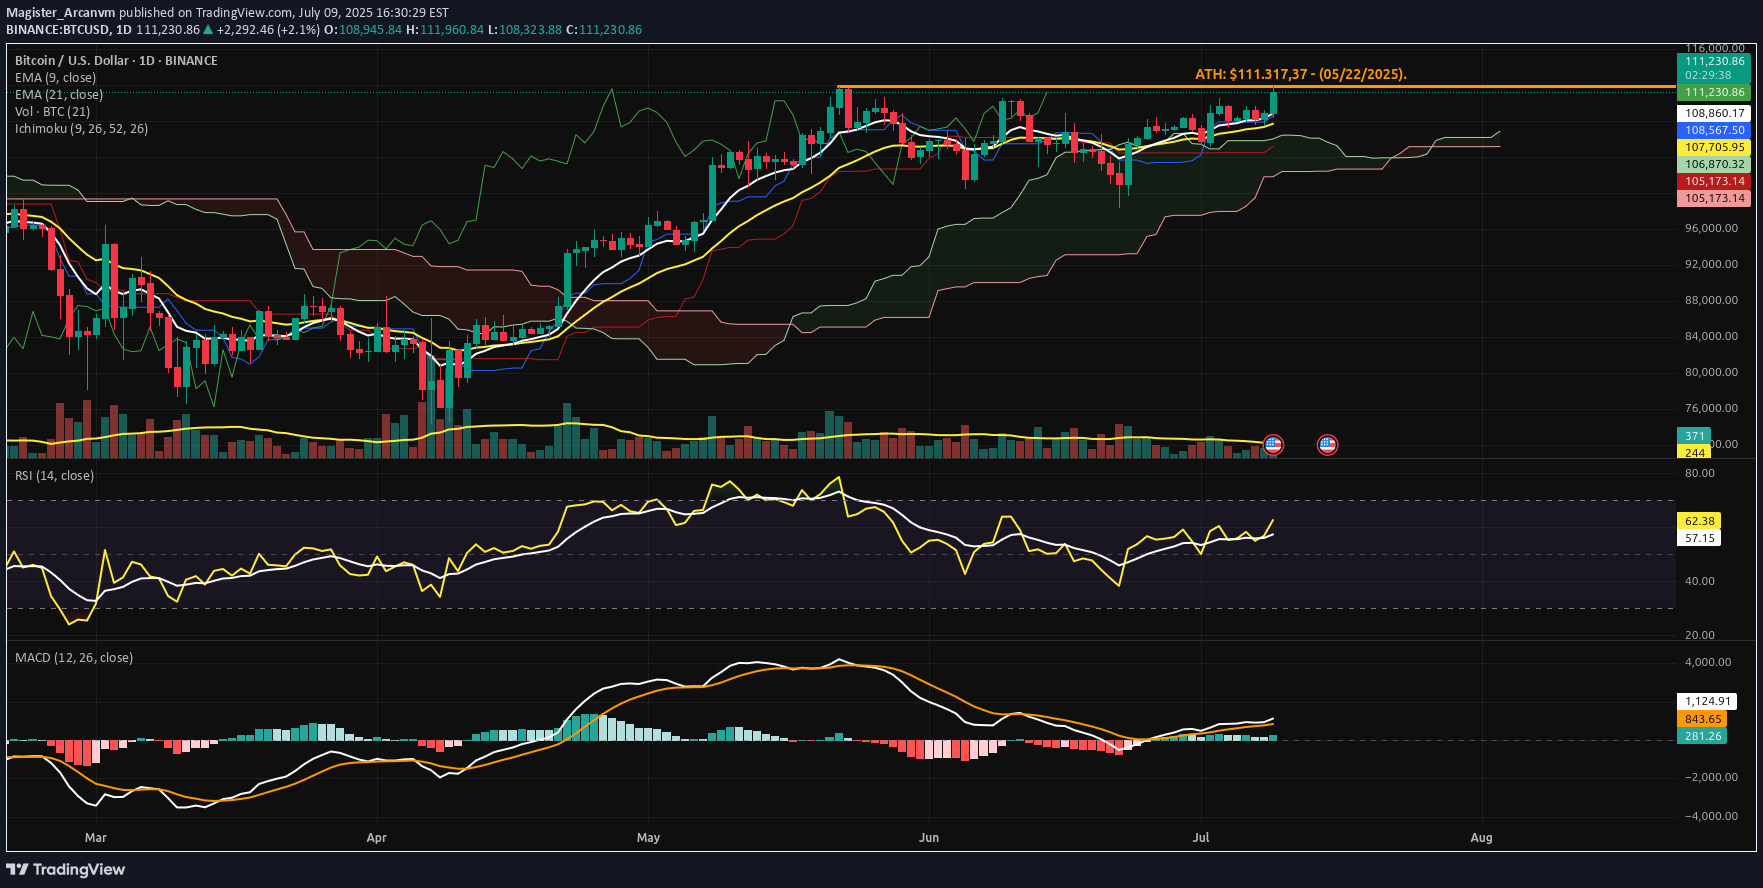
⊣⟁ BTC/USD - BINANCE - (CHART: 1D) - (Jul 09, 2025).◇ Analysis Price: $110,767.80.⊣⨀ I. Temporal Axis - Strategic Interval - (1D):▦ EMA9 - ($108,767.55):∴ Price remains above the 9-day EMA, maintaining a short-term bullish posture;∴ The moving average acts as dynamic support با شیب مثبت. نتیجه گیری: روند فوری دست نخورده باقی می ماند ، با حرکت با 108،767.55 دلار پشتیبانی می شود. $ 107،663.85.⊢▦ Cloud Ichimoku - (Senkou A: 106،870.32 / Senkou B: 105،173.14 $): ∴ به وضوح بالاتر از Kumo است ، با ترازو Bullish Tenkan / Kijun ؛ ∴ دهانه عقب مانده (Chikou) بالاتر از هر دو قیمت و Cloud - Trend- Trend. ساختار ابری پشتیبانی لایه ای بین 106.800 دلار تا 105،100 دلار را فراهم می کند. RSI - (61.33 دلار): ∴ RSI در حال افزایش است ، در حال حاضر در 61.33 ، هنوز هم زیر آستانه Overbough ؛ EMA9 از RSI در 56.94 پشتیبانی می کند. نتیجه گیری: حرکت سالم و صعود است - اتاق برای گسترش به سطح 70 سطح. MACD - (خط MACD: 251.71 / خط سیگنال: 836.26): ∴ صلیب صفر اخیر تأیید شده است. چرخش هیستوگرام به طور فزاینده ای مثبت است ؛ ∴ MACD از سرگیری مراحل اولیه با رشد در حال رشد نشان می دهد. نتیجه گیری: فاز صعودی تجدید شده در حال انجام - ساختار MACD قدرت پایدار را تأیید می کند. حجم + ema21 - (فعلی: 352.24 / ma: 244): ∴ جریان روزانه به طور قابل توجهی بیش از میانگین 21 روزه است. breakout.⊢🜎 Strategic Insight - Technical Oracle:∴ All technical indicators are in alignment;∴ Price is supported by volume, short-term EMA's, bullish Ichimoku structure, and clean RSI/MACD momentum;∴ The price is approaching the (ATH - $111,317.37) and any confirmed close above it, backed by volume, could trigger a Fibonacci-based extension toward - ($115,000 / 117،300 دلار) .⊢∫ II. اطلاعات بر روی زنجیره - (منبع: رمزنگاری): ▦ تبادل جریان کل - (همه مبادلات) - (13.4k Bitcoin): ∴ هیچ سنبله های غیر طبیعی - جریان ها از نظر تاریخی کم باقی می مانند. نتیجه گیری: فشار فروش وجود ندارد - هیچ نشانه ای از معدنکار یا نهنگ رونق. در هفته های اخیر به شدت کاهش یافته است. نتیجه گیری: انقباض عرضه ساختاری - مشخصه کلاسیک انباشت. - نرخ بودجه - (کلیه مبادلات) - (+0.006 ٪): ∴ کمی مثبت ، خوب در منطقه خنثی - بدون سرخوش spikes.✴ نتیجه گیری: موقعیت ها به صورت سیستماتیک ساخته می شوند - نه انگیزه ای. ⊢🜎 بینش استراتژیک - اوراکل در زنجیره ای: ∴ شکستن توسط اهرم هدایت نمی شود ، بلکه با تجمع نقطه ای و خروج از نهادی است ؛ ∴ این محیط را نشان می دهد (قبل از اظهارات) (به ویژه در اواخر سال 2020) ، هنگامی که Resing and Finding Finding ؛ راهپیمایی در حال انجام است. ⊢⧈ Codicillus silentii - توجه استراتژیک: ∴ بازار سکوت کاملی را در زیر قیمت نشان می دهد - بدون ورود ، بدون ایجاد سوداگرانه ؛ ∴ فقط کسانی که به ریتم عمیق تر می پردازند ، ایجاد فشار را در این ساختار فشرده درک می کنند ؛ ∴ Codex مشاهده نمی کند که ناهنجاری های مختل کننده را مختل کند. انرژی نهفته است ، مواد منفجره نیست - با این وجود. BULLISH - تأیید تاکتیکی. ⊢⧉Cryptorvm Dominvs · ⚜ Magister arcanvm ⚜ · Vox Primordialis ⌬ - خرد در سکوت آغاز می شود. دقت در استراتژی آشکار می شود -
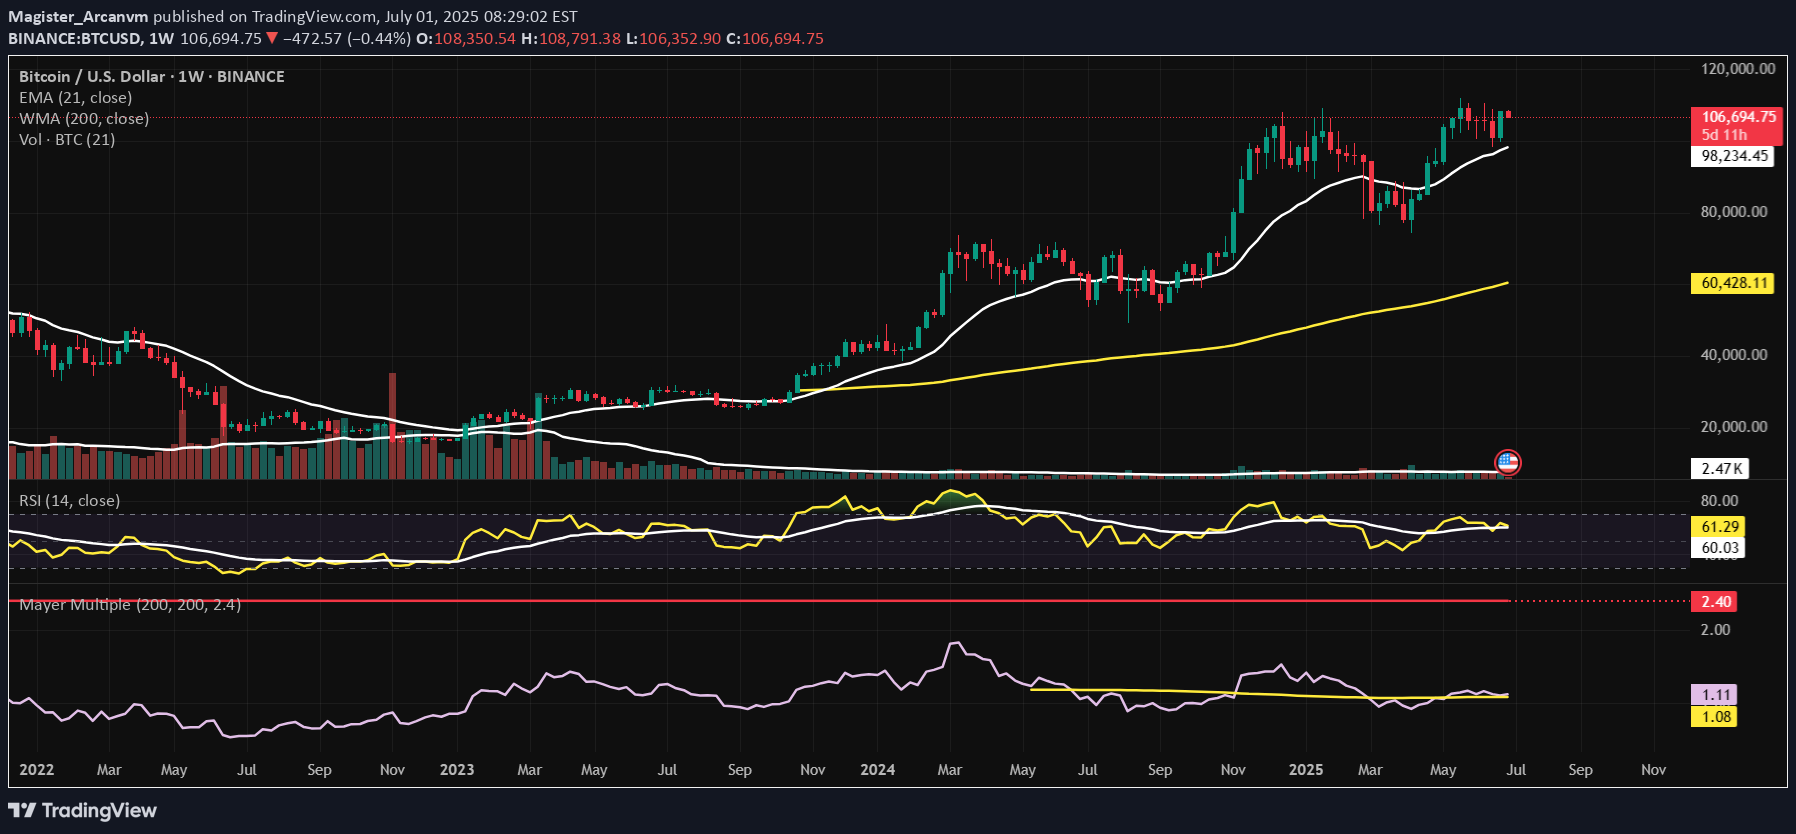
⊢⟁ BTC/USD – BINANCE – (CHART: 1W) – (Date: July 01, 2025).◇ Analysis Price: $106,464.00.⊢⨀ I. Temporal Axis – Strategic Interval – (1W):▦ EMA21 – ($98,213.17):∴ The EMA21 has provided dynamic mid-term support since early Q4 2024;∴ Recent pullbacks respected the line precisely, confirming its role as tactical trend anchor.✴ Conclusion: Tactical bullish posture maintained. Rejection above EMA21 signals controlled bullish continuation.⊢▦ Week Moving Average 200WMA – ($60,425.78):∴ The 200WMA continues its upward ascent, now surpassing the symbolic $60k level;∴ Price remains structurally elevated, approximately 76% above the WMA baseline, marking a strong long-term cycle support.✴ Conclusion: Structurally bullish. The 200WMA acts as a deep support; no signs of cyclical exhaustion.⊢▦ Volume + MA21:∴ Volume remains within normal bounds, with no explosive or capitulative behavior;∴ The 21-week average volume shows steadiness, confirming institutional absorption rather than speculative frenzy.✴ Conclusion: Price action is supported by consistent volume. There is conviction, not hype.⊢▦ RSI + EMA21 – (RSI: 61.01 | EMA: 60.00):∴ RSI remains stable above the 60-threshold, traditionally a bull-control zone;∴ The EMA21 on RSI sits just beneath it, reflecting sustainable momentum without overheating.✴ Conclusion: Momentum is alive and consistent. Pressure is not euphoric, but persistently positive.⊢▦ Mayer Multiple – (1.11):∴ The current Mayer Multiple (Price ÷ 200WMA) is at 1.11, far below critical cyclical warning zones;∴ Historical peaks formed above 2.4–3.2×, placing current readings in neutral-to-accumulative territory.✴ Conclusion: No signs of macro-top formation. Room for expansion remains open within cycle structure.⊢🜎 Strategic Insight – Technical Oracle:∴ Bitcoin maintains an elevated stance above all major structural supports;∴ No indicators suggest euphoric excess or terminal cycle behavior;∴ Momentum, structure, and volume all reflect the essence of a mature but breathing bull cycle, silently advancing.⊢∫ II. On-Chain Intelligence – (Source: CryptoQuant):▦ MVRV Ratio – (2.22):∴ The current MVRV remains below the historical danger zone of >2.5;∴ Price is elevated, but not euphoric - reflective of controlled structural ascent.✴ Conclusion: BTC sits in the upper-middle band of valuation. No top formation indicated, but vigilance required.⊢▦ Exchange Reserve – (All Exchanges – 2.4M BTC (new low):∴ Continuous decline in BTC held on exchanges since Q4 2022;∴ Signals that coins are being withdrawn to self-custody – typical of conviction-based accumulation.✴ Conclusion: Supply is drying from trading venues. This is fundamentally bullish and reduces short-term dump risk.⊢▦ Realized Cap – ($958B):∴ The realized capitalization is climbing in tandem with price - without flattening or divergence;∴ Indicates strong inflow of high-conviction capital setting new cost-bases.✴ Conclusion: Market is absorbing price increases via real buyer interest. Structural support is being rebuilt at higher levels.⊢▦ Short-Term Holder Realized Price & Profit/Loss Margin:∴ Profit margins are rising but remain beneath the historical 70% “euphoria line;”∴ No extreme deviation between spot price and realized price.✴ Conclusion: Profit-taking is occurring in equilibrium. No signs of unsustainable speculation.⊢▦ Spent Output Profit Ratio – (SOPR - 1.036):∴ Values above 1 indicate net selling at a profit;∴ However, the ratio is stable and modest – no spike.✴ Conclusion: Profitable selling is active, but not excessive. Market is cycling profits without panic or climax.⊢▦ Stablecoin Supply Ratio - (SSR – 17.6):∴ A high SSR means fewer stablecoins relative to BTC -> lower immediate buy-side liquidity;∴ This aligns with observed euro-stablecoin inflows and USD retreat.✴ Conclusion: Bitcoin price is rising without massive stablecoin inflow. Potential for future upside if SSR compresses.⊢🜎 Strategic Insight – On-Chain Oracle:∴ All six indicators converge on a structurally bullish;∴ Tactically stable market;∴ There is no evidence of blow-off top, exhaustion, or manic distribution;∴ Supply is retreating, valuation rising moderately, and profit cycles remain rational.⊢⧉ III. Contextvs Macro–Geopoliticvs – Interflux Economicvs:▦ Macro-Structural Narrative:∴ Bitcoin closed Q2 2025 with a +29.9% quarterly gain - (source: CryptoRank);∴ The rally is attributed to growing institutional adoption, bolstered by pro-Bitcoin policies of the Trump administration, including treasury-on-chain initiatives;∴ Macroeconomic tension around trade wars has eased, fueling upward movement in both BTC and the S&P 500, signaling synchronized risk-on appetite - (source: Coindesk).✴ Conclusion: The quarterly momentum reflects fundamental confidence, not speculative heat, Bitcoin is tracking macro cycles and policy favorability - not detaching from economic logic.⊢▦ Liquidity Rotation Signal:∴ While BTC saw a record monthly close above $106K in June, attention turned to the Euro, which surged ~4%, outperforming Bitcoin ~2.5% monthly gain - (source: Coindesk);∴ This signals capital movement out of the USD and into alternative monetary zones, including euro-pegged stablecoins, highlighting a shift in liquidity strategy. ✴ Conclusion: Bitcoin performance remains strong, but stablecoin flows suggest hedging against USD, and potential cross-currency dynamics now influence crypto markets more than in past cycles.⊢▦ Institutional Absorption:∴ Q2 2025 marked multiple treasury-scale Bitcoin purchases, the most notable was Strategy Inc.’s addition of $531 million in Bitcoin;∴ Coindesk reports increasing movement of aged coins, suggesting long-term holders are realizing profit selectively, not exiting fully;∴ Realized on-chain gains estimated around $2.4 billion, but SOPR and STH-P/L data show no speculative frenzy.✴ Conclusion: Institutional reaccumulation is active - distribution is rational, not euphoric, the market is cycling profits, not dissolving conviction.⊢▦ Sentiment & Policy Alignment:∴ Trump’s active endorsement of Bitcoin as a "strategic reserve instrument" has galvanized corporate treasuries and conservative capital;∴ Policy signals from the U.S. now mirror early El Salvador-like rhetoric but on a scaled geopolitical stage;∴ Meanwhile, legislative friction in the EU is softening, with euro-stablecoin flows confirming multi-jurisdictional bullish alignment.✴ Conclusion: Bitcoin is evolving from speculative asset into a political-economic monetary instrument. Its adoption curve is now influenced by state-level policy vectors, not just market actors.⊢⧈ Synthesis – Silent Codex Verdict:∴ Bitcoin’s Q2 expansion is rooted in structural convergence: (policy + macro easing + institutional inflows + on-chain discipline);∴ The asset is not overheated, and continues to mature within a globalized, politically aware framework;∴ The cycle breathes silently, with strength.⊢⌘ Codicillus Silentii – Strategic Note:∴ Resistance remains near $110K–112K, region of monthly closure highs;∴ EMA21 at $98K defines tactical floor - breach would signify shift in short-term conviction;∴ SSR at 17.6 suggests temporary stablecoin dryness, delaying momentum ignition.✴ Conclusion: Tactical posture is consolidative, awaiting macro or capital inflow catalyst.Upside remains open, but not yet inevitable.⊢𓂀 Stoic-Structural Interpretation:∴ Structurally Bullish – (Tactically Controlled);∴ Bitcoin maintains long-term structural dominance, anchored above the 200WMA and supported by rising Realized Cap and exchange outflows;∴ The RSI + EMA21 structure confirms active but non-euphoric momentum;∴ MVRV at 2.22 and SOPR at 1.03 reflect profitable cycling, not late-stage irrationality;∴ No blow-off volume or destabilizing divergence across timeframes.✴ Conclusion: Bitcoin is in mid-cycle ascension, exhibiting maturity, discipline, and policy-aligned backing. The structural bullish thesis is intact.⊢⧉⚜️ Magister Arcanvm – Vox Primordialis!𓂀 Wisdom begins in silence. Precision unfolds in strategy.⧉⊢
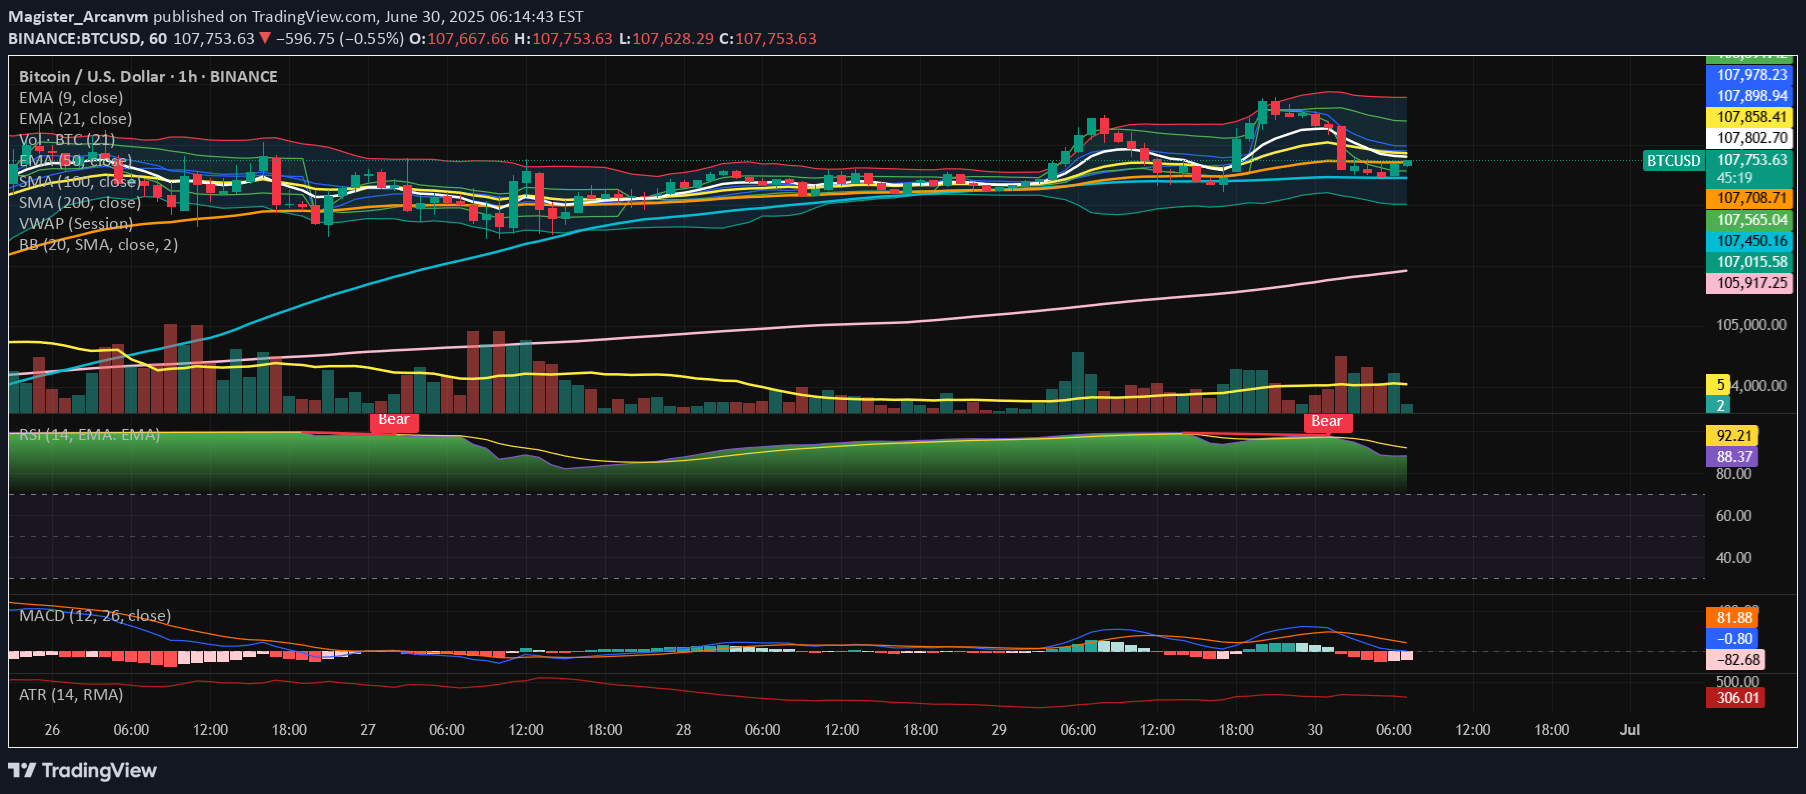
⊢⟁ BTC/USD – BINANCE – (CHART: 1H) – (Date: Jun 30, 2025).◇ Analysis Price: $107,599.99.⊢⨀ I. Temporal Axis – Strategic Interval – (1H):▦ EMA 9 – ($107,799.64):∴ The 9-period EMA remains above the current price, signaling downward rejection from short-term momentum line;∴ It recently crossed below the EMA21, reinforcing a weakening of bullish impulse.✴ Conclusion: EMA9 now acts as intraday resistance, confirming that immediate market strength has decayed and volatility expansion may continue unless reclaimed.⊢▦ EMA 21 – ($107,861.93):∴ EMA21 is sharply curved downward, validating loss of directional conviction from the previous bullish run;∴ This level aligns with a former consolidation zone, now potentially serving as a resistance pivot.✴ Conclusion: EMA21 confirms a short-term trend break, and the inability to reclaim this line would prolong corrective action.⊢▦ EMA 50 – ($107,703.87):∴ The EMA50 was breached decisively in the previous candle cluster, now positioned above price;∴ Slope is turning neutral-to-down, reflecting a transition from trend to turbulence.✴ Conclusion: EMA50 shift implies structural vulnerability in the intermediate frame, amplifying bearish tactical weight if no recovery emerges swiftly.⊢▦ SMA 100 – ($107,007.08):∴ SMA100 is currently positioned just below price, offering momentary support in case of further weakness;∴ Horizontal alignment indicates a pause or inflection zone, lacking directional strength.✴ Conclusion: SMA100 is a neutral-bullish support shelf, but could flip to active resistance if breached intraday.⊢▦ SMA 200 – ($105,890.26):∴ The SMA200 remains firmly upward-sloping and untouched — a sign of medium-trend resilience.∴ It defines the lower structural boundary for this time-frame.✴ Conclusion: SMA200 still holds bullish structural integrity, but if reached, it would represent a full reversion of recent strength.⊢▦ Volume + EMA 21 – (Current Vol: 5.31 BTC):∴ Volume shows an uptick during bearish candle clusters — indicative of active sell-side participation;∴ The EMA21 on volume reveals a rising slope, confirming that volatility is not passive, but driven by conviction.✴ Conclusion: Volume action supports the thesis of deliberate distribution, not merely rotational choppiness.⊢▦ VWAP (Session) – ($107,995.35):∴ Price has broken decisively below VWAP, showing institutional disengagement or absence of bid reinforcement;∴ VWAP now serves as magnetic resistance during any mean-reversion attempts.✴ Conclusion: VWAP position confirms that price is under fair-value, and current path is dominated by tactical sellers.⊢▦ Bollinger Bands – (Lower Band: $107,007.08):∴ Bands have widened, with price hugging the lower edge - a hallmark of volatility expansion;∴ Mean price ($107,895.00) sits significantly above spot, reinforcing downside pressure.✴ Conclusion: BB's suggest momentum breakdown, with price entering statistically stretched, yet uncorrected territory.⊢▦ RSI + EMA 9 – (RSI: 87.06 | EMA: 92.92):∴ RSI has sharply fallen from extreme overbought, but remains above the 70-level — reflecting ongoing exit from euphoric levels;∴ The EMA over RSI is crossing below, signaling loss of short-term strength and potential trend reversal.✴ Conclusion: RSI behavior implies a momentum peak has passed, though correction may still be in early phase.⊢▦ MACD – (MACD: 1.87 | Signal: -99.46 | Histogram: 101.33):∴ MACD histogram turned sharply positive following a steep drop, suggesting a potential pause in bearish acceleration;∴ Lines are converging but remain well below the zero axis - no bullish crossover yet.✴ Conclusion: MACD reflects oversold relief, but not reversal. Current state favors tactical caution rather than confidence.⊢▦ ATR (14, RMA) – (315.31):∴ ATR remains elevated, confirming ongoing high volatility and larger-than-average candle bodies;∴ This level sustains a risk zone scenario, where price swings may be unpredictable.✴ Conclusion: ATR indicates volatility expansion persists, further validating the need for defensive tactical posture.⊢🜎 Strategic Insight – Technical Oracle:∴ The technical constellation on the 1H chart reveals a clear breakdown of short-term bullish structure, now transitioning into a tactically bearish phase;∴ The rejection from VWAP and convergence of all EMA's above price confirm that any recovery must reclaim the 107.800–108.000 cluster to negate downside bias;∴ The current support rests on SMA100, yet its flat orientation and proximity to price suggest fragility, not strength. Meanwhile, SMA200 at 105.890 represents a more significant structural floor - its breach would mark a deeper tactical deterioration;∴ Volatility metrics (BB and ATR) indicate that the market is no longer coiled - it has entered expansion, and directional bias is momentarily controlled by sellers. RSI exiting overbought and MACD’s unresolved negative zone further support the thesis of ongoing correction, not mere pause;✴ Conclusion: In essence, the market has shifted into a correctional pulse, guided by structural breakdowns and expanding volatility. Tactical recoveries remain possible, but fragile and likely limited unless EMA's are reclaimed with force.⊢∫ II. On-Chain Intelligence – (Source: CryptoQuant):▦ Exchange Netflow Total – (All Exchanges) – (Last Recorded: +2.1K BTC):∴ Recent spike in netflow reveals a sudden influx of Bitcoin into centralized exchanges, marking the first positive divergence after a long series of outflows;∴ Such inflows historically precede tactical distribution events or profit-taking phases, especially following extended rallies.✴ Conclusion: Netflow confirms that holders are actively preparing to sell, giving real on-chain weight to the price rejection seen on the 1H chart.⊢▦ Short-Term Holder SOPR – (Latest Value: 1.012):∴ SOPR sits slightly above 1.0, but descending - indicating a transition from profit realization to potential break-even or loss selling;∴ If the trend continues and dips below 1.0, it marks capitulation from recent buyers — often a trigger for volatility spikes or local bottoms.✴ Conclusion: Current STH SOPR signals weakening conviction among short-term holders, supporting a corrective narrative rather than trend continuation.⊢🜎 Strategic Insight – On-Chain Oracle:∴ The on-chain substrate aligns precisely with the tactical weakness shown in the chart. The positive exchange netflow acts as a material indicator of sell-side readiness;∴ This inflow, breaking the historical trend of outflows, marks a shift in intent - from holding to liquidation;∴ Simultaneously, the Short-Term Holder SOPR sits on a critical edge. Its descent toward the 1.0 threshold implies that recent buyers are either approaching breakeven or beginning to capitulate;∴ This fragile posture typically amplifies local corrections, especially when coupled with rising volatility;∴ On-chain momentum no longer supports bullish continuation. Instead, it reflects hesitation, rotation, and distribution - all hallmarks of a short-term correction phase, in alignment with the temporal analysis;✴ Conclusion: The on-chain field confirms that the technical breakdown is not speculative - it is supported by active internal dynamics, signaling a pause or reversal in trend strength at a structural level.⊢⧈ Codicillus Silentii – Strategic Note:∴ The current H1 formation is a textbook example of post-euphoric fragility. What appeared as steady accumulation has now transitioned into a volatile de-leveraging phase. The confluence of bearish momentum, increased volume, and netflow reversal suggests the market is entering a tactical contraction zone;∴ No structural collapse is yet confirmed - but the absence of bullish defense at VWAP and EMA clusters denotes reduced resilience. Until these are reclaimed, all attempts at recovery must be viewed with caution.✴ Conclusion: Silence in structure signals preparation - not passivity. The next move shall emerge not from noise, but from the void left by exhaustion.⊢𓂀 Stoic-Structural Interpretation:∴ Structurally Bearish – Tactically Suspended;∴ The 1H chart shows a break below short-term momentum zones (EMA's, VWAP), confirming structural fragility;∴ Despite momentary support on SMA100, the loss of upward slope across the EMA's and RSI reversal validate a structural bearish bias;✴ Conclusion: Tactical direction remains suspended until one of two pivots is breached: either VWAP (~107.995) reclaimed, or SMA200 (~105.890) broken.⊢⧉⚜️ Magister Arcanvm – Vox Primordialis!𓂀 Wisdom begins in silence. Precision unfolds in strategy.⧉⊢⊢⧉ III. Contextvs Macro–Geopoliticvs – Interflux Economicvs - (Outlook – July 2025).⊢▦ US–China/UK Tariff Resolution Deadline – (July 9th):∴ The expiration of the 90-day tariff suspension looms, with only partial deals secured. Trump’s vague posture introduces volatility risk;∴ A lack of resolution may trigger reciprocal tariff escalations, dampening global liquidity and risk appetite.✴ Conclusion: Rising geopolitical friction may pressure speculative assets, delaying capital inflows into crypto markets during early July.⊢▦ US Tax Cuts + Spending Bill - (Trump Proposal):∴ Expected to inflate US national debt by $3.3T, nearing $36.2T, while lacking austerity backing;∴ Inflationary pressure may mount, but market reception depends on Senate reaction and Fed posture.✴ Conclusion: Fiscal expansion narrative could support medium-term Bitcoin hedging, though short-term uncertainty dominates.⊢▦ US Payroll Report – (July 3rd):∴ A critical macro trigger. A strong report may reinforce Fed neutrality or hawkishness, while a weak one may reintroduce easing expectations;∴ Risk assets, including Bitcoin, may respond sharply.✴ Conclusion: The payroll report will likely define the tactical tone for the first 10 days of July, shaping risk-on/off cycles.⊢
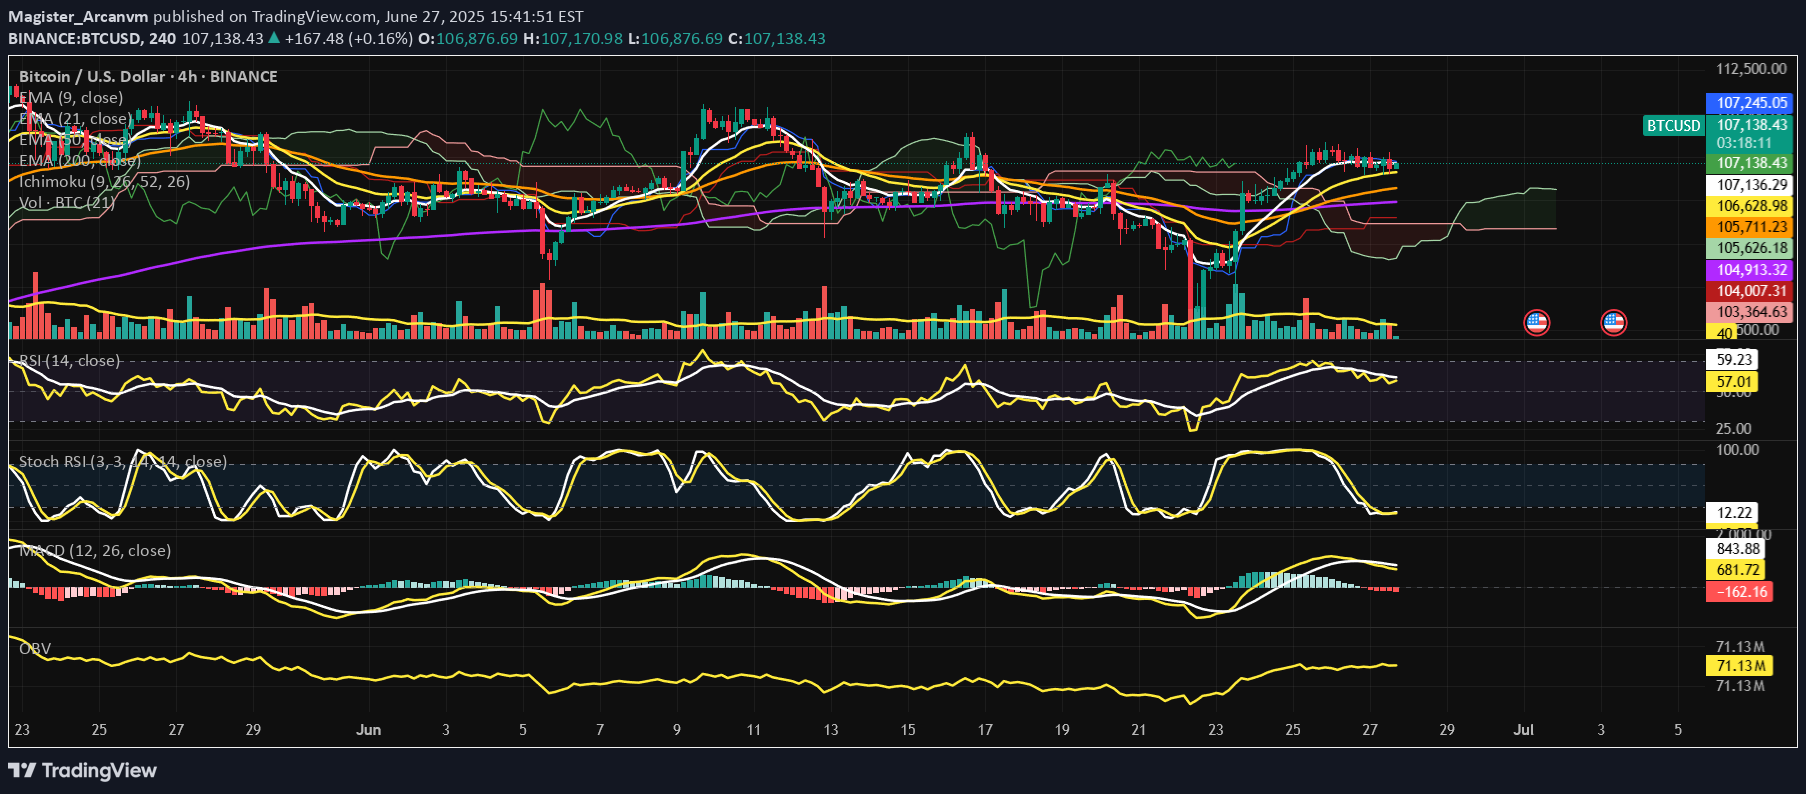
⊢⟁ BTC/USD – بایننس – (نمودار: 4 ساعته) – (27 ژوئن 2025).⟐ تحلیل قیمت: 106,840.15 دلار.⊢⨀ I. محور زمانی – بازه استراتژیک – (4 ساعته):▦ میانگین متحرک نمایی (9) – (107,126.95 دلار):∴ قیمت فعلی کمی پایینتر از میانگین متحرک نمایی (9) است که نشاندهنده شروع خستگی خریداران در طول روز است;∴ میانگین متحرک نمایی (9) هنوز به سمت بالا منحنی است و مومنتوم صعودی اخیر را حفظ میکند، اما نشانههایی از کاهش سرعت را نشان میدهد.✴️ نتیجهگیری: قدرت کوتاهمدت در حال تضعیف شدن است. پتانسیل تغییر جزئی در احساسات در حال وقوع است.⊢▦ میانگین متحرک نمایی (21) – (106,574.03 دلار):∴ میانگین متحرک نمایی (21) به عنوان حمایت دینامیک فوری عمل میکند، که اکنون از نزدیک آزمایش میشود;∴ هنوز به سمت بالا شیب دارد و نشان میدهد که خریداران در تلاش برای دفاع از ساختار هستند.✴️ نتیجهگیری: حمایت تاکتیکی دستنخورده باقی میماند - این خط نبرد است.⊢▦ میانگین متحرک نمایی (50) – (105,651.25 دلار):∴ ساختار میانمدت ثبات روند را تایید میکند، زیرا قیمت به خوبی بالاتر از میانگین متحرک نمایی (50) باقی میماند;∴ جهت میانگین متحرک نمایی (50) همچنان کمی صعودی است و کنترل میانمدت توسط خریداران را تقویت میکند.✴️ نتیجهگیری: روند میانمدت بدون تغییر باقی میماند; عقبنشینیها در چارچوب صعودی کنترل میشوند.⊢▦ میانگین متحرک نمایی (200) – (104,890.51 دلار):∴ خط پایه بلندمدت دستنخورده باقی میماند، با قیمت قابل توجهی بالاتر;∴ شیب میانگین متحرک نمایی (200) پایدار و کمی مثبت است.✴️ نتیجهگیری: پایه صعودی ساختاری دستنخورده باقی میماند. هیچ تهدید بلندمدتی شناسایی نشد.⊢▦ ابر ایچیموکو (9/26/52/26):∴ قیمت بالاتر از ابر کومو باقی میماند; تنکان و کیجون در یک شکلگیری صعودی همتراز هستند، اگرچه شروع به صاف شدن میکنند;∴ دهانه چیکو آزاد و شفاف بالاتر از قیمت تاریخی باقی میماند - بدون تعارض.✴️ نتیجهگیری: ساختار هنوز صعودی است، اما فشردهسازی در ابر نشاندهنده توقف بالقوه در اعتقاد جهتدار است.⊢▦ حجم (BTC) + میانگین متحرک (21):∴ حجم زیر میانگین متحرک 21 دورهای خود قرار دارد که نشاندهنده کاهش مشارکت خریداران است;∴ بدون شکست یا کندل تسلیم - احساسات محفوظ است.✴️ نتیجهگیری: فقدان اعتقاد - حجم عدم تصمیمگیری و توقف در انگیزه را تأیید میکند.⊢▦ RSI + میانگین متحرک نمایی 9 – (RSI: 54.78 / میانگین متحرک نمایی 9: 59.70):∴ RSI از منطقه بالای خنثی به سمت پایین منحنی است - مومنتوم در حال عقبنشینی است;∴ RSI از زیر میانگین متحرک نمایی (9) خود عبور کرده است، که معمولاً نشاندهنده محو شدن قدرت صعودی است.✴️ نتیجهگیری: مومنتوم تضعیف شده است - خریداران مردد هستند.⊢▦ Stoch RSI – (K: 9.72 / D: 10.22):∴ اسیلاتور در عمق منطقه بیش فروش قرار دارد و برای یک تقاطع صعودی آماده میشود;∴ هنوز تاییدی برای برگشت وجود ندارد - سیگنال اولیه.✴️ نتیجهگیری: تنظیمات برای بازگشت بالقوه وجود دارد، اما سیگنال هنوز تأیید نشده است.⊢▦ MACD – (MACD: 725.17 / سیگنال: 883.72 / هیستوگرام: –158.55):∴ هیستوگرام MACD بهطور فزایندهای منفی میشود که نشاندهنده زوال در مومنتوم است;∴ اگرچه خط MACD بالاتر از سیگنال باقی میماند، انحنا به زودی از یک تقاطع نزولی حمایت میکند.✴️ نتیجهگیری: مومنتوم در حال محو شدن است; خطر تقاطع فنی اگر ضعف ادامه یابد.⊢▦ OBV – (71.13M):∴ OBV مسطح است و هیچ واگرایی نشان نمیدهد، که نشاندهنده فشار متعادل است;∴ حرکت موازی با میانگین متحرک نمایی 21 باقی میماند، که خنثی بودن را تأیید میکند.✴️ نتیجهگیری: حجم flow از ادامه حمایت نمیکند; خنثی.⊢🜎 بینش استراتژیک – اوراکل فنی:∴ساختار در سطوح کلان و میانی صعودی باقی میماند;∴ همانطور که توسط همترازی میانگین متحرک نمایی و وضعیت ایچیموکو مشهود است. با این حال، سیگنالهای مومنتوم در حال محو شدن هستند، و کندل 4 ساعته فعلی فاقد اعتقاد است;∴ شکست نیاز به حجم قویتر و شتاب مجدد RSI دارد - تا آن زمان، موضع تاکتیکی به حالت تعلیق در میآید.⊢∫ II. هوش زنجیرهای – (CryptoQuant):▦ 1. جریان خالص صرافی – (همه صرافیها):∴ قرائتهای فعلی نشان میدهد که جریانهای خروجی خالص غالب هستند، که نشاندهنده خروج سکهها از صرافیها است - که معمولاً به عنوان رفتار نگهداری و تمایل صعودی تفسیر میشود;∴ هیچ افزایش اخیر در جریانهای ورودی وجود ندارد که نشاندهنده فشار فروش قریبالوقوع یا خطر دامپ باشد.✴️ نتیجهگیری: رفتار صرافی از نظر ساختاری صعودی است - محیط از انباشت حمایت میکند.⊢▦ 2. نسبت استیبلکوینهای صرافی – (همه صرافیها):∴ این نسبت پایین و پایدار باقی میماند، به این معنی که ذخایر بالای استیبلکوین در مقابل Bitcoin در صرافیها - که نشاندهنده قدرت خرید بالقوه در حالت آمادهباش است;∴ هیچ افزایشی در این نسبت وجود ندارد - هیچ تبدیل فوری از استیبلکوینها به Bitcoin.✴️ نتیجهگیری: استیبلکوینها در حالت آمادهباش تقاضای نهفته را تأیید میکنند - از تداوم صعودی در صورت فعال شدن پشتیبانی میکنند.⊢▦ 3. نرخهای تامین مالی – (همه صرافیها):∴ تامین مالی مثبت اما خفیف است، که نشاندهنده علاقه بلندمدت است، اما بیش از حد گرم نیست;∴ هیچ اهرم بیش از حد شناسایی نشد - عدم تعادل سوداگرانه.✴️ نتیجهگیری: بازار مشتقات از یک روند صعودی سالم بدون هیچ نشانهای از سرخوشی جمعی حمایت میکند.⊢▦ 4. نسبت اهرم تخمینی – (همه صرافیها):∴ نسبت اهرم در محدوده خنثی باقی میماند، به طور تهاجمی گسترش نمییابد;∴ نشان میدهد که بازار در حال حاضر تحت سلطه موقعیتهای اهرمی بیش از حد نیست.✴️ نتیجهگیری: ساختار پایدار است - هیچ خطر سیستمی از انحلال اجباری وجود ندارد.⊢▦ 5. نسبت خرید/فروش Taker – (همه صرافیها):∴ این نسبت کمی بالاتر از 1.0 است - به این معنی که خرید تهاجمیتر از فروش است، اما بدون سلطه;∴ احساسات خرید محتاطانه را تقویت میکند، هنوز سرخوشانه نیست.✴️ نتیجهگیری: Taker flow احساسات صعودی متوسط را تأیید میکند، هیچ فشار برگشتی وجود ندارد.⊢🜎 بینش استراتژیک – اوراکل زنجیرهای:∴ معیارهای زنجیرهای با صعودی بودن ساختاری همسو هستند;∴ جریانهای خالص، اهرم و فعالیت taker همگی از تداوم حمایت میکنند;∴ نکته مهم، نسبتهای استیبلکوین سیگنال میدهند که باروت خشک در دسترس باقی میماند، به این معنی که بازار انرژی بالقوه برای صعود بیشتر را در اختیار دارد - اگر حجم و تأیید فنی همسو شوند.⊢⧈ یادداشت استراتژیک Codicillus Silentii:∴ در انضباط سکوت، فرد منتظر میماند تا قیمت منطقه دینامیک خود را آزمایش کند. خردمند act پس از ساختار عمل میکند، نه در داخل عدم قطعیت;∴ زنجیره در زمزمهها صحبت میکند. نقدینگی هوشمند منتظر میماند. ساختار مسلح است - اما مومنتوم نیاز به احتراق دارد. نه ترس، نه امید - سیگنال.⊢𓂀 تفسیر رواقی-ساختاری:∴ از نظر ساختاری صعودی - (به طور تاکتیکی به حالت تعلیق درآمده);∴ معماری اصلی دستنخورده باقی میماند، اما عدم وجود حجم و کاهش اسیلاتورها توجیه کننده یک موضع معلق برای ورود است;∴ ساختارهای مبتنی بر زنجیره و نمودار در وضعیت صعودی همسو هستند، اما شاخصهای فنی در یک فاز تاکتیکی معلق باقی میمانند. منتظر شکست یا عقبنشینی عمیقتر برای موقعیتیابی.⊢▦ احتیاط محدوده تاکتیکی:∴ 106,574 دلار (میانگین متحرک نمایی 21) و 105,651 دلار (میانگین متحرک نمایی 50) را برای خرید واکنشی تماشا کنید;∴ زیر 104,890 دلار (میانگین متحرک نمایی 200) - ساختار تضعیف میشود;∴ شکست صعودی نیاز به بازیابی حجم بالاتر از 107,330 دلار دارد;∴ مقاومت: 107,330 دلار / 108,200 دلار.⊢⧉⚜️ Magister Arcanvm (𝟙⟠) – Vox Primordialis!𓂀 حکمت با سکوت آغاز میشود. دقت در استراتژی آشکار میشود.⧉⊢
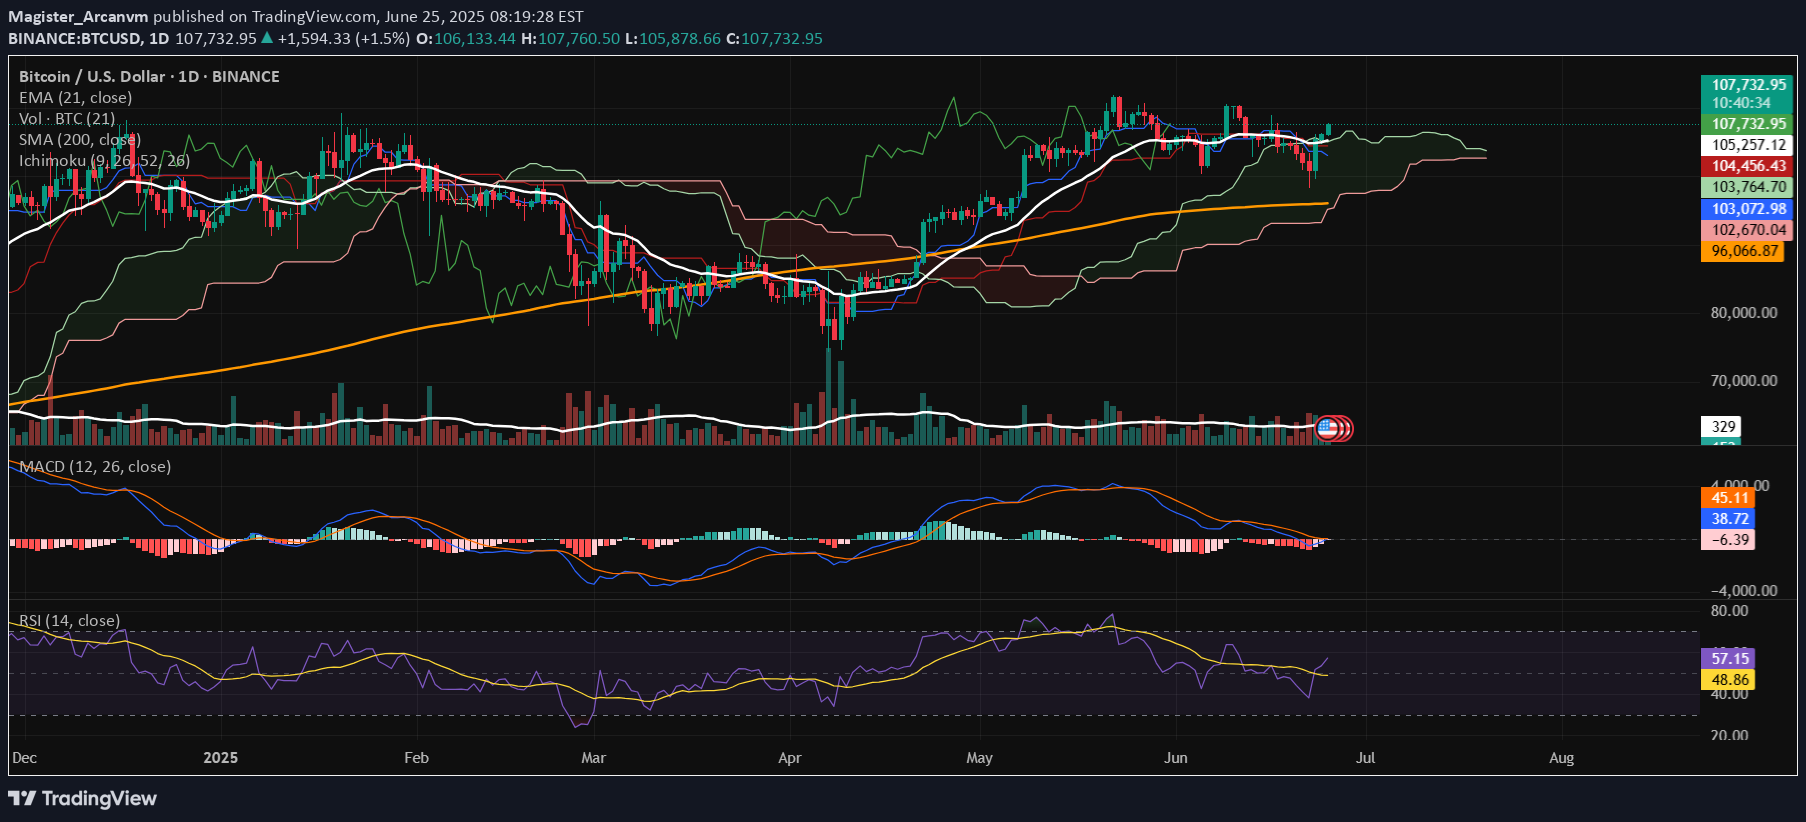
⊢⟁ BTC/USD – BINANCE – (CHART: 1D) – (Jun 25, 2025).⟐ Analysis Price: $107,191.94.⊢⨀ I. Temporal Axis – Strategic Interval – (1D):▦ EMA21 – ($105,207.93):∴ Price has reclaimed EMA21 decisively after testing below;∴ EMA21 maintains upward slope, indicating reactivation of short-term bullish sentiment;∴ Dynamic support now resides at ~$105.2K.✴️ Conclusion: EMA structure favors bullish continuation while price holds above.⊢▦ SMA200 – ($96,064.16):∴ SMA200 remains strongly upward sloped, untouched since March 2024;∴ Long-term momentum remains firmly bullish;∴ No contact with SMA200 confirms macro support far below.✴️ Conclusion: Structural support intact; macro uptrend fully confirmed.⊢▦ Ichimoku Cloud – ($103,065.53 / $104,456.43):∴ Price positioned above Kumo; bullish structure remains intact;∴ Kijun-sen ($104,456.43) and Tenkan-sen ($103,065.53) both flat, signaling short-term consolidation;∴ Chikou Span approaches historical resistance zone; Span A and B flattening.✴️ Conclusion: Bullish trend preserved, but lacking forward thrust; potential stagnation if breakout fails.⊢▦ Volume (MA21) – (~129 BTC):∴ Current volume ~128.73 BTC, slightly under the moving average;∴ No breakout volume confirmation despite recent price thrust;∴ Weak volume expansion reduces reliability of short-term breakout.✴️ Conclusion: Momentum requires validation through volume escalation.⊢▦ MACD – (-4.44 / 36.48 / -40.92):∴ Histogram contracting upward, bearish momentum fading;∴ MACD Line (-4.44) still below Signal Line (36.48);∴ No confirmed bullish crossover, but compression phase active.✴️ Conclusion: Latent bullish reversal potential; not yet validated.⊢▦ RSI – (55.95):∴ RSI reclaimed level above 50, positioning in neutral-bullish zone;∴ RSI MA at 48.78 confirms momentum shift;∴ Positive slope suggests rising momentum, but lacks steepness.✴️ Conclusion: Momentum entering constructive zone, still not impulsive.⊢🜎 Strategic Insight – Technical Oracle:∴ Structure remains technically bullish with constrained momentum;∴ Indicators are aligned toward continuation, yet breakout conviction is hindered by insufficient volume and pending oscillator confirmation;∴ Short-term path is upward-biased, conditional on validation.⊢∫ II. On-Chain Intelligence – (Source: CryptoQuant):▦ Exchange Netflow – (All Exchanges):∴ Netflow remains negative on 7-day average;∴ Sustained outflows indicate strategic accumulation or self-custody preference;∴ No evidence of large-scale exchange inflows that signal distribution.✴️ Conclusion: Net capital migration continues favoring off-exchange security; bullish underlying tone.⊢▦ Stablecoin Supply Ratio (SSR):∴ SSR near 17.5 indicates relatively low stablecoin dominance;∴ Reduced buying power vs Bitcoin implies cooling short-term demand;∴ Historically elevated SSR levels precede price consolidations or local tops.✴️ Conclusion: Stablecoin reserves insufficient for sustained upward pressure; caution warranted.⊢▦ Exchange Whale Ratio – (All Exchanges):∴ Whale Ratio near 0.59 denotes moderate large-holder activity;∴ Ratio not in critical zone (>0.7), yet above accumulation range (<0.4);∴ Potential soft distribution behavior if ratio trends upward.✴️ Conclusion: Mixed signal - no panic, but latent whale presence requires monitoring.⊢▦ Miner Reserve:∴ Miner balances steadily declining over past 30 days;∴ Consistent outflows suggest controlled selling behavior;∴ No aggressive miner dumping detected.✴️ Conclusion: Miner pressure exists but remains tactical and non-destructive.⊢▦ Long-Term Holder SOPR (LTH-SOPR):∴ Metric above 1.0 indicates long-term holders are in profit and realizing gains;∴ No sharp spike detected, suggesting rational distribution;∴ Structure consistent with healthy bull cycle mechanics.✴️ Conclusion: Profit-taking underway in equilibrium; not a signal of panic.⊢▦ Funding Rate – (Futures):∴ Funding mildly positive (~0.002–0.004%), reflecting long positioning bias;∴ Rates remain low, indicating lack of overcrowded trades;∴ No sign of speculative overheating in derivatives.✴️ Conclusion: Derivatives sentiment is constructive, not euphoric; room for further upside exists.⊢🜎 Strategic Insight – On-Chain Oracle:∴ On-chain metrics reflect a stable yet cautious accumulation phase; ∴ Absence of sell pressure, tempered long-term holder realization, and moderate derivative sentiment suggest foundation for continuation, albeit with reduced immediate force;∴ Confirmation must align with price and volume.⊢⧉ III. Contextvs Macro–Geopoliticvs – Interflux Economicvs:▦ Geopolitical Axis – Middle East Ceasefire:∴ Ceasefire between Israel and Iran eased global tension, triggering flight from commodities into risk assets;∴ Brent crude declined over -2.5% following truce reports, reducing inflationary pressure;∴ However, geopolitical fragility remains - peace is provisional, not structural;✴️ Conclusion: Tactical relief observed; no systemic safety guaranteed.⊢▦ Monetary Policy – US Federal Reserve Outlook:∴ Jerome Powell signals continued rate hold, citing sticky inflation and fragile global equilibrium;∴ Futures markets price ~20% chance of July cut, ~60% for September;∴ Bond yields retreating (2Y at ~3.78%), suggesting easing expectations embedded;✴️ Conclusion: Macro liquidity conditions marginally favorable to crypto; policy risk remains asymmetric.⊢▦ Equities & Global Sentiment – Dow Jones / Nasdaq Futures:∴ Dow Futures flat (~+0.02%), Nasdaq Futures rise on tech optimism;∴ Equity markets supported by decline in oil, stabilization in rates, and AI-sector inflows;∴ No VIX spike – volatility subdued;✴️ Conclusion: Macro-risk appetite firming up, enhancing crypto’s speculative appeal.⊢▦ Derivatives Behavior & Institutional Flow:∴ Option markets show accumulation of BTC calls at 108K–112K strike zones;∴ Futures funding positive but low, consistent with healthy long-side conviction;∴ No structural imbalance detected;✴️ Conclusion: Derivatives support scenario of moderate bullishness without speculative overreach.⊢⌘ Codicillus Silentii – Strategic Note:∴ Temporal architecture remains bullishly aligned, but lacks velocity – movement is present without ignition;∴ On-chain metrics reveal quiet distribution among long-term holders, yet without aggressive miner displacement or exchange flooding;∴ Market tension is suspended in a state of equilibrium – neither contraction nor breakout assert dominion;∴ The asymmetry of opportunity lies dormant, awaiting conviction in participation and volume.⊢𓂀 Stoic-Structural Interpretation:▦ Structurally Bullish – Tactically Suspended:∴ Price structure above EMA21 and SMA200 confirms preservation of macro uptrend – foundation remains unbroken;∴ Miner reserve reduction and stable LTH-SOPR suggest controlled realization, not structural weakness;∴ However, Ichimoku flattening and low volume expansion indicate stalling momentum, lacking breakout substance.⊢▦ Tactical Range Caution:∴ Whale Ratio mid-levels and SSR elevation highlight proximity to potential resistance exhaustion;∴ MACD crossover remains unconfirmed; RSI enters constructive zone without strength – reactionary rather than initiative-based;∴ Until volume and oscillator confirmation emerge above $108.2K, posture remains protective and selective.⊢⧉⚜️ Magister Arcanvm (𝟙⟠) – Vox Primordialis!𓂀 Wisdom begins in silence. Precision unfolds in strategy.⧉⊢⊢⟁ BTC/USD – Strategic Risk Framework & Market Structure Assessment (1D) – Jun 25, 2025.⊢⧉ III. Contextvs Macro–Geopoliticvs – Interflux Economicvs - (Expanded):▦ Geopolitical Axis – Ceasefire Reaction & Fragility:∴ BTC surged from ~$98K to above $107K following initial reports of a ceasefire between Iran and Israel;∴ Despite market relief, ceasefire violations were observed within 48 hours, confirming the fragile and temporary nature of the détente;∴ Risk-on sentiment remains conditional, tethered to geopolitical stability that is not yet structurally grounded.✴️ Conclusion: Relief rally evident, but sustainability remains exposed to renewed conflict headlines.(Source: The Block, Business Insider, Barron’s).⊢▦ Monetary Policy – Federal Reserve Demeanor:∴ Jerome Powell affirmed a data-dependent stance, signaling no urgency to cut rates despite moderated inflation prints;∴ CME FedWatch Tool implies ~20% probability of a July cut, ~60% for September - aligning with risk asset resilience;∴ Bond market reflects this positioning with 2Y and 10Y yields declining ~12 bps over past 5 sessions.✴️ Conclusion: Liquidity support intact; Fed posture provides non-hostile environment for crypto continuation.(Source: Coindesk, InfoMoney).⊢▦ Derivatives Flow – Liquidation Mechanics & Institutional Stance:∴ ~$350M in short liquidations occurred during the recent spike - reflecting a short-squeeze rather than euphoric positioning;∴ Funding rates remain positive but not excessive; implied volatility subdued, no evidence of irrational exuberance;∴ Bitcoin call options clustered at $108K–$112K, showing upside appetite with contained leverage.✴️ Conclusion: Institutional and derivatives positioning favors moderate continuation, not parabolic impulse.(Source: Coindesk, The Block).⊢▦ Crypto Sector Breadth – CoinDesk 20 / Miner Dynamics:∴ CoinDesk 20 index rose +0.5%, with BCH +6.0%, SOL +1.8%, and BTC +2.1%, suggesting broad-based participation;∴ Mining profitability up ~18% in May, hash rate rising modestly; North American miners now hold 26.3% dominance;∴ Health of the network and miner margins both structurally positive; selling pressure from miners remains low.✴️ Conclusion: Ecosystem-wide support in both asset price action and infrastructure metrics.(Source: Coindesk).⊢⧈ Codicillus Silentii – Strategic Note:∴ Bitcoin holds above structural levels while macro, on-chain, and geopolitical metrics align toward cautious optimism;∴ The ceasefire catalyzed immediate risk-on behavior, yet its fragility imposes a ceiling of restraint;∴ Market structure shows no speculative excess - sentiment is reactive, not manic;∴ Technicals, capital flows, and macro posture define a suspended state of potential - ignition awaits decisive trigger.⊢⧉⚜️ Magister Arcanvm (𝟙⟠) – Vox Primordialis!𓂀 Wisdom begins in silence. Precision unfolds in strategy.⧉⊢
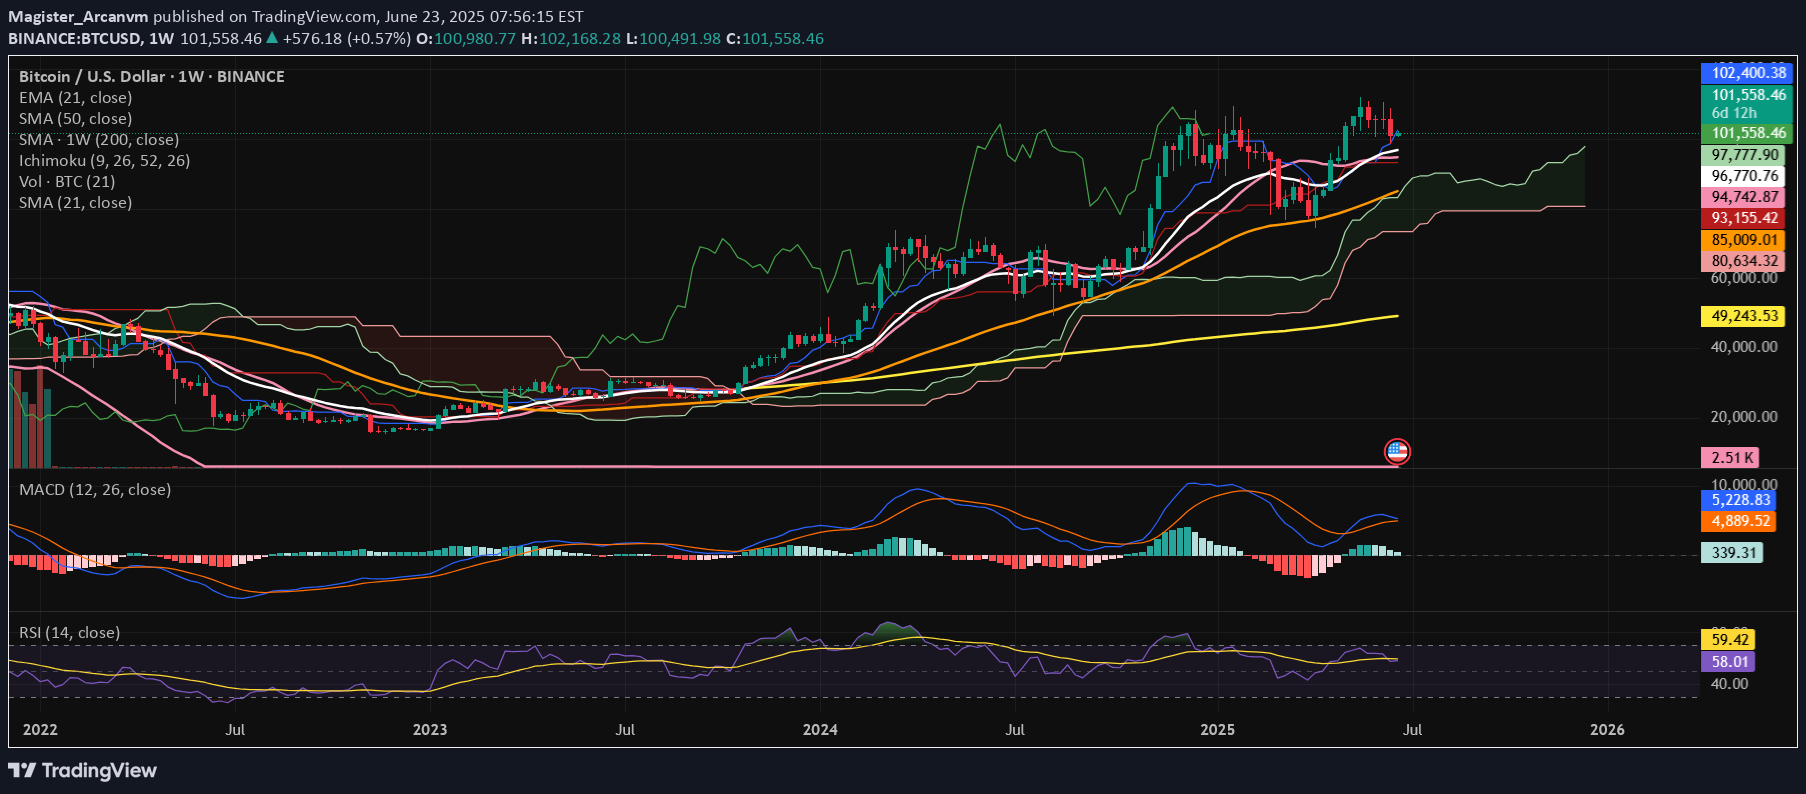
⊢⟁ BTC/USD – BINANCE – (CHART: 1W) – (Date: June 23, 2025).⟐ Analysis Price: $101,226.28.⊢⨀ I. Temporal Axis – Strategic Interval – (1W):▦ EMA21 – ($96,740.64):∴ Price remains above the 21EMA, confirming bullish structural integrity in medium trend;∴ The slope of EMA21 remains positive, reinforcing sustained market momentum;∴ Most recent candle printed a higher low above the 21EMA, reaffirming it as dynamic support.✴️ Conclusion: The 21EMA upholds the current cycle's bullish engine - it is the first invalidation level for any mid-term reversal.⊢▦ SMA50 – ($85,002.38):∴ SMA50 sits considerably below current price, reflecting distance from mean reversion zones;∴ Market remains extended, but no immediate signs of pullback toward this structural level;∴ The last interaction with SMA50 was in late 2023, when it confirmed trend resumption.✴️ Conclusion: SMA50 defines the core mid-range support - no threat to it unless a breakdown accelerates below EMA21.⊢▦ SMA200 – ($49,241.87):∴ SMA200 remains deeply below market, showing that the macro bullish structure remains unchallenged;∴ Distance from SMA200 reflects the strength and maturity of this cycle’s trend;∴ Long-term investors remain in profit and structurally supported.✴️ Conclusion: No macro breakdown as long as price stays well above SMA200 - the secular bull phase is intact.⊢▦ Ichimoku Cloud – (Kumo, Tenkan, Kijun, Chikou Span):∴ Price is trading clearly above the Kumo (cloud), showing sustained bullish dominance;∴ Tenkan-sen and Kijun-sen lines are positively stacked, with Tenkan still leading;∴ Chikou Span is above price and cloud, confirming long-term bullish alignment.✴️ Conclusion: All Ichimoku components confirm bullish control - weakening only upon Tenkan/Kijun flattening or bearish cross.⊢▦ MACD – (MACD: 318.17 | Signal: 4,884.24):∴ MACD line is far below the signal line, though attempting a bottoming curve;∴ The histogram remains red but with decreasing amplitude - bearish momentum is fading;∴ No bullish crossover yet - momentum remains negative but weakening.✴️ Conclusion: MACD suggests waning bearish cycle, but no official reversal signal until crossover and histogram neutralization.⊢▦ RSI + EMA21 – (RSI: 57.71 | RSI EMA: 59.39):∴ RSI remains in bullish territory above 50, although flattening below its EMA;∴ No bearish divergence observed yet - RSI is consolidating;∴ If RSI reclaims its EMA, strength may resume; if rejected again, loss of momentum may escalate.✴️ Conclusion: RSI reflects structural strength, but cautious momentum - monitoring RSI/EMA relationship is critical.⊢▦ Volume + SMA21 – (Vol: 2.51K):∴ Weekly volume remains below the 21-week average, indicating weakening participation;∴ Last few candles show declining volume despite price stability - possible distribution;∴ Absence of buyer aggression may limit further upside near-term.✴️ Conclusion: Volume suggests lack of conviction - momentum exists, but crowd participation is thinning.⊢🜎 Strategic Insight – Technical Oracle:∴ Bitcoin's weekly chart maintains bullish structural posture above all key moving averages, yet momentum indicators reflect hesitation;∴ The Ichimoku system confirms trend dominance, but MACD and RSI signal that internal strength is not expanding - only sustaining;∴ Volume contraction reveals market indecision or fatigue, potentially foreshadowing consolidation or rebalancing phases;∴ Despite no structural breakdown, directional conviction is lacking - further upside demands renewed volume and momentum alignment.⊢☍ II - GAP CME – BTC1! – Chicago Mercantile Exchange:▦ Previous CME Close – ($99,640.00) + Spot Opening Binance – ($100,980.77):∴ A clear upside gap is present between the institutional close and the retail spot open, measuring approximately $1,340.77, thus defining a latent Magnet Zone for downward pullback;∴ This CME gap forms a critical vacuum range between $99.640 and $100.980, which will likely act as a liquidity reabsorption zone if spot retraces;∴ No immediate fill has occurred, suggesting current bullish momentum persists despite latent imbalance.∴ The latest weekly CME candle closes with a smaller real body and a pronounced upper wick — a classical signal of buy-side exhaustion below macro resistance ($102K–$103K);∴ Despite the weakening thrust, no breakdown has yet been printed — the bullish structure remains technically intact above previous weekly lows;∴ Volume prints are non-expansive, indicating lack of conviction among institutional buyers at this level — vigilance is required.✴️ Conclusion: The CME structure reveals a latent institutional gap magnet to the downside, with price now suspended above an untested imbalance. The technical structure remains constructive but fragile. Further confirmation from the spot market will determine whether continuation or reversion will manifest in the coming cycle.⊢∫ III. On-Chain Intelligence – (Source: CryptoQuant):▦ Exchange Inflow Total – (All Exchanges):∴ A recent spike in total Bitcoin inflows aligns directly with the $101K zone, signaling increased movement of coins from wallets to exchanges;∴ Historically, such inflow spikes near local tops indicate preparation for distribution or profit-taking by large holders;∴ Current inflow levels exceed previous consolidation phases, amplifying the risk of sell pressure activation.✴️ Conclusion: The market is facing elevated short-term risk from exchange-bound liquidity — inflows confirm readiness to sell into strength.⊢▦ Spot Taker CVD – (Cumulative Volume Delta, 90-Day) – (All Exchanges):∴ The 90-day CVD curve shows clear flattening and early reversal near resistance, indicating a shift in taker behavior;∴ Passive sell-side absorption appears to dominate, reducing the strength of buy-side aggression;∴ Price action continues upward while CVD retreats, forming a classic hidden distribution divergence.✴️ Conclusion: CVD reveals taker exhaustion - without resurgence in spot demand, current price levels are vulnerable to sell-offs.⊢▦ Exchange Inflow Mean – (7-Day Moving Average) – (All Exchanges):∴ The 7DMA of inflow mean remains elevated, suggesting sustained presence of large-sized transactions heading toward exchanges;∴ This behavior often precedes institutional or strategic sales, especially when combined with total inflow spikes;∴ No decline in the inflow mean implies continuous preparation for short-term distribution.✴️ Conclusion: Elevated inflow mean confirms that whales and large actors are preparing or executing strategic exits.⊢▦ Funding Rate – (All Exchanges):∴ Rates across global derivatives platforms remain slightly positive but without speculative imbalance;∴ The neutral-positive range suggests cautious optimism among traders - not overleveraged, but not afraid;∴ No signs of euphoric long build-ups, which reduces liquidation risk but weakens breakout fuel.✴️ Conclusion: A neutral funding environment supports consolidation, not explosive upside — no immediate directional conviction.⊢▦ Funding Rate – (Binance):∴ Binance-specific funding remains tightly aligned with global averages, reflecting no localized distortion;∴ Positive, stable readings indicate low speculative friction, but also lack of trend-defining aggression;∴ Historical patterns show that breakout rallies typically require a surge in funding rate — not present yet.✴️ Conclusion: Binance traders are balanced - not short-squeezed nor euphoric - bias remains neutral until imbalance arises.⊢▦ Realized Price – Short-Term Holders (MVRV-STH) – (~$47.5K):∴ Price trades far above the STH realized price, indicating most recent buyers are deep in unrealized profit;∴ This dynamic historically increases the chance of sell pressure at resistance zones, especially when inflows are high;∴ No downward compression or convergence - suggesting strength remains, but realization is a persistent risk.✴️ Conclusion: STH's are exposed to high profit levels - the market is primed for potential realization, but not structural weakness.⊢🜎 Strategic Insight – On-Chain Oracle:∴ Exchange-based signals (Inflow Total, Mean) confirm active preparation for sell-side flow;∴ Spot aggression is fading as per CVD divergence, weakening breakout thesis despite strong price structure;∴ Neutral funding and passive miner/on-holder behavior reflect structural balance - not panic, not euphoria.✴️ Conclusion: The market rests in a zone of speculative tension - directionally undecided, but operationally sensitive to imbalance triggers.⊢⌘ Codicillus Silentii – Strategic Note:∴ The temporal structure signals resilience, but lacks expansion - technical relief exists without structural thrust;∴ On-chain flows unveil transactional friction at current levels, with capital cycling toward liquidity zones (exchanges);∴ Market energy is neither compressed for breakout nor collapsed into capitulation - a state of coiled hesitation;∴ Asymmetry remains hidden within equilibrium - vigilance, not movement, defines the moment.⊢𓂀 Stoic-Structural Interpretation:▦ Structurally Neutral:∴ Price holds above key macro supports (EMA21, SMA50), confirming preservation of the bullish superstructure;∴ Long-term holder behavior and miner flows remain passive - structural integrity is undisturbed;∴ However, no active thrust or trend validation emerges - the system sustains but does not ascend.⊢▦ Tactically Cautious:∴ Exchange inflows and CVD divergence signal short-term vulnerability near key resistances;∴ Technical indicators (MACD, RSI, Volume) reflect a condition of deceleration - momentum is reactionary, not foundational;∴ Until price reclaims volume-weighted levels with confirmation, the posture remains defensive and watchful.⊢⧉⚜️ Magister Arcanvm (𝟙⟠) – Vox Primordialis!𓂀 Wisdom begins in silence. Precision unfolds in strategy.⧉⊢
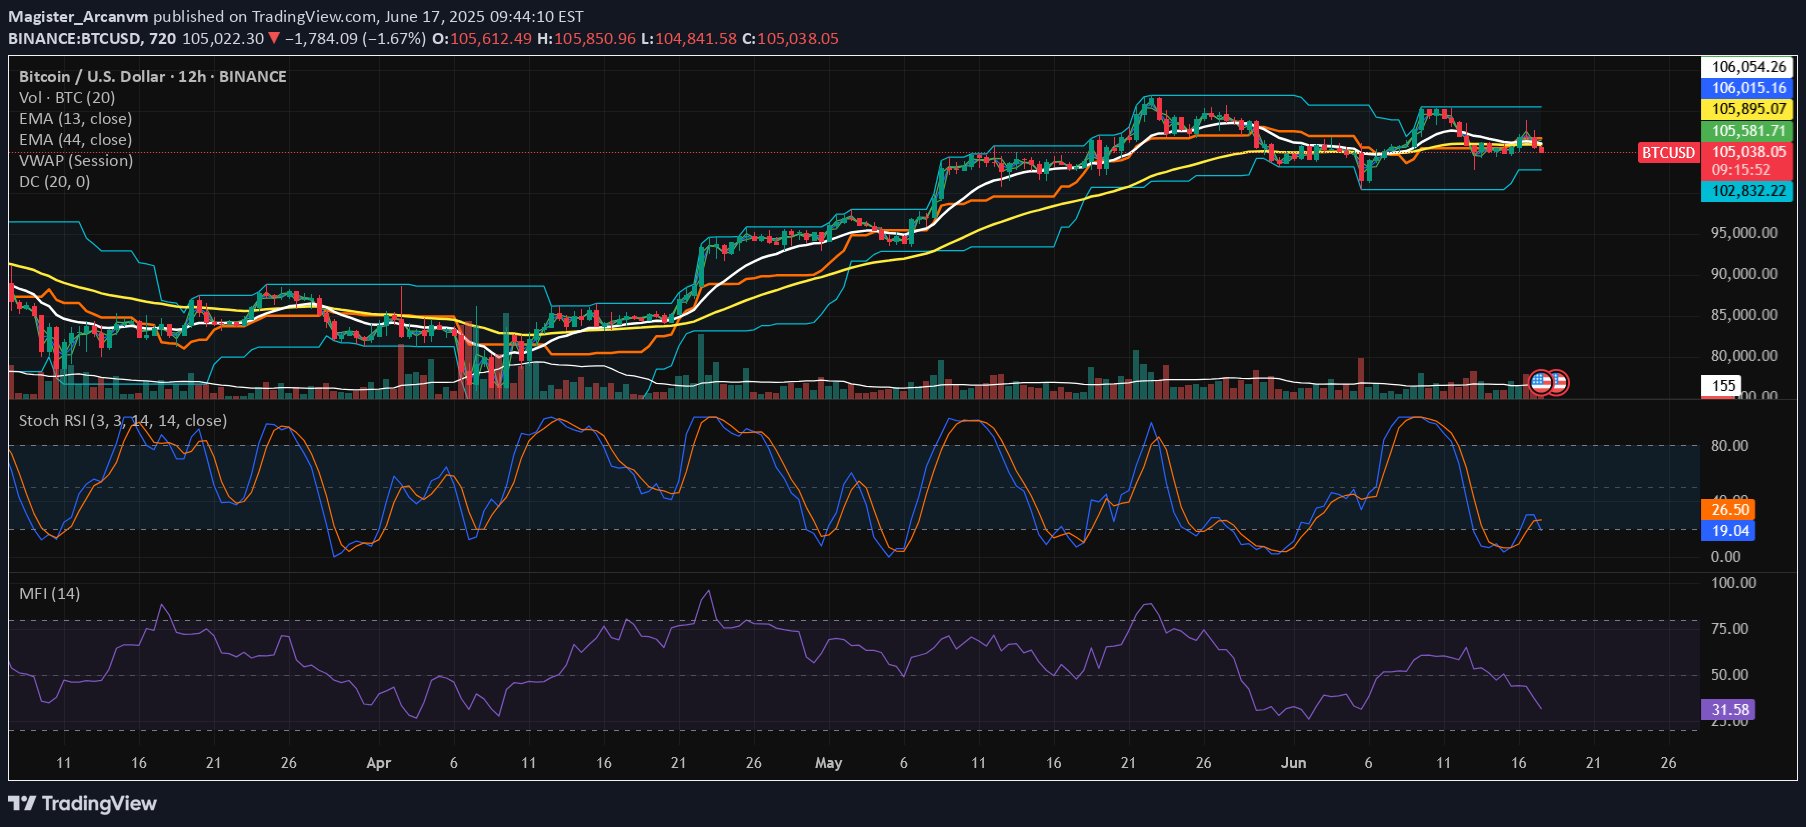
⊢⟁ BTC/USD - بایننس - (نمودار: ۱۲ ساعته) - (۱۷ ژوئن ۲۰۲۵).⟐ تحلیل قیمت: ۱۰۵،۳۲۴.۵۱ دلار.⊢⨀ ۱. محور زمانی – بازه استراتژیک – (۱۲ ساعته):▦ EMA13 – (۱۰۶،۰۹۴.۴۷ دلار):∴ خط سرعت مرموز به طور خلاصه بازپس گرفته شد، اما در آخرین بسته شدن کندل دوباره از دست رفت؛∴ قیمت از ۱۳ ژوئن به طور مداوم نتوانسته است بالاتر از EMA13 بسته شود، که نشان دهنده تضعیف مومنتوم است؛∴ اکنون به عنوان مقاومت دینامیک اصلی در ساختار ۱۲ ساعته عمل می کند.✴️ نتیجه گیری: EMA13 رد شده است. فشار نزولی همچنان در کنترل است.⊢▦ EMA44 – (۱۰۵،۹۰۷.۰۷ دلار):∴ قیمت در حال حاضر زیر EMA44 است، اگرچه کندل های اخیر هیچ اعتقاد نزولی قوی نشان نمی دهند؛∴ این سطح به عنوان یک میدان جنگ بی طرف عمل می کند - یک روند واقعی تنها با بسته شدن قاطعانه در بالا یا پایین پدیدار می شود؛∴ شیب مثبت باقی می ماند و از شکست فوری جلوگیری می کند.✴️ نتیجه گیری: EMA44 خط تعادل ساختاری است. زیر آن، ضعف ادامه دارد.⊢▦ VWAP (جلسه) – (۱۰۶،۱۱۷.۶۷ دلار):∴ VWAP بالاتر از قیمت فعلی قرار دارد و نشان دهنده رد ارزش نهادی است؛∴ تمام تلاش های اخیر برای بازپس گیری VWAP ناموفق بوده است، که نشان دهنده عدم وجود حجم خرید غالب است؛∴ تلاقی با EMA13 و Donchian upper band یک سقف فنی متحد ایجاد می کند.✴️ نتیجه گیری: کنترل نهادی همچنان غایب است. منطقه ارزش رد شد.⊢▦ کانال Donchian (۲۰) – (۱۰۶،۶۹۰.۹۵ دلار / ۱۰۲،۸۵۴.۴۹ دلار):∴ باندها باریک باقی می مانند و قیمت بین وسط کانال و محدوده پایین تثبیت می شود؛∴ Upper band به طور دقیق برای چندین جلسه مورد احترام قرار گرفته است؛∴ این نشان دهنده انتشار قریب الوقوع نوسانات از فشرده سازی است.✴️ نتیجه گیری: نوسانات به طور کامل فشرده شده است. گسترش نزدیک است.⊢▦ حجم - (MA20: ۱۵۴):∴ حجم زیر میانگین متحرک ۲۰ دوره ای باقی می ماند؛∴ هیچ فشار خرید یا فروش قوی، عدم تصمیم گیری را تایید نمی کند؛∴ بازار در سکوت استراتژیک قرار دارد.✴️ نتیجه گیری: منطقه فعالیت کم. حالت مشاهده غالب است.⊢▦ Stoch RSI (۳,۳,۱۴,۱۴) – (۲۱.۳۸ / ۲۷.۲۷):∴ اسیلاتور از منطقه اشباع فروش به سمت بالا عبور می کند، اما با مومنتوم ضعیف؛∴ تلاش برای بازیابی بالای ۴۰ هنوز کامل نشده است؛∴ خطر فیک آوت وجود دارد مگر اینکه کندل بعدی با حجم صعودی تایید شود.✴️ نتیجه گیری: سیگنال معکوس ضعیف است. مراقب شرایط تله باشید.⊢▦ MFI (۱۴) – (۳۱.۸۶):∴ شاخص پول flow در منطقه نقدینگی پایین باقی می ماند - هیچ نشانه ای از تجمع از سوی بازیکنان بزرگ وجود ندارد؛∴ هیچ واگرایی صعودی واضحی وجود ندارد، اما هیچ فروش هراسناکی نیز وجود ندارد؛∴ مسیر مسطح از ۱۰ ژوئن عدم مشارکت نهادی را تایید می کند.✴️ نتیجه گیری: سرمایه محتاط باقی می ماند. هیچ ورودی برای تحریک معکوس وجود ندارد.⊢🜎 بینش استراتژیک - اوراکل فنی:∴ اندیکاتورها فشرده سازی، رد شدن در ۱۰۶ هزار دلار و عدم وجود مومنتوم نهادی را نشان می دهند؛∴ ساختار قیمت خنثی-نزولی است و حجم، عدم تصمیم گیری را تایید می کند؛∴ شکست تنها در صورتی معتبر بود که بدنه کندل قوی و حجم +۱۸۰ BTC/12H داشته باشد.✴️ نتیجه گیری: صبر تاکتیکی توصیه می شود. منتظر شکست واقعی با تایید باشید.⊢∫ ۳. هوش زنجیره ای – (منبع: CryptoQuant):▦ کل ورودی صرافی – (همه صرافی ها):∴ کل ورودی های BTC زیر ۱۰K/روز باقی می ماند، بسیار پایین تر از آستانه های وحشت؛∴ هیچ جهشی بالاتر از ۵۰K BTC از اوایل آوریل وجود ندارد - مطابق با شرایط بازار خنثی است؛∴ این نشان دهنده رفتار نهنگ خفته و عدم وجود فاز توزیع قابل مشاهده است.✴️ نتیجه گیری: بازار در سکوت ساختاری است. هیچ نشانه ای از تسلیم شدن وجود ندارد.⊢▦ میانگین ورودی صرافی = (MA7) – (همه صرافی ها):∴ میانگین متحرک ۷ روزه اندازه ورودی به حدود ۰.۴ BTC کاهش یافته است - یک پایین ترین سطح تاریخی؛∴ نشان دهنده معاملات غالب خرده فروشی است، نه نهنگ ها؛∴ سوابق نشان می دهد که این الگو اغلب قبل از رویدادهای شکست رخ می دهد.✴️ نتیجه گیری: کیف پول های نهادی غیرفعال باقی می مانند. مومنتوم منتظر جرقه خارجی است.⊢▦ Spot Taker CVD - (دلتا حجم تجمعی، ۹۰ روزه):∴ خریداران هنوز تسلط اندکی دارند، اما منحنی در حال مسطح شدن است؛∴ این نشان دهنده خستگی تقاضا و رشد تعادل است؛∴ از نظر تاریخی قبل از توزیع مجدد یا عملکرد جانبی طولانی تر رخ می دهد.✴️ نتیجه گیری: بازار اسپات در حال خنثی شدن است. تقاضا کاهش می یابد. هیچ قدرت واضحی وجود ندارد.⊢🜎 بینش استراتژیک - اوراکل زنجیره ای:∴ همه شاخص های زنجیره ای مومنتوم ضعیف، ورودی کم و کاهش تقاضای اسپات را تایید می کنند؛∴ هیچ سیگنالی از فشار فروش سنگین وجود ندارد - اما هیچ موتوری برای رالی نیز وجود ندارد؛∴ این مهر سکوت است: جریان های سبک، حجم کم، عدم تعادل.✴️ نتیجه گیری: بازار منتظر محرک خارجی است. مراقب کاتالیزور باشید.⊢⧉ ۴. زمینه در مقابل ماکرو – ژئوپلیتیک در مقابل – اثر متقابل اقتصادی:▦ تنش های خاورمیانه - اسرائیل / ایران:∴ معاملات آتی Dow و S&P با افزایش هشدارهای تخلیه از تهران کاهش می یابد - (InfoMoney)؛∴ نفت خام تا +۲٪ افزایش می یابد - بازارها برای اختلال در عرضه از طریق هرمز آماده می شوند - (CryptoSlate)؛∴ جریان سرمایه جهانی به خزانه داری و طلا، نقدینگی را در دارایی های ریسک پذیر مانند BTC کاهش می دهد.✴️ نتیجه گیری: ریسک ژئوپلیتیکی ترس ماکرو را افزایش می دهد. Bitcoin با اینرسی ریسک گریز مواجه است.⊢▦ فعالیت ETF در مقابل چشم انداز ماکرو:∴ علیرغم ۱.۷ میلیارد دلار ورودی ETF در هفته گذشته، قیمت نتوانست مقاومتهای کلیدی را حفظ کند - (CryptoSlate)؛∴ این واگرایی نشان دهنده ترس فزاینده و اعتماد شکننده به قرار گرفتن در معرض کریپتو در میان تنش های جهانی است؛∴ تقاضای نهادی وجود دارد، اما تاثیر آن با سر و صدای ماکرو رقیق شده است.✴️ نتیجه گیری: جریان های ETF تحت بی ثباتی ماکرو هیچ مزیت واضحی را به ارمغان نمی آورند.⊢▦ رئیس فدرال رزرو پاول (آتی):∴ جروم پاول در ۱۹ ژوئن سخنرانی کرد - انتظار می رود در مورد توقف نرخ و راهنمایی آینده اظهار نظر کند - (Cointelegraph)؛∴ خرده فروشی data U S را تضعیف می کند. چشم انداز، اما موضع فدرال رزرو محتاطانه باقی می ماند - (FXStreet)؛∴ این سخنرانی احتمالاً نوسانات را در سراسر دارایی ها بازنشانی می کند.✴️ نتیجه گیری: پیام پاول نقطه محوری جهانی بعدی است. بازار منتظر است.⊢⚜️ ۱⟠ Magister Arcanvm – Vox Primordialis!⚖️ خرد با سکوت آغاز می شود. دقت در استراتژی آشکار می شود.⊢⊢⌘ Codicillus Silentii – یادداشت استراتژیک: تعصب فعلی خنثی با وزن نزولی است. هیچ ورودی معتبری در این زمان وجود ندارد. حجم باید هر تلاش برای شکست را تایید کند. مهر سکوت فعال باقی می ماند - ما تماشا می کنیم، نه واکنش نشان می دهیم.
سلب مسئولیت
هر محتوا و مطالب مندرج در سایت و کانالهای رسمی ارتباطی سهمتو، جمعبندی نظرات و تحلیلهای شخصی و غیر تعهد آور بوده و هیچگونه توصیهای مبنی بر خرید، فروش، ورود و یا خروج از بازار بورس و ارز دیجیتال نمی باشد. همچنین کلیه اخبار و تحلیلهای مندرج در سایت و کانالها، صرفا بازنشر اطلاعات از منابع رسمی و غیر رسمی داخلی و خارجی است و بدیهی است استفاده کنندگان محتوای مذکور، مسئول پیگیری و حصول اطمینان از اصالت و درستی مطالب هستند. از این رو ضمن سلب مسئولیت اعلام میدارد مسئولیت هرنوع تصمیم گیری و اقدام و سود و زیان احتمالی در بازار سرمایه و ارز دیجیتال، با شخص معامله گر است.