تحلیل تکنیکال Magister_Arcanvm درباره نماد BTC : توصیه به خرید (۱۴۰۴/۴/۲۷)

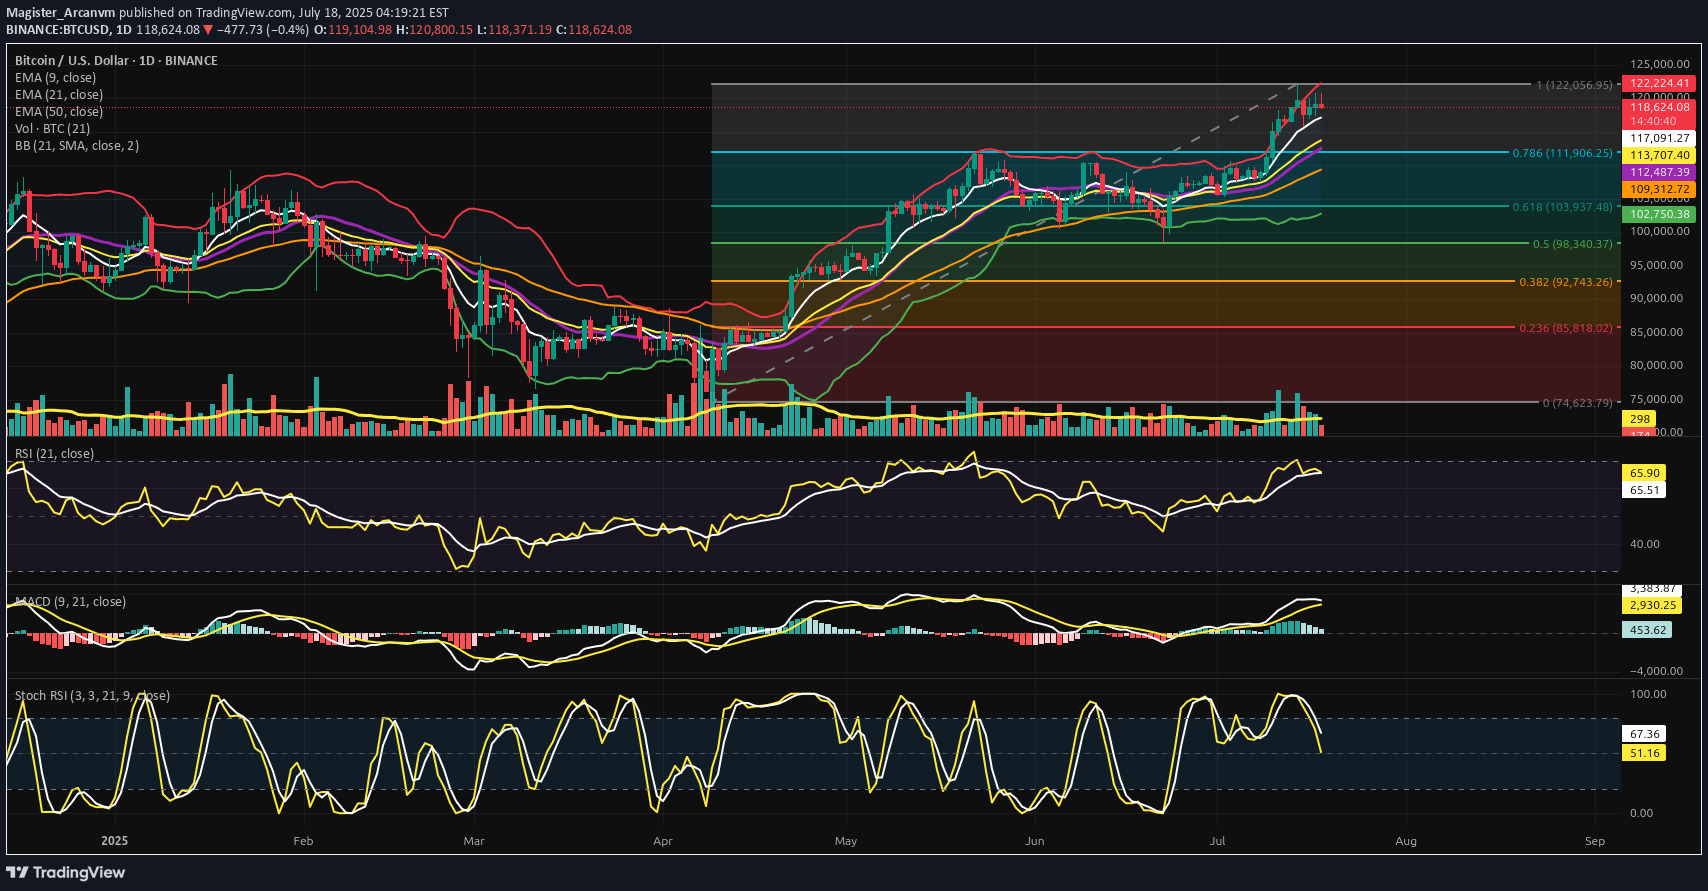
⊣ ⟁ BTC/USD - BINANCE - (CHART: 1D) - (Jul 18, 2025). ◇ Analysis Price: $118,866.60. ⊣ ⨀ I. Temporal Axis - Strategic Interval - (1D): ▦ EMA9 - (Exponential Moving Average - 9 Close): ∴ EMA9 is currently positioned at $119,077.81, closely tracking the current price, acting as dynamic micro-support; ∴ The slope of EMA9 remains upward, with price consistently closing above it in the past sessions; ∴ Compression candles are forming above this line, suggesting it is being defended as a tactical floor. ✴️ Conclusion: EMA9 is structurally supportive, signaling short-term bullish control beneath compression. ⊣ ▦ EMA21 - (Exponential Moving Average - 21 Close): ∴ EMA21 is placed at $118,537.29 and holds a clear upward slope; ∴ Recent pullbacks have tested the region near EMA21 but failed to close beneath it; ∴ EMA21 is establishing itself as the primary mid-range buffer zone within this bullish phase. ✴️ Conclusion: EMA21 confirms intermediate momentum preservation and mid-term trend integrity. ⊢ ▦ EMA50 - (Exponential Moving Average - 50 Close): ∴ EMA50 is located at $116,804.80 and remains untouched during the current rally phase; ∴ The distance between EMA21 and EMA50 is widening, confirming structural momentum; ∴ This line now functions as the lower tier of the bullish envelope - a defensive anchor. ✴️ Conclusion: EMA50 reflects resilient bullish understructure and rising support basin. ▦ Fibonacci Retracement - (ATH = $122,056.95 / Low = $74,623.79): ∴ Price is currently positioned just under the 0.786 level, a classic tension zone before ATH retests; ∴ The 0.618 level has already been claimed and held as support, showing strength through key retracements; ∴ The market is coiling between 0.786 and 1.000 in preparation for decisive expansion or rejection. ✴️ Conclusion: BTC sits within the golden gate - structurally pressurized near final resistance thresholds. ⊢ ▦ Bollinger Bands: ∴ Bands are visibly contracting, forming a volatility funnel around the current price zone; ∴ The price is maintaining proximity to the upper band without closing beyond it; ∴ The base band remains far beneath ($116k zone), indicating untriggered potential. ✴️ Conclusion: Volatility is compressing structurally; directional resolution is imminent. ⊢ ▦ Volume + EMA21: ∴ Volume bars have declined steadily during this upper-range consolidation; ∴ EMA21 on volume confirms weakening participation relative to early July moves; ∴ Absence of breakout-volume suggests either stealth accumulation or passive stalling. ✴️ Conclusion: Volume behavior is non-confirmatory - the structure floats without conviction. ⊢ ▦ RSI - (21) + EMA9: ∴ RSI(21) currently prints 60.45, above its own EMA9 at 59.41, suggesting net upward pressure; ∴ The RSI slope remains neutral-to-positive without entering overbought; ∴ The absence of bearish divergence confirms internal momentum coherence. ✴️ Conclusion: RSI structure is clean, moderate, and aligned with sustainable trend energy. ⊢ ▦ Stochastic RSI - (3,3,21,9): ∴ K = 78.78 | D = 71.55 - both above 70, nearing the overbought ceiling; ∴ The fast line (K) shows minor inflection but no confirmed cross; ∴ Momentum is elevated, but historical context shows price can remain extended. ✴️ Conclusion: Momentum is entering saturation zone - caution on short-term exhaustion. ⊢ ▦ MACD - (9,21): ∴ MACD line (540.52) remains above the signal line (414.93) in sustained bullish crossover; ∴ The histogram has begun flattening, indicating reduced acceleration; ∴ There is no bearish cross yet, but momentum build is slowing. ✴️ Conclusion: MACD supports bullish continuation, but thrust intensity is decaying. ⊢ ▦ OBV + EMA9: ∴ OBV reads 71.13M and is currently flat, with no new highs in accumulation; ∴ EMA9 on OBV closely hugs the raw OBV line, confirming stagnation; ∴ Prior upward surges in OBV are not being extended, showing tactical pause in conviction. ✴️ Conclusion: Liquidity expansion has halted; OBV structure is tactically neutral. ⊢ 🜎 Strategic Insight - Technical Oracle: ∴ The BTC/USD structure is entering a compressed apex between structural momentum (EMA stack, RSI, MACD) and tactical exhaustion signals (Stochastic RSI, Bollinger Band constriction, flattening OBV); ∴ Price is stabilizing just beneath the ATH gate ($122,056), indicating a threshold scenario - where breakout and rejection probabilities are approaching parity; ∴ Volume decline reflects the absence of forced participation, and suggests that the next move will be event-triggered or liquidity-engineered. The current environment favors volatility re-expansion, not trend reversal; ✴️ This is a threshold phase: structurally bullish, tactically suspended, awaiting ignition. ⊢ ∫ II. On-Chain Intelligence – (Source: CryptoQuant): ▦ Exchange Netflow Total + EMA9: ∴ Current Netflow: -938 Bitcoins - sustained negative flow over time indicates coins leaving exchanges; ∴ Persistent outflows reflect holding sentiment and reduced immediate sell pressure; ∴ Price action shows historical upside alignment when netflows remain negative across clusters. ✴️ Conclusion: Exchange behavior signals macro holding bias, not liquidation cycles. ⊢ ▦ Binary CDD + EMA9: ∴ Binary CDD has spiked into high activity zones in the past week, showing awakened dormant coins; ∴ This metric historically precedes localized tops when synchronized with weak flows; ∴ However, no consistent clusters are forming - signals remain scattered. ✴️ Conclusion: Binary CDD reflects isolated movements, not systemic awakening or distribution. ⊢ ▦ Exchange Whale Ratio + EMA9: ∴ Current ratio hovers at ~0.62 - elevated but not extreme; ∴ Sustained whale activity near 0.60+ can precede volatility events; ∴ Trendline is rising since May, showing gradual uptick in dominance from top senders. ✴️ Conclusion: Whale activity is tactically elevated, implying latent strategic intent. ⊢ ▦ Supply-Adjusted Dormancy + EMA9: ∴ Dormancy values are near historical lows, indicating old coins are staying inactive; ∴ EMA9 confirms a downward trend in dormant supply movement; ∴ Long-term holders are not distributing at this level. ✴️ Conclusion: Structural dormancy supports holder conviction - no exit signals from old supply. ⊢ ▦ Realized Cap + EMA9: ∴ Realized Cap is now exceeding $1T, rising consistently without parabolic spikes; ∴ EMA(9) and line are in lockstep - a healthy ascent; ∴ No acceleration = no blow-off = sustainable revaluation. ✴️ Conclusion: Value accumulation remains organic, not euphoric. ⊢ ▦ MVRV Ratio + EMA9: ∴ MVRV sits at 2.36 - below historical overvaluation levels (>3.0); ∴ EMA(9) confirms gradual slope upward, consistent with price; ∴ Ratio is not overheated - risk/reward remains structurally favorable. ✴️ Conclusion: MVRV indicates non-euphoric regime - mid-phase of value appreciation. ⊢ ▦ BTC vs GOLD vs S&P500 - (BGemetrix Comparative Graph): ∴ BTC continues to outperform both GOLD and SPX in long-term slope, even after corrections; ∴ Current phase shows GOLD flattening and SPX slightly lagging BTC in verticality; ∴ This divergence hints at BTC leading in speculative rotation while traditional assets stabilize. ✴️ Conclusion: BTC holds macro-dominance position, operating as the apex volatility proxy in current intermarket structure. ⊢ 🜎 Strategic Insight - On-Chain Oracle: ∴ Despite short-term compression, the on-chain structure reveals no distribution threats; ∴ Holder conviction, realized valuation, and MVRV slope all suggest controlled structural appreciation, not mania; ∴ Whales are tactically present, but dormancy and exchange flows confirm no mass exit; ∴ This is an internally coherent, tactically patient regime. ✴️ Bitcoin is preparing, not peaking. ⊢ 𓂀 Stoic-Structural Interpretation: ▦ Structurally Bullish - Tactically Suspended: ∴ All key EMA's (9/21/50) are stacked and rising; price remains elevated yet non-parabolic; ∴ Fibonacci apex is active, with price compressing beneath the ATH zone ($122,056), not retreating; ∴ On-chain intelligence confirms long-term conviction, with no distribution from whales or dormants. ✴️ Conclusion: The system retains structural strength; pressure is latent, not expired. The architecture is bullish, not euphoric. ⊢ ▦ Tactical Range Caution: ∴ Stochastic RSI and MACD show early-stage exhaustion; ∴ Volume has declined into apex, favoring liquidity traps or volatility bursts; ∴ Whale Ratio elevation implies pre-positioning behavior, not public confirmation. ✴️ Conclusion: Tactical maneuvering is dominant. Breakout potential exists but is not trustable until confirmed by volume and displacement. ⊢ ⧉ Cryptorvm Dominvs · ⚜️ MAGISTER ARCANVM ⚜️ · Vox Primordialis ⌬ - Wisdom begins in silence. Precision unfolds in strategy - ⌬ ⧉ ⊢⊣ ⟁ BTC/USD - BINANCE - (CHART: 1D) - (July 18, 2025): ⊣ ⨀ I. Temporal Axis - Strategic Interval - (1D): Corrected indicators below: ▦ RSI - (21) + EMA9: ∴ RSI = 66.97 | EMA9(RSI) = 65.72 - both climbing; ∴ RSI is closer to overbought zone than in the H4 view; ∴ No divergence is present, but proximity to resistance warrants caution. ✴️ Conclusion: RSI remains structurally sound, with slight tension emerging near upper bounds. ⊢ ▦ MACD - (9,21): ∴ MACD Line = 3,431.11 | Signal Line = 2,939.70 - strong bullish gap persists; ∴ Histogram is rising, unlike the flat pattern in the H4 chart; ∴ Structural momentum is intact and increasing. ✴️ Conclusion: MACD shows reinforced bullish thrust from the base - momentum remains intact. ⊢ ▦ Stochastic RSI - (3,3,21,9): ∴ K = 58.47 | D = 69.80 - both lines now crossing downward, exiting overbought; ∴ This descending structure is clearer on the 1D chart, marking a momentum slowdown; ∴ The D > K crossover confirms loss of short-term thrust. ✴️ Conclusion: Tactical momentum is clearly fading - structure holds, but impulse is weakening. ⊢
