
Erictaylor
@t_Erictaylor

تریدر چه نمادی را توصیه به خرید کرده؟
سابقه خرید
تخمین بازدهی ماه به ماه تریدر
پیام های تریدر
فیلتر
نوع پیام
Erictaylor
ETC pattern is getting Really Tight. Big move coming

پس از یک جهش عالی از 50% بازگشت به 28.66 دلار، ما به منطقه 35 دلار بازگشتیم، در اینجا با مقاومت مواجه شدیم، اما اکنون در حال ایجاد یک مثلث متقارن در اینجا با مقاومت شکست 34.40 و مقاومت FIB 34.70 هستیم. و پشتیبانی الگو در حدود ناحیه 33-33.30 قرار دارد. به سمت 37 دلار به عقب برانید در حالی که یک هدف شکست می تواند ما را به آزمایش مجدد منطقه 31-30.50 دلار برساند. منتظر حرکت بعدی خود هستم، اما فشار بالای 35 دلار با اطمینان می تواند معامله طولانی طولانی برای ادامه به منطقه رد قبلی 40 باشد. $ در حالی که یک شکست می تواند برای یک الگوی W بزرگتر با پایین تر تنظیم شود
Erictaylor
Etc

نه، تلاش برای انجام یک معامله خطرناک بود، به امید خروج از این الگو، حتی اگر هنوز به اندازه کافی سفت به نظر نمی رسد، Ethereum به نظر می رسید که قرار است شروع شود و در نهایت ظاهر شد. یا حداقل با بازگشت به داخل، در نهایت کمی در این معامله ضرر کردم، اما خوب بود. من متوقف شدم من هنوز با آن تمام نشدهام زیرا از زمانی که از اینجا عقب نشینی کردیم، در حال حاضر روی 50% اصلاحی از پایین به این ناحیه دوباله بالا اخیر نشستهایم. به نظر من این مکان خوبی برای بارگذاری مجدد و غیره است. به طور کلی من می بینم که حرکت بزرگی در ماه های آینده حداقل در مورد eTC در راه است. موفق باشید
Erictaylor
Etc

این یک پسر کوچولوی یواشکی است. با این حال این یک الگوی بزرگ است که برای مدتی در حال تثبیت بوده است. اگرچه من معمولاً الگوهای خود را بسیار فشردهتر دوست دارم، اگر Ethereum را نمودار کنیم، الگوی تنظیم دقیقاً با اندازه الگو و منطقه شکست یکسان است. از انتهای پایین الگو مستقیماً به سمت بالا حرکت کرده است، اما با توجه به مقاومت روند، این شکست در 37.30 دلار است. این یک راهاندازی پیچیدهتر است، زیرا میتواند به آن کمک کند، اما قسمت بالای الگو فقط به عقب میافتد. فکر من این است که حدود 37.50 را به اینجا اضافه کنم. همچنین داشتن یک سفارش خرید در قیمت 34.50 برای عقب نشینی در صورتی که این معامله اولیه در حال حاضر اشتباه باشد. معامله این است که این را به حدود 65-75.00 دلار برگردانید تا نیمی از موقعیت را بفروشیم و ببینیم که پس از آن چه واکنشی نشان میدهیم. مطمئنا این کار شد اما به دنبال ethereum بود.
Erictaylor
Shib

تا اینجا ما دو تاپ داریم. با این حال، اگر shib بتواند در ناحیه 3025 باقی بماند و به عنوان پشتیبانی تأیید کند که صعودی super بود. من ممکن است ببینم که دوباره به سمت 2800 می کشد و این مثلث صعودی را قبل از بلند شدن بعدی می سازد. 3300 سبک مقاومت کلیدی بالا تخت است که گاوها را در کنترل نشان می دهد. برای تنگ تر شدن به زمان بیشتری نیاز دارید. نزول به سمت 2800 را بخرید.
Erictaylor
Xrp

به نظر می رسد در حال تثبیت بالاتر از کانال روند صعودی قبلی است. در ابتدا فکر میکردم Xrp تمام شده است، اما به نظر میرسد Xrp میخواهد بالاترین سطح قبلی را امتحان کند. احتمالاً و فراتر از آن، تا زمانی که XRP بالای این کانال قبلی باقی بماند، زیرا پشتیبانی این گوه در حال سقوط می تواند ما را به آزمایش مجدد 2.90 برگرداند و Mabey بالا رفته و برای 3.50-4$ تلاش کنید! می توانید ورودی بین 2.22-2.28 را امتحان کنید. توقف ضرر زیر 2.07. هدف گیری 2.90 -3.90. برای ایمنی با بالا رفتن سود، سود ببرید
Erictaylor
Shib

پس از حرکت بسیار مناسبی که اخیرا داشتیم shib حدود 50 درصد از حرکتی را که داشتیم عقب کشیده است. ما هنوز خیلی بالاتر از منطقه شکست باقی میمانیم. این یک نشانه بزرگ برای ما است. اکنون دوباره در حال تثبیت است و به نظر می رسد در اینجا تنگ تر می شود. میتوانیم شروع به خم شدن کنیم و به سمت بالا برگردیم و در نهایت منطقه 3025 را بشکنیم و نگه داشتن بالا علامت گاو نر بعدی بود که نیاز داریم. من همچنان به بارگیری در این مورد ادامه میدهم در حالی که سطح آن زیر 3k است. در دراز مدت این به نظر شخصی من ارزش خرید را دارد. بیایید ببینیم که آیا shib می تواند به زودی در اینجا ظاهر شود. میبینم داره تنگ تر میشه
Erictaylor
Shib

Shib. مدتی است که تثبیت شده است. Doge سکه بسیاری از رعد و برق را دزدیده است. Shib در حال ساختن یک مثلث متقارن با مقاومت در حدود 2600 ناحیه است. حرکت بعدی میتواند ما را تا 3700 بالا ببرد که ردیابی فیب بعدی است، اما با هدف مثلث جزر و مدی غروب خورشید فعلی 3500، من در حال خرید shib در این نقطه تا 2350 هستم. Shib برای ساختن آماده میشود. به نظر من یک پا بزرگ است ممکن است زمانی برای خرید باشد
Erictaylor
Gme

الگوی بزرگ. برگزاری پشتیبانی صعودی خرابی جعلی و بازپس گیری پشتیبانی داشت. این زمان شروع انباشت است. من داخل هستم! بیایید به دنبال 33-34 دلار باشیم
Erictaylor
Btc

در تلاش برای نگه داشتن بالای 73k، ممکن است بالاترین سطح خود را در اینجا پیدا کرده باشیم. زمان برای اصلاح بالقوه بزرگتر است. در حال حاضر در یک الگوی جمعبندی هفتگی است، بنابراین این کار زمان میبرد. پشتیبانی از الگوی انباشتگی گفته شده 62 هزار است که میتوانیم پایین بیاییم و از آن جهش کنیم. من شخصاً فکر نمیکنم که این الگو به یک علامت صعودی تبدیل شود، هرچند ممکن است BtC یک پایه دیگر داشته باشد. این بر اساس روشی که تصمیم می گیرد از این الگو خارج شود، تعیین شد. در حال حاضر من انتهای بالایی این مقاومت الگو را کوتاه میکنم زیرا در حدود 71.9-71.6 ناحیه مشخص شده است.
Erictaylor
Coin
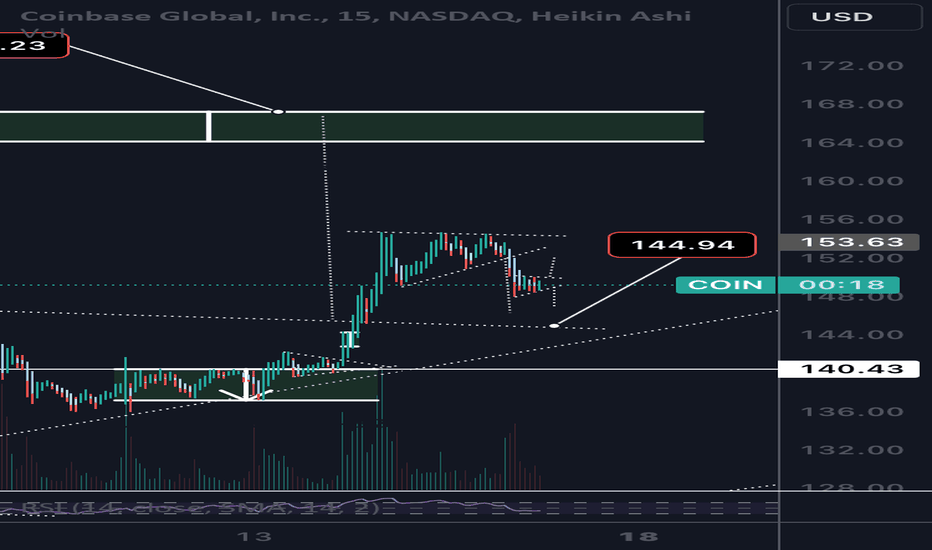
یک شکست بسیار خوب داشت که شاهد رد شدن خوب در منطقه 155 بود ما فقط از یک مثلث متقارن جدا شدیم که می توانست این روند را به 160 برساند اما در حال حاضر شکست خورده است. من هنوز سکه صعودی هستم اما مبی باید بیایم به این الگوی برگردیم و دوباره از آن استفاده کنیم. من در حال شورت در سکه هستم و به دنبال آزمایش مجدد 144 یا 140 هستم. با احتیاط Trinagle Symtrical که از حدود 152 شکستیم Z … هدف 146.40 برای امروز Tarhet دارد. این الگوی درمانی یک مثلث سمتریک کوچکتر از 148-150 $ است هنوز مطمئن نیستم که کدام راه شکسته شد ، اما من فکر می کنم حداقل تا 146-144 به نزولی بپردازم. اما اگر 150 را بشکنیم و این را پس بگیریم ممکن است من را از تجارت نزولی من متوقف کند امیدوارم الگویی که من ترسیم کرده ام باعث می شود
سلب مسئولیت
هر محتوا و مطالب مندرج در سایت و کانالهای رسمی ارتباطی سهمتو، جمعبندی نظرات و تحلیلهای شخصی و غیر تعهد آور بوده و هیچگونه توصیهای مبنی بر خرید، فروش، ورود و یا خروج از بازارهای مالی نمی باشد. همچنین کلیه اخبار و تحلیلهای مندرج در سایت و کانالها، صرفا بازنشر اطلاعات از منابع رسمی و غیر رسمی داخلی و خارجی است و بدیهی است استفاده کنندگان محتوای مذکور، مسئول پیگیری و حصول اطمینان از اصالت و درستی مطالب هستند. از این رو ضمن سلب مسئولیت اعلام میدارد مسئولیت هرنوع تصمیم گیری و اقدام و سود و زیان احتمالی در بازار سرمایه و ارز دیجیتال، با شخص معامله گر است.