
xazzam
@t_xazzam

What symbols does the trader recommend buying?
Purchase History
پیام های تریدر
Filter
xazzam
تحليل ordi وارتفاع 300% قريب - ordi analysis and 300% rise soon

A deal targeting a 300% rise 🔥👌🏻🟢 ORDI/USDT Entry: $30-35 Targets are shown 🤝🏻At each target, take your profits and raise the stop loss.
xazzam
تحليل عملة OP/USDT يشير إلى فرصة صعودية قوية بناءً على النمو

The analysis of the OP/USDT pair indicates a strong bullish opportunity based on the current technical model. If the price breaks the $1.8 level, this could confirm entry into a potential upward trend. This trade targets multiple higher levels, starting with an initial target of $2.2, followed by $3.5, then $4.8, and an ultimate target of $7. The estimated trade period is approximately seven months, with an expected upside of 400%.
xazzam
تحديث البيتكوين 05.06.2024 - Bitcoin Price Update
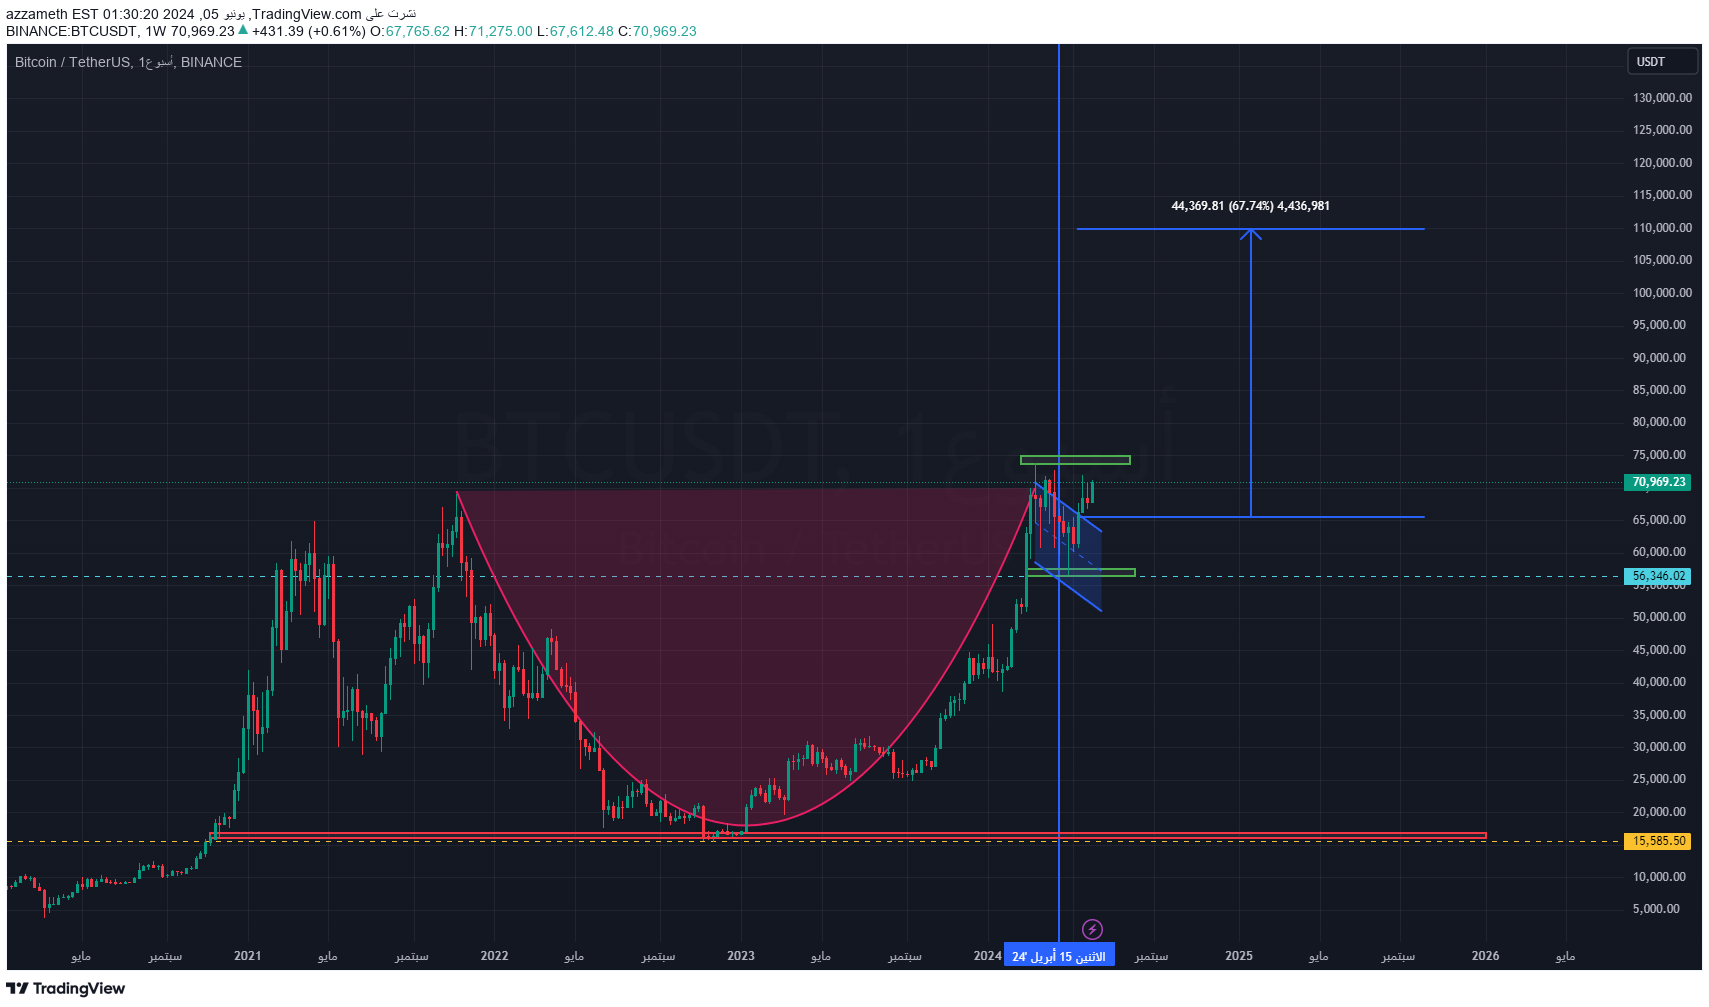
80% of the cup and handle pattern has been formed on the weekly chart. Based on this strong technical pattern, we expect to see Bitcoin achieve the following targets in the near future: $85,000 $95,000 $100,000 $105,000 $110,000 🔍 Follow our analyzes for more updates on market movement and investment opportunities! 💹 #Bitcoin #TechnicalAnalysis #Investing #Crypto #Trading $bitcoin $crypto ETH BTC $target SUI #sol #
xazzam
Reflection from the bottom to achieve goals
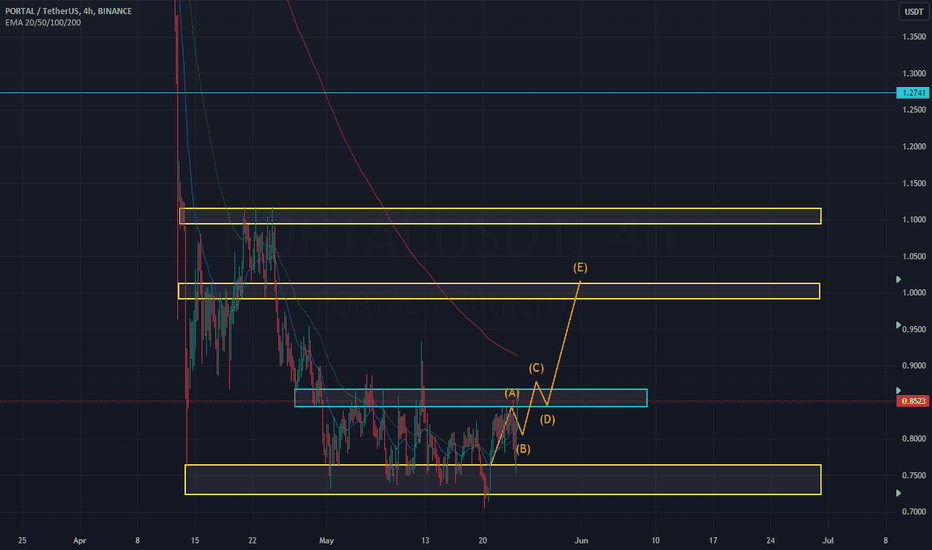
The cryptocurrency Portal has shown a significant reversal from its bottom at $0.7045. Following this reversal, it surged to reach the resistance level at $0.8661. Upon breaking through this resistance, the price continued to climb towards several key targets.The identified targets for this upward movement include:First target: $1.00Second target: $1.27Third target: $2.10This analysis indicates a strong bullish trend for Portal, with expectations of further increases in price if the positive momentum continues and the identified targets are successfully breached.
xazzam
90k soon with the huge event (Bitcoin split) Halving soon
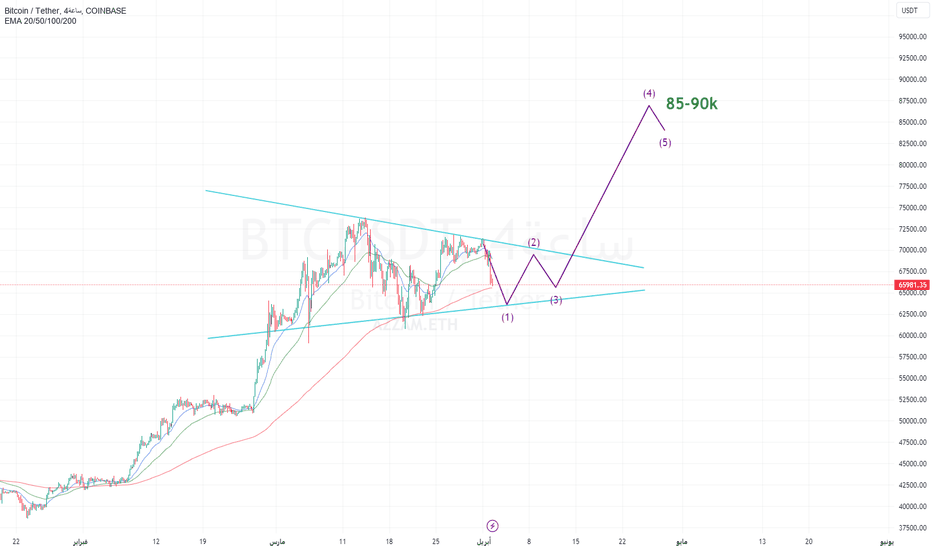
Isolated from market volatility and price fluctuations, Bitcoin's bounce analysis from $63 or $62,000 reflects a technical pattern resembling a bull pennant. This pattern usually appears after a period of rising price, where a flag-like triangular formation is formed with a contraction in trading between support and resistance levels. In this case, the price of Bitcoin rises to form a higher high and then a pennant pattern is formed. Following this pattern, we can expect Bitcoin to continue rising towards the set targets that include $73,000, $80,000, $85,000, and $90,000. These targets are considered positive trading signals, as investors expect the cryptocurrency's upward momentum to continue. One of the factors that could support this rise is the Fork event that occurred in Bitcoin in April. This event is usually a positive market catalyst, as investors tend to buy in expectations of additional gains. Regardless of market fluctuations and price volatility, the analysis of Bitcoin rebounding from the $63k or $62k level reflects a technical pattern resembling the well-known “Bull Pennant.” This pattern typically occurs after a period of price increase, where a triangular formation resembling a flag with contraction in trading between support and resistance levels is formed. In this case, the price of Bitcoin rises to form a higher peak, followed by the formation of the flag pattern. According to this pattern, we can expect Bitcoin to continue its upward trend towards the specified targets, including $73,000, $80,000, $85,000, and $90,000. These targets are seen as positive trading signals, indicating investors' anticipation of continued upward momentum for the digital currency. Among the factors that could support this increase is the Bitcoin fork event that occurred in April. This event typically serves as a positive market catalyst, as investors tend to buy in anticipation of additional gains. halving - bitcoin - crypto - bitcoin split - halving - bitcoin - bitcoin
xazzam
بيتكوين - هبوط قاسي !! قبل الإنطلاق الضخم ( حدث انقسام البيتكوين
HALVING BITCOIN 1. Bitcoin 2. Digital currency 3. Encryption 4. Blockchain 5. Bitcoin mining 6. Miner 7. Bitcoin wallet 8. Blockchain technology 9. Bitcoin transfer 10. Bitcoin trading 11. Halfling 12. Bitcoin fork 13. Bitcoin inflation 14. Reward for prospectors 15. Cryptocurrency 16. Blockchain technology 17. Cryptocurrency conversion 18. Cryptocurrency mining 19. Technical analysis of Bitcoin 20. Bitcoin investment 21. Cryptocurrency trading 22. Cryptocurrency wallet 23. Issuing digital currencies 24. Cancel Bitcoin 25. Bitcoin development 26. Digital market 27. Bitcoin rise 28. Cryptocurrency trading 29. Using Bitcoin 30. Cryptocurrency technology 31. Bitcoin technology 32. Bitcoin replenishment 33. Create digital currencies 34. Cryptocurrency wallet 35. Bitcoin mining 36. Reduce Bitcoin 37. Bitcoin network 38. Transfer money with Bitcoin 39. Market analysis of Bitcoin 40. Return Bitcoin 41. Bitcoin distribution 42. Bitcoin Secure 43. Bitcoin applications 44. Use of Bitcoin technology 45. Buying with Bitcoin 46. Bitcoin as a financial wave 47. Bitcoin rumours 48. The impact of news on Bitcoin 49. History of Bitcoin 50. List Bitcoin on an exchange 51. Bitcoin tokens 52. Bitcoin protocol 53. Security in Bitcoin 54. Create a Bitcoin account 55. Receive payments in Bitcoin 56. Bitcoin audit 57. Issuance of new Bitcoins 58. Block chain technology 59. Alternative digital currencies 60. Bitcoin technical analysis 61. Tips for investing in Bitcoin 62. Bitcoin’s future prospects 63. Bitcoin and international finance 64. Bitcoin ads 65. Avoid Bitcoin fraud 66. Verify Bitcoin transactions 67. Bitcoin trading strategies 68. Bitcoin protection 69. Definition of Bitcoin 70. Bitcoin Review 71. Bitcoin tokens 72. Bitcoin projects 73. Bitcoin development 74. Bitcoin and international transfers 75. Invest in Bitcoin safely 76. Bitcoin and financial technology 77. Bitcoin fundamental analysis 78. Bitcoin Valuation 79. The financial future of Bitcoin 80. Bitcoin production 81. Decentralized transactions in Bitcoin 82. Using Bitcoin for international trade 83. Inflationary pressures on Bitcoin 84. For Bitcoin 85. Introducing Bitcoin 86. Applications of Bitcoin technology in industry 87. Liquidity in Bitcoin 88. Major Bitcoin news and events 89. Tat
xazzam
Bond نموذج صاعد - Bullish pattern
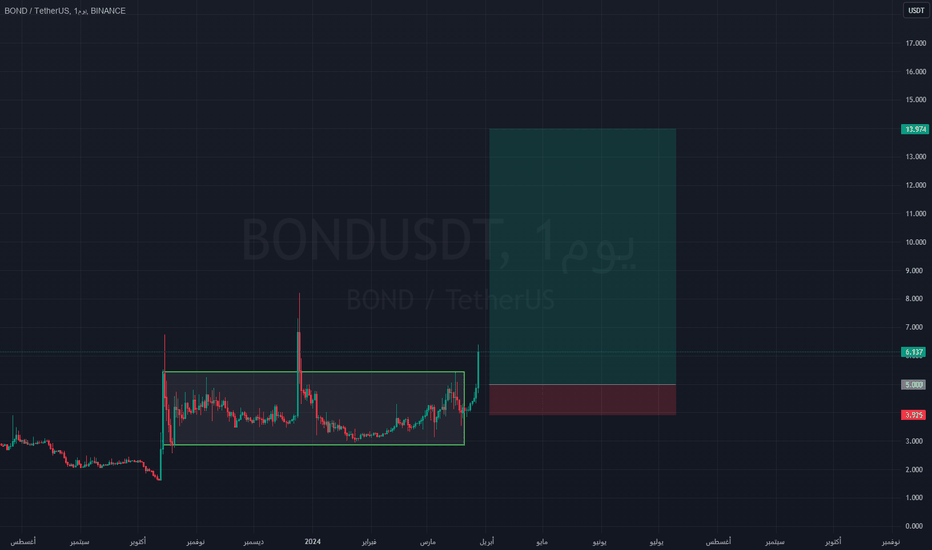
Consolidation Zone Breakout: Here, the coin crosses the upper price level of the consolidation zone, indicating a change in demand and supply. This breakout could be a result of positive news or an incentive for investors to buy. Reaching the price target: After breaching the consolidation area, the coin begins to rise significantly towards the specified price target, which is $12 in this case. Reaching the price target could be a result of positive expectations or positive developments in the industry associated with the currency, and there could be a rise in demand pushing prices higher. Technical and Fundamental Factors: Technical and fundamental factors that may influence price movement should also be taken into account, such as technical indicators and general market outlook, as well as industry and company news related to the currency. Risk Management: Risk management should always be considered in trading, and this can be achieved through the use of stop loss and other risk management techniques. This analysis shows the process that may occur when a currency exceeds a consolidation zone and reaches a specific price target, and how important it is to understand the trends and factors that influence currency prices in the market. bond/usdt bondusdt bond
xazzam
تحليل عملة Sui على فريم اليومي / تشكيل نموذج كوب وعروة ,
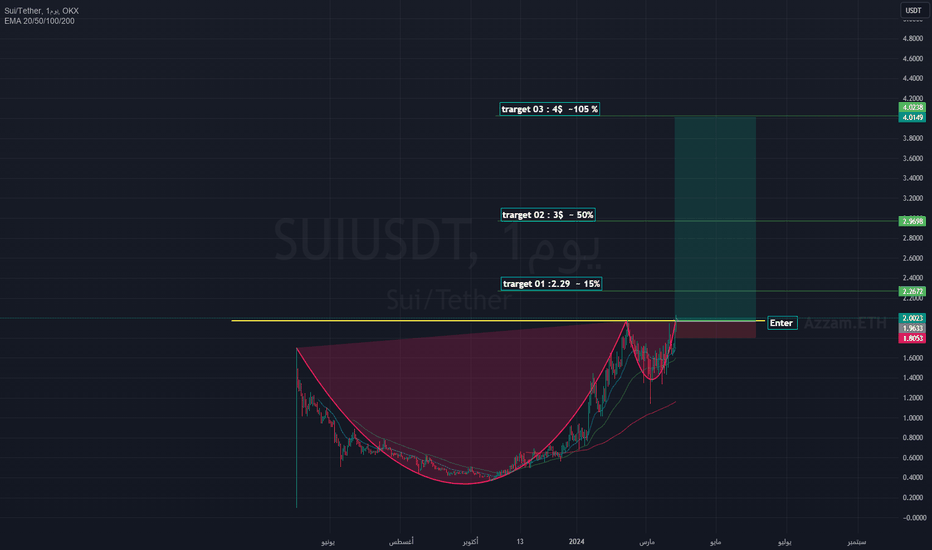
Stages of cup formation: It consists of two sides or peaks 1- The left side: It represents the beginning of the pattern and is formed due to the rise in the price of the asset with the aim of discharging after an accumulation phase on the asset, then it begins to decline as a correction of approximately 50% of the first rise. 2- The right end: The origin rises to form the right end of the cup and is equal to the left end or slightly higher than it. After the right end is formed, the cup is complete. It helps traders find long opportunities in the market as it forms during an ongoing uptrend. This pattern appears when selling pressures exceed buying pressures, resulting in a temporary, weak downtrend followed by a stronger uptrend. If the cup and handle pattern is confirmed, it is usually followed by a bullish price move higher. You can choose a target price based on the cup size, but it becomes less clear what will happen after the initial breakout of the cup and handle pattern. To get a better idea of what will happen after the cup and handle, zoom out and look at a larger time frame. Is there a long-term up or down trend? Has volatility increased or decreased? Answering these questions can help you if you plan to hold positions after the initial breakout.
xazzam
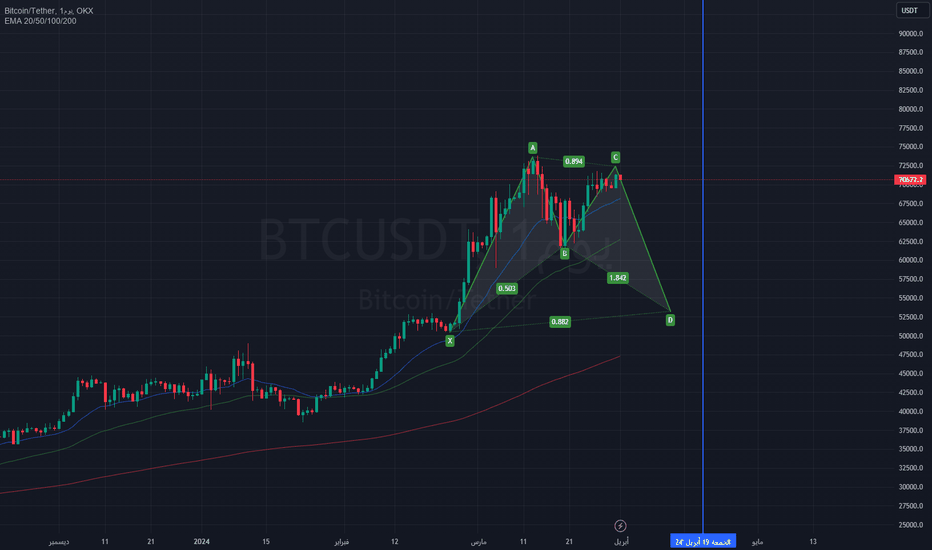
البيتكوين متوقع التصحيح الى 56000$ 🔥 - قبل الإنطلاق الكبير 🔥
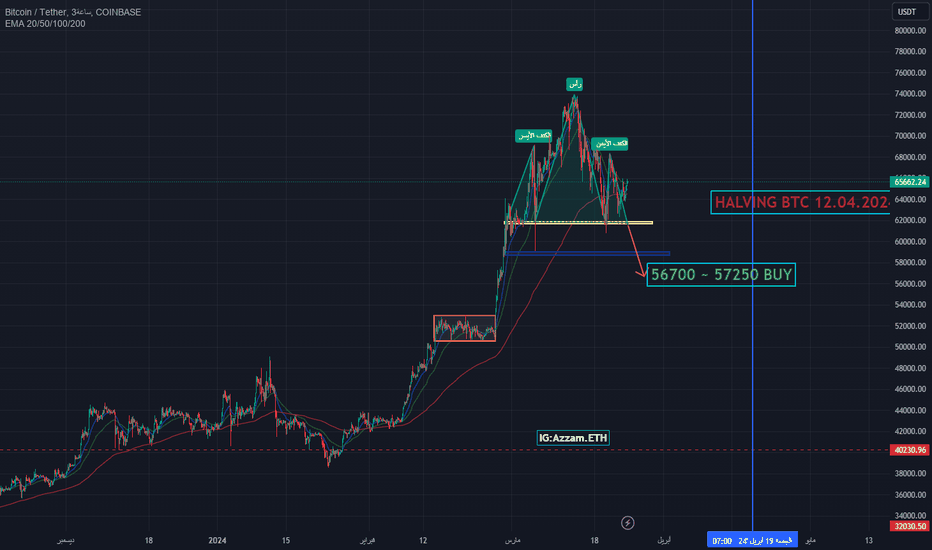
Analysis of the Bitcoin chart shows the presence of a head and shoulders pattern, which is a technical pattern that indicates a possible change in the price direction. The pattern consists of two peaks (the shoulders) agreeing with a middle peak (the head) between them. When the price falls from the head, this is a signal that the rally has ended and a correction or reversal in the trend has begun. Technically, $56,000 is an important support level to watch, as this level could be a strong reversal point. If the price breaks this level down, it may target lower levels like $54,000 and then $52,000 as additional support levels. In general, investors should carefully monitor price developments and pay attention to breaking the mentioned support or resistance levels, as this may lead to a strong market movement. Given the general market situation, the expected correction could be an opportunity to buy in case of stability at the specified support levels, in preparation for the expected big launch later.
Disclaimer
Any content and materials included in Sahmeto's website and official communication channels are a compilation of personal opinions and analyses and are not binding. They do not constitute any recommendation for buying, selling, entering or exiting the stock market and cryptocurrency market. Also, all news and analyses included in the website and channels are merely republished information from official and unofficial domestic and foreign sources, and it is obvious that users of the said content are responsible for following up and ensuring the authenticity and accuracy of the materials. Therefore, while disclaiming responsibility, it is declared that the responsibility for any decision-making, action, and potential profit and loss in the capital market and cryptocurrency market lies with the trader.