Technical analysis by xazzam about Symbol BTC: Sell recommendation (3/24/2024)

xazzam
البيتكوين متوقع التصحيح الى 56000$ 🔥 - قبل الإنطلاق الكبير 🔥
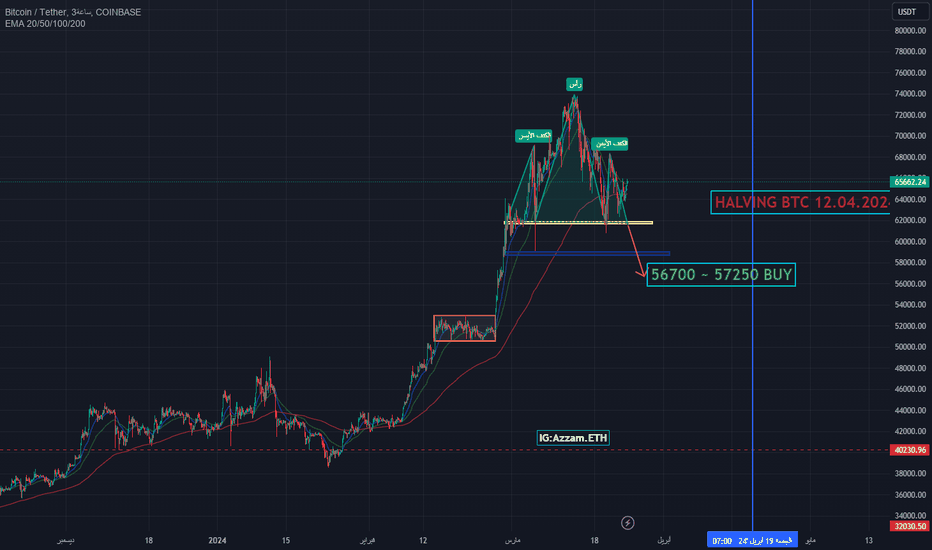
Analysis of the Bitcoin chart shows the presence of a head and shoulders pattern, which is a technical pattern that indicates a possible change in the price direction. The pattern consists of two peaks (the shoulders) agreeing with a middle peak (the head) between them. When the price falls from the head, this is a signal that the rally has ended and a correction or reversal in the trend has begun. Technically, $56,000 is an important support level to watch, as this level could be a strong reversal point. If the price breaks this level down, it may target lower levels like $54,000 and then $52,000 as additional support levels. In general, investors should carefully monitor price developments and pay attention to breaking the mentioned support or resistance levels, as this may lead to a strong market movement. Given the general market situation, the expected correction could be an opportunity to buy in case of stability at the specified support levels, in preparation for the expected big launch later.