
wagmitraders
@t_wagmitraders

What symbols does the trader recommend buying?
Purchase History
پیام های تریدر
Filter
wagmitraders
Long-Term Spot Technical Analysis of INJ Coin

When evaluating INJ coin for long-term spot investments, it is evident that the price continues its downward movement after being rejected from the daily resistance level at $16.33. If INJ fails to receive a strong buying reaction from the $13.16 support in the coming days, the downtrend is likely to persist. Our preferred long-term spot entry zone lies between the $11.86 – $11.26 support range. If INJ retraces to the blue support zone marked on the chart, we intend to accumulate with a long-term target of $23. As long as INJ continues to close daily candles above the $10 level, we will maintain our long-term spot positions. Should the price rebound from the $11.86 – $11.26 zone, our initial upside target will be $16.33. Not Financial Advice (NFA).#INJ Daily Update We were expecting a downward movement in INJ to the support level we mentioned and our spot purchase range of $11.68 - $11.26. However, the price rose to $11.86 without reaching our spot purchase order. As long as there is no daily candle close above the 13.16$ level in INJ, we will continue to anticipate a downward movement toward the specified blue support lines. If INJ coin achieves daily candle closes above the 13.16$ region, the next target will be 14.6$. NFA.INJ Daily Update / +12% INJ coin has surged by 12% without reaching our designated spot entry zone. As a result, we did not enter a spot position. However, we have observed that some followers entered spot trades near the mentioned level. Those who did may consider taking profit on 25% of their position at this point. Traders can use their entry price as a stop-loss reference for the remaining position. If INJ revisits the blue-marked entry zone, we do not plan to open another spot position. However, if INJ manages to close daily candles above the $13.16 level, the price action outlined in our previous analysis could still play out. For those seeking safer trades, placing stop-losses around the entry zones and closely monitoring the price action may provide a more risk-managed approach. As for us, if INJ drops back into the blue zone again, we do not plan to re-enter, as a revisit to that level may signal a deeper decline toward lower support areas.#INJ Update / +36% INJ coin has reached the $16.33 resistance level that we have consistently highlighted in previous analyses, before retracing back to the $14 range due to selling pressure. Those who followed our resistance target at $16.33 saw gains of +36%. Currently, INJ is holding at around +20% profit levels. Investors holding INJ should closely monitor the $13.16 level. As long as INJ continues to close daily candles above $13.16, the next upside target will be $18. Not Financial Advice.
wagmitraders
Long-Term Technical Analysis of AVAX Coin

When evaluating AVAX for long-term investments, the blue support zone highlighted on the chart stands out as the key area to monitor for potential spot entries. If AVAX closes daily candles below the $22.77 level, it is expected to continue its downward trend. The primary spot buy zone for AVAX is identified between the $21.20 – $20.25 support range. If the price retraces into the blue zone on the chart, we plan to initiate spot positions. Should AVAX show a reversal from this area, our next upside targets are $27.63 and $32, respectively. If AVAX fails to generate a strong reaction from the blue zone and continues to decline, we will then monitor the $18 support level. As long as AVAX holds above $18, our bullish outlook from this analysis remains valid. Not Financial Advice (NFA).#AVAX Daily Update AVAX fell to the support zone of $21.20 and $20.25, as we mentioned in our previous analysis. We made our first spot investment at the $21.20 level. Additionally, we moved our buy order at the second spot buy level of $20.25 to the $19.20 level. As a result, our next spot buy order is now at the $19.20 level. If AVAX performs a wick movement to the $19.20 level, we will include it in our spot portfolio through partial purchases. Our first upward expectation for AVAX is for it to reclaim the $22.77 support zone. NFA.
wagmitraders
Long-Term Technical Analysis of ENA Coin
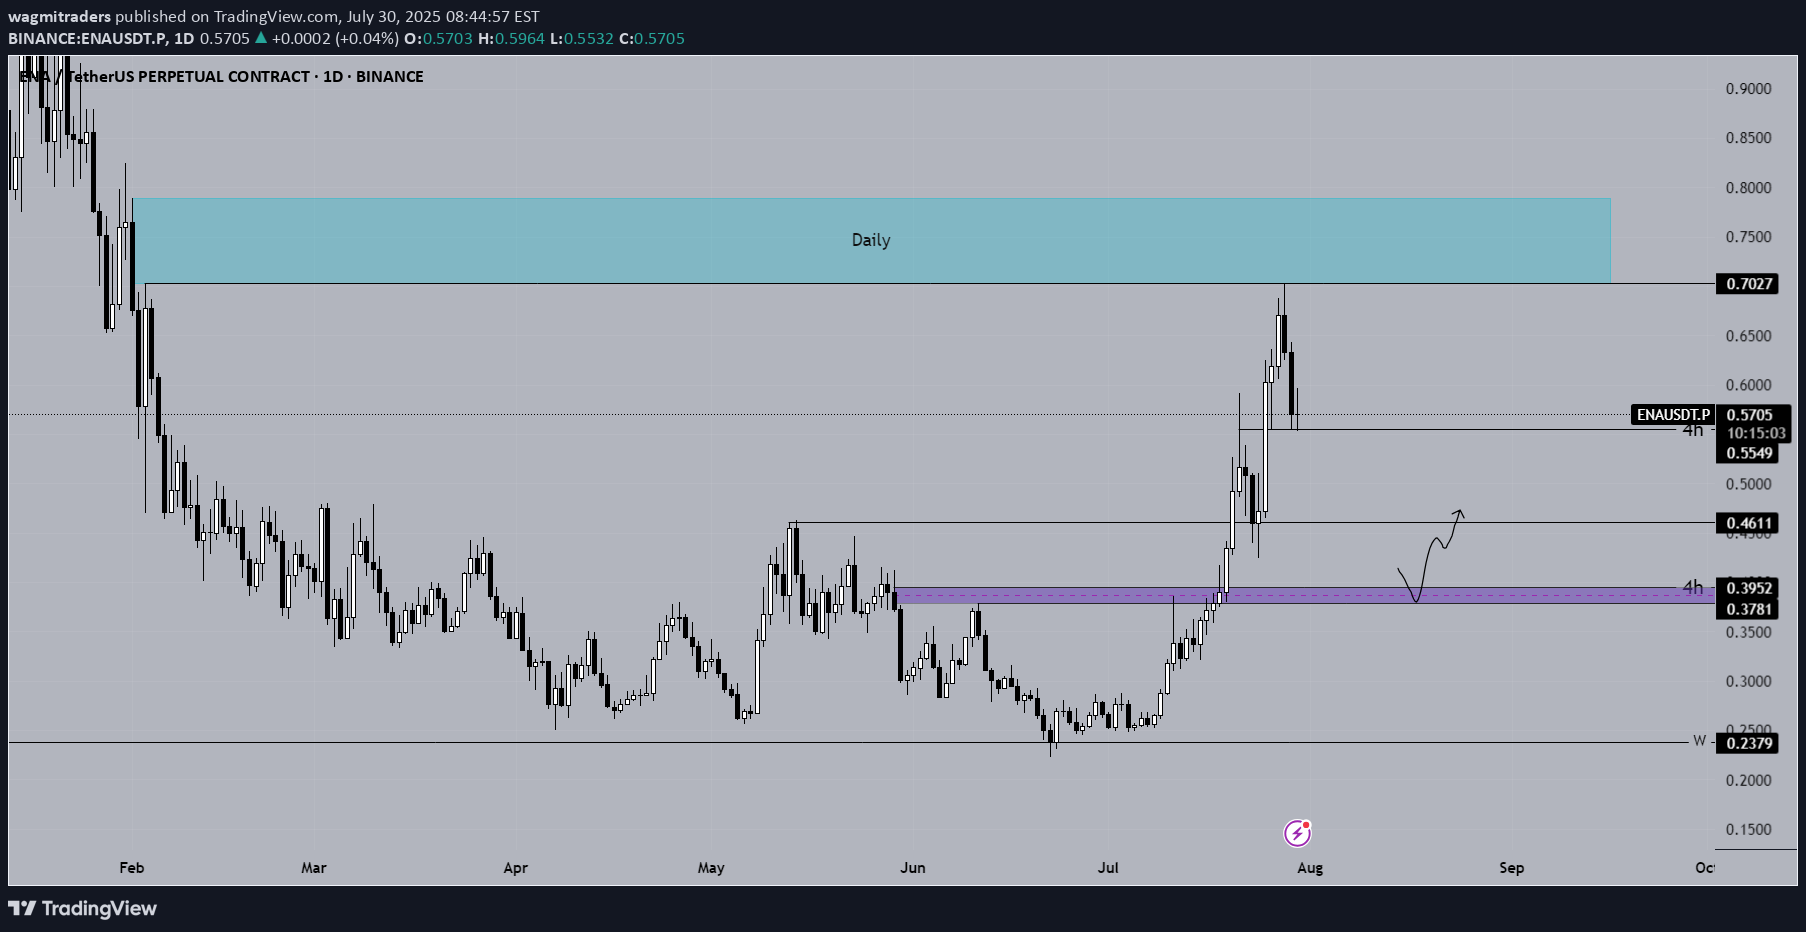
ENA coin continues its downward movement after being rejected from the $0.70 resistance level. As long as ENA holds above the 4H support level at $0.5549 with confirmed 4-hour candle closes, it is likely to attempt a rebound toward the weekly resistance zone (marked in blue). However, if ENA loses the $0.5549 support level and closes multiple 4H candles below it, further downside momentum is expected. In such a scenario, the initial downside target would be $0.4611. For long-term spot investments in ENA, the price range between $0.3952 and $0.3781 should be closely monitored by investors. Our plan is to accumulate ENA coin within the $0.3952 – $0.3781 support range for long-term spot positions. If the price reaches this zone, our target will be set at $1. Not Financial Advice (NFA).
wagmitraders
Current Bitcoin Analysis! What Can Investors Expect in the Comin
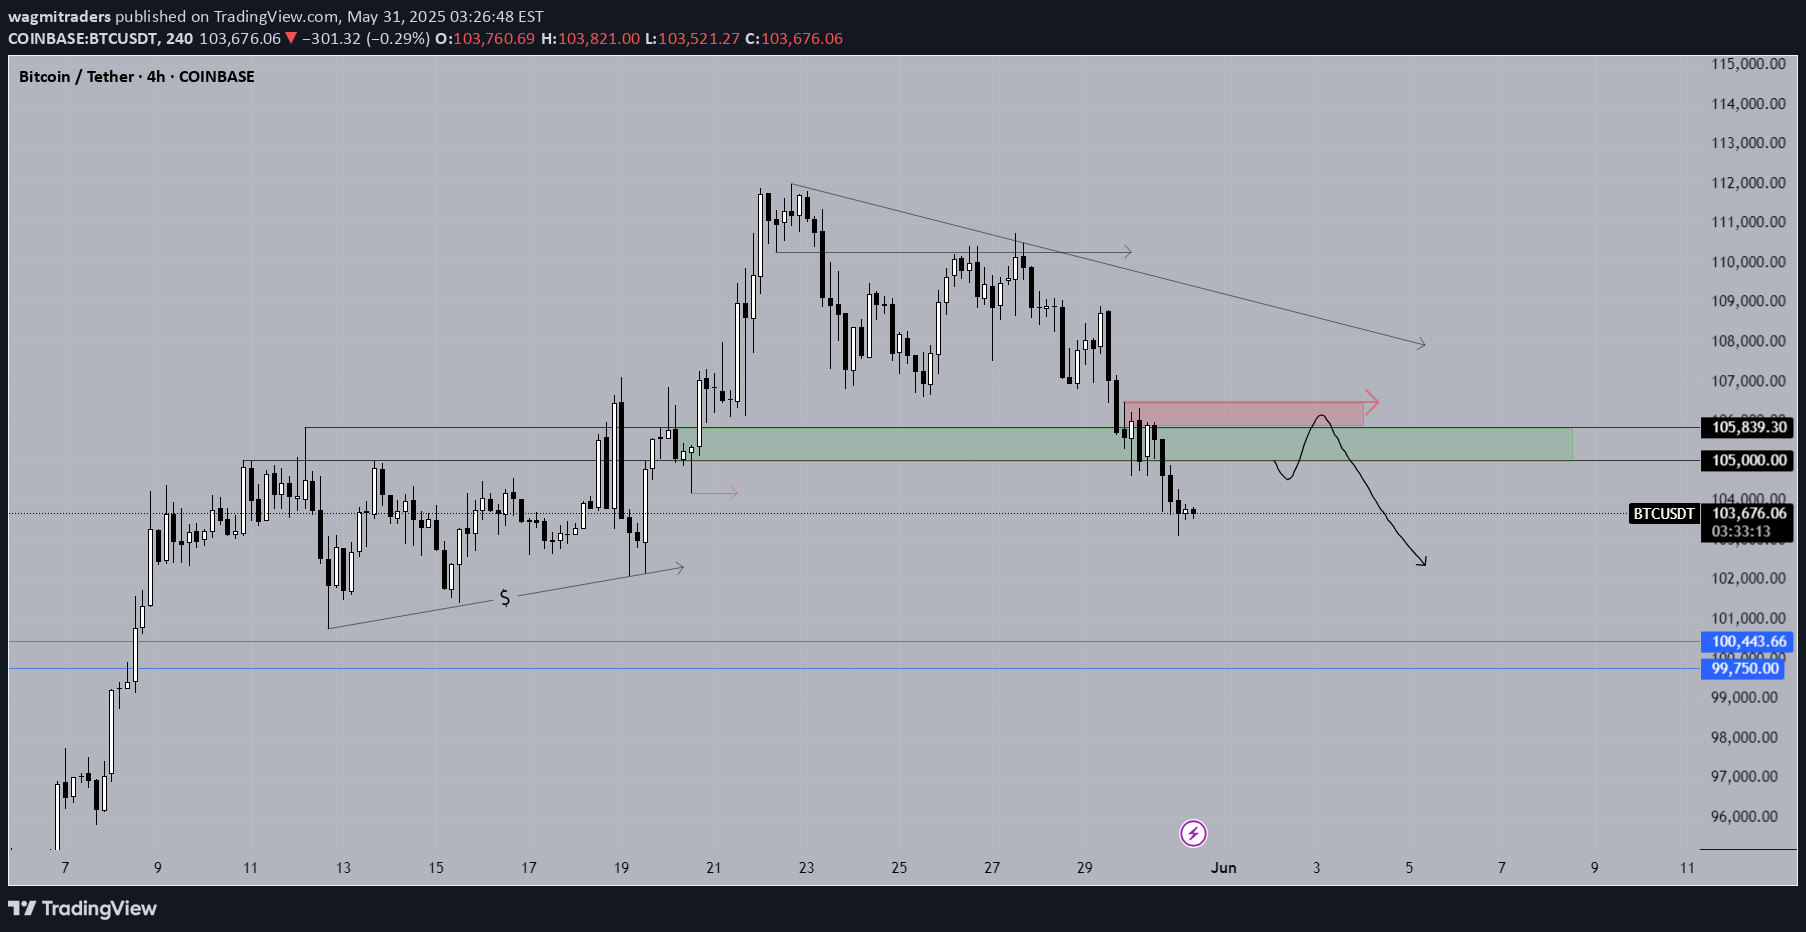
Bitcoin is trying to find support at 103K levels. We are likely to see a move until our previous support is now in the green. As long as 103K is maintained, 105.8. - It will want to rise up to the 105K range. If a short confirmation structure is formed when it reaches the specified green area, the short idea can be evaluated up to 100K levels. When it comes to the green area in the analysis, it should be monitored closely. If the price moves to the red zone, short confirmation structures can be evaluated. If Bitcoin resumes its downward movement from the red zone, the bearish target will be the blue lines in the analysis. Not Investment Advice.Bitcoin has reached our red zone. Short confirmation structures can be examined if the price enters the red zone in a few hours. Bitcoin has high short liquidity at 106K levels. Also, the 106K dollar levels were previously followed as a support line. This area will now be followed as resistance. If BTC fails to cross the red zone in the analysis, it will start a decline towards the blue lines. Not Investment Advice.Bitcoin made a bearish move to the blue line target as we mentioned in the analysis. Congratulations to those who evaluated the analysis. WAGMI
wagmitraders
Daily Chainlik Analysis - #LINK March 07

#Chainlik #LINK LINK managed to stay above the weekly support zone during the recent decline. If LINK coin declines to the 4-hour key level zone specified in the analysis, investments can be evaluated with a daily candle closing stop below the $ 14.22 level. As long as LINK coin stays above the $ 15.65 level, the bullish target will be $ 18.21 - $ 19.94 respectively. LINK investors can follow important support and resistance levels in the analysis. LINK coin needs to close daily candles above the $ 18.21 level in order to continue the rise. NFA
wagmitraders
Daily BLZ Coin Analysis - March 07

#BLZ #Bluezelle BLZ coin has risen more than 90% in the last 24 hours. BLZ coin has been in a downtrend for a long time. When we examine its technical chart, it is seen that it quickly crossed the resistance range of $ 0.05615 - $ 0.05276. If BLZ coin falls to the support range of $ 0.05615 - $ 0.05276, it can be considered as a spot. However, since it is a very volatile coin, we think that a high amount of purchases should not be made. If BLZ coin starts its rise again from the support range of $ 0.05615 - $ 0.05276, its next target is the blue zone in the analysis. NFA.#BLZ Coin fell to $0.05615 - $0.05276, the support zone we expected after the analysis we shared. BLZ coin continued to rise from the support zone mentioned in the analysis and we continue our investment with a 15% profit rate. If BLZ coin reaches $0.08425, we will sell 50% of our investment. We will wait for our next target of $0.111.#BLZ We stopped our BLZ spot investment as it closed candles below the daily support zone we mentioned in the analysis. BLZ may deepen its downward movement. For this reason, we will not invest until it turns its trend up again, we will only watch. NFA
wagmitraders
Bitcoin Daily Analysis - 27 February

#Bitcoin We are monitoring the $81,850 - $80,370 range as the key support zone where we might see a clear reversal signal in BTC. A reaction from this support zone towards the purple region ($86,000) is expected. If BTC manages to close daily candles above the purple region, the next target will be $90,500. However, if the purple region is not broken, the downtrend will continue without forming new highs. If the $80K level fails to provide support for Bitcoin, we could see a drop towards $73,800. Therefore, the $81,850 - $80,370 support range should be closely monitored. Not Financial Advice.#Bitcoin Update 15% ✅ Bitcoin has experienced a serious rise with the US reserve news coming today. It has risen 15% from the support zone we mentioned in the previous analysis. With the hard crossing of the purple zone in BTC, we quickly crossed the next resistance zone at $ 90,500. The current support zone range to follow in BTC is $91,500 - $90,500. The price should hold the specified range as support in its possible correction to the blue zone range in the analysis. If it resumes its upward movement from the blue zone, its new target will be $99,600. NFA.#Bitcoin Update After the previous analysis, Bitcoin fell again to the $81,850 level. With the purchase from the $81,850 zone, the daily candle close was above the purple zone. Currently, BTC purple zone support is pricing above the $86,000 level. As long as BTC closes daily candles above 86K, its target will be $99,600. NFA.
wagmitraders

#ETH HaftalıkEthereum'da haftalık trend yapısında 2822$ - 2780$ aralığının önemli trend desteği olduğu görülüyor. ETH'de orta vadeli alımlar için belirtilen bölge aralığı spot olarak değerlendirilebilir.ETH belirtilen haftalık destek bölgesinden yönünü tekrar yükselişe çevirmeli. Aksi halde düşüş 2535$ seviyelerine kadar devam edecektir. ETH'de 2822$ - 2780$ aralığından spot alım gerçekleştireceğiz. Yükseliş hedefimiz grafikteki mavi bölge.YTD.Ethereum'u analizde belirttiğimiz haftalık destek bölgesinden aldık. NFA.
wagmitraders
Will Litecoin Start The Rise Rally? LTCUSDT

LTC Analysis As long as Litecoin stays above the $77 support outlined in the analysis, it will want to launch its bullish movement. As long as LTC stays above the $73.46 support, it will want to make its bullish move to $92.32 levels. We made an extra addition to our $88 purchases in LTC, at $77. We are carrying a loaded LTC spot, we will hold it as long as it stays over $65.
wagmitraders
Long-Term ARB Coin Analysis! Where Will We Buy?

#ARB We believe that unless ARB coin closes daily candles above the resistance level of $2.165, it will initiate a downward movement. However, for it to experience a decline, it first needs to break below the support of $1.933, followed by daily candle closures below the $1.743 support. For ARB coin, our areas for spot buying are as follows: $1.544 - $1.409 levels (Blue lines). If a downturn occurs to our buying zones, we will invest for the long term. If the price continues its upward trend without reaching our buying zones, we will cancel the analysis. However, our buying orders will be placed at $1.544 - $1.409 levels unless it surpasses the resistances of $2.165 - $2.42. WAGMI NFA#ARB The ARB coin has yet to close strong and bulky candles above the $2.165 level. This continues to strengthen our decline target to the $1,544 - $1,409 levels. Candle closures, especially below the $1,933 level, will make our expectation stronger. We continue to keep our purchase orders. NFA.#ARB We have taken our first order at the level of $1.544. Our second buy order at $1.409 remains active. We already have a 5% profit margin. We have added ARB coin to our portfolio for the long term. We will update when we decide to take profit or stop. We thank our followers who have supported us with their likes and appreciation for evaluating the analysis. NFA. WAGMI.#ARB Update We are back in the area marked by the arrow. ARB, where we made our 1st piece purchase at $1,544, also received our 2nd order at $1,409. When we look at our entry average, it is at $1.4865, indicated in red on the chart. In terms of ARB's general outlook, it should now start its new trend from this region and walk to the $3 journey. However, when we look at the region where it will receive the closest support in case of a possible decline, we can see a strong buying reaction from the $ 1.35 region. We think we have added ARB to our portfolio from beautiful regions for the long term. We hope to see good gains.#ARB Update ARB analysis moved outside our expectations. We made our last addition in ARB at the current level ($1.1190) and our entry average is at $1.347. We made the last purchase for ARB and now we have a 15% loss. It will be in our portfolio in the long term. NFA
Disclaimer
Any content and materials included in Sahmeto's website and official communication channels are a compilation of personal opinions and analyses and are not binding. They do not constitute any recommendation for buying, selling, entering or exiting the stock market and cryptocurrency market. Also, all news and analyses included in the website and channels are merely republished information from official and unofficial domestic and foreign sources, and it is obvious that users of the said content are responsible for following up and ensuring the authenticity and accuracy of the materials. Therefore, while disclaiming responsibility, it is declared that the responsibility for any decision-making, action, and potential profit and loss in the capital market and cryptocurrency market lies with the trader.