
vahidzamani67
@t_vahidzamani67

What symbols does the trader recommend buying?
Purchase History
پیام های تریدر
Filter
vahidzamani67
اتریوم در آستانه انفجار قیمتی؟ راز رشد نجومی آلتکوینها از 2000 دلار فاش شد!
vahidzamani67
بیت کوین در آستانه سقوط به ۷۴ هزار دلار؟ جنگ خاورمیانه ماشه این ریزش است!
Hi guys Bitcoin will change trend from 74. Maybe the trigger for the fall to 74 will be the war in the Middle East.
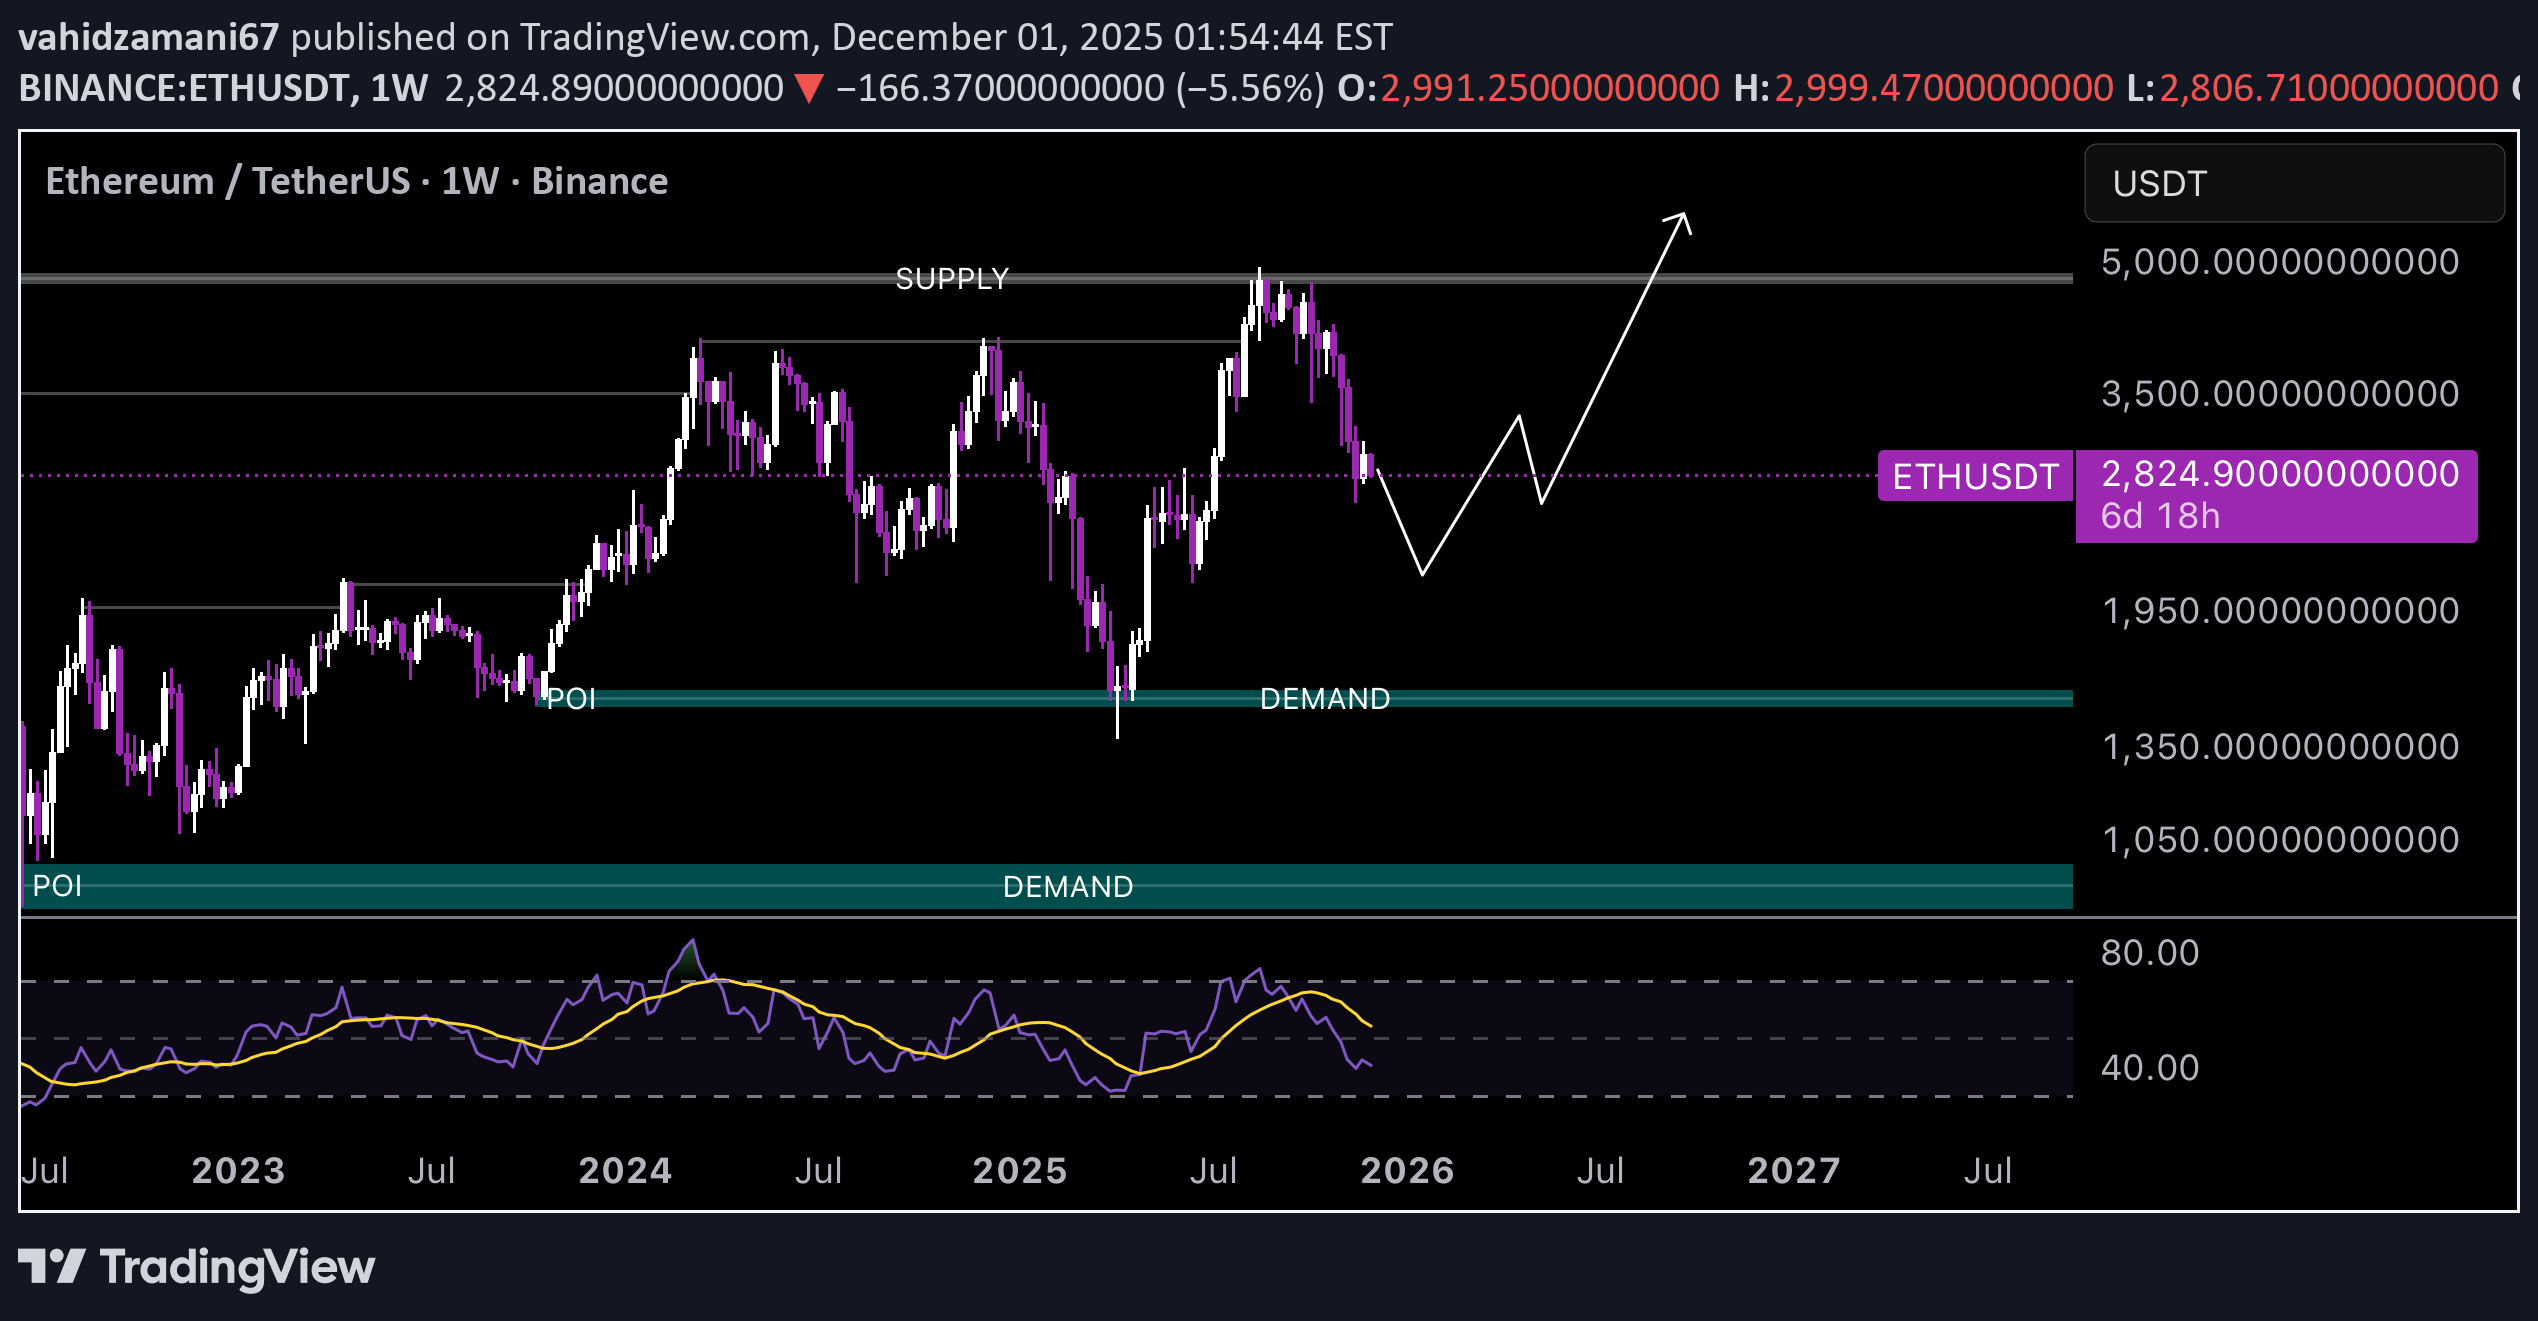
vahidzamani67
Eth
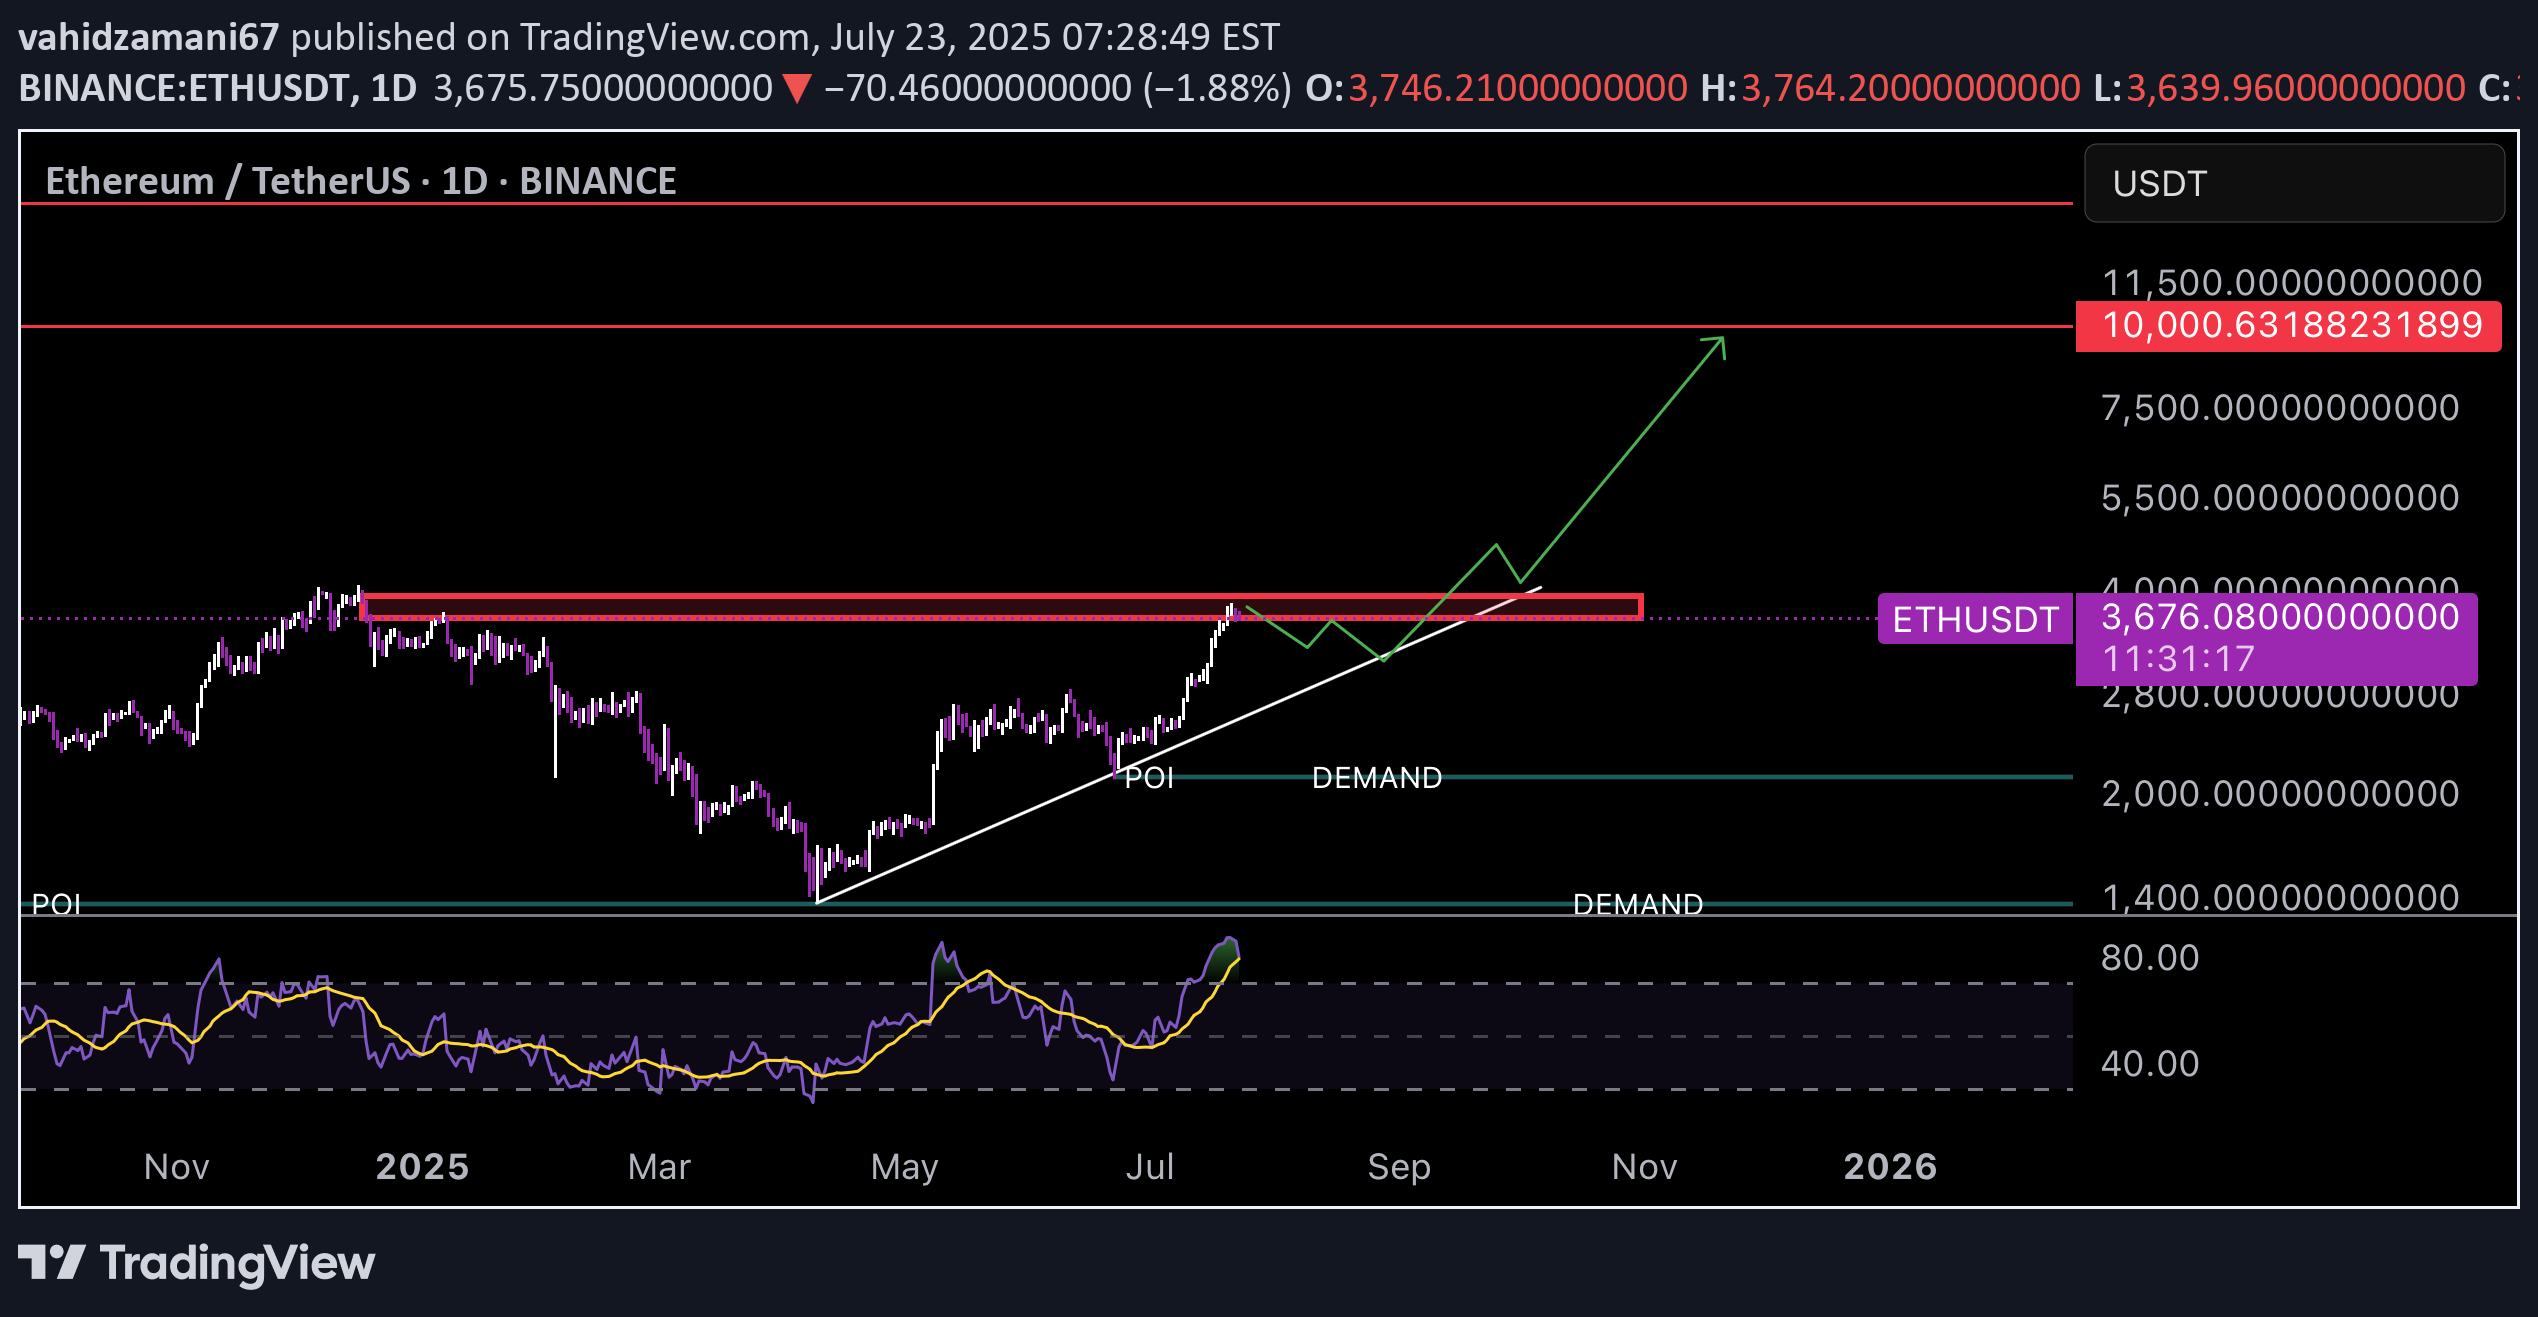
For a technical analysis of the provided ETH/USDT 1D chart, here are the key points: 1. **Current Price and Changes**: The current price is around 3,672.23 USD, down 1.99% (74.54 USD) from the previous day. 2. **Support and Resistance Levels**: - **Resistance**: Near 3,672.24 USD (current SELL level), marked by the red line. - **Supports**: Demand levels around 1,800 and 40 USD indicate potential support zones if the price drops significantly. 3. **Trend and Direction**: An upward trend line from the chart's bottom to the current point suggests an overall bullish trend, though the recent break below the resistance line may indicate weakness. 4. **Indicators**: - The POI (Point of Interest) line near 3,672 USD highlights a key level where price is fluctuating. - The lower indicator (likely RSI or similar) shows price oscillations, currently in a neutral zone with no clear buy or sell signal. 5. **Short-Term Outlook**: If the price fails to stabilize above 3,672 USD, it may move toward lower demand levels (e.g., 1,800 USD). A breakout and stabilization above resistance could target 10,000 USD (based on the upward trend line). For a more detailed analysis, consider adding indicators like MACD or Bollinger Bands. Would you like me to create a visual chart in a separate panel?
vahidzamani67
Doge
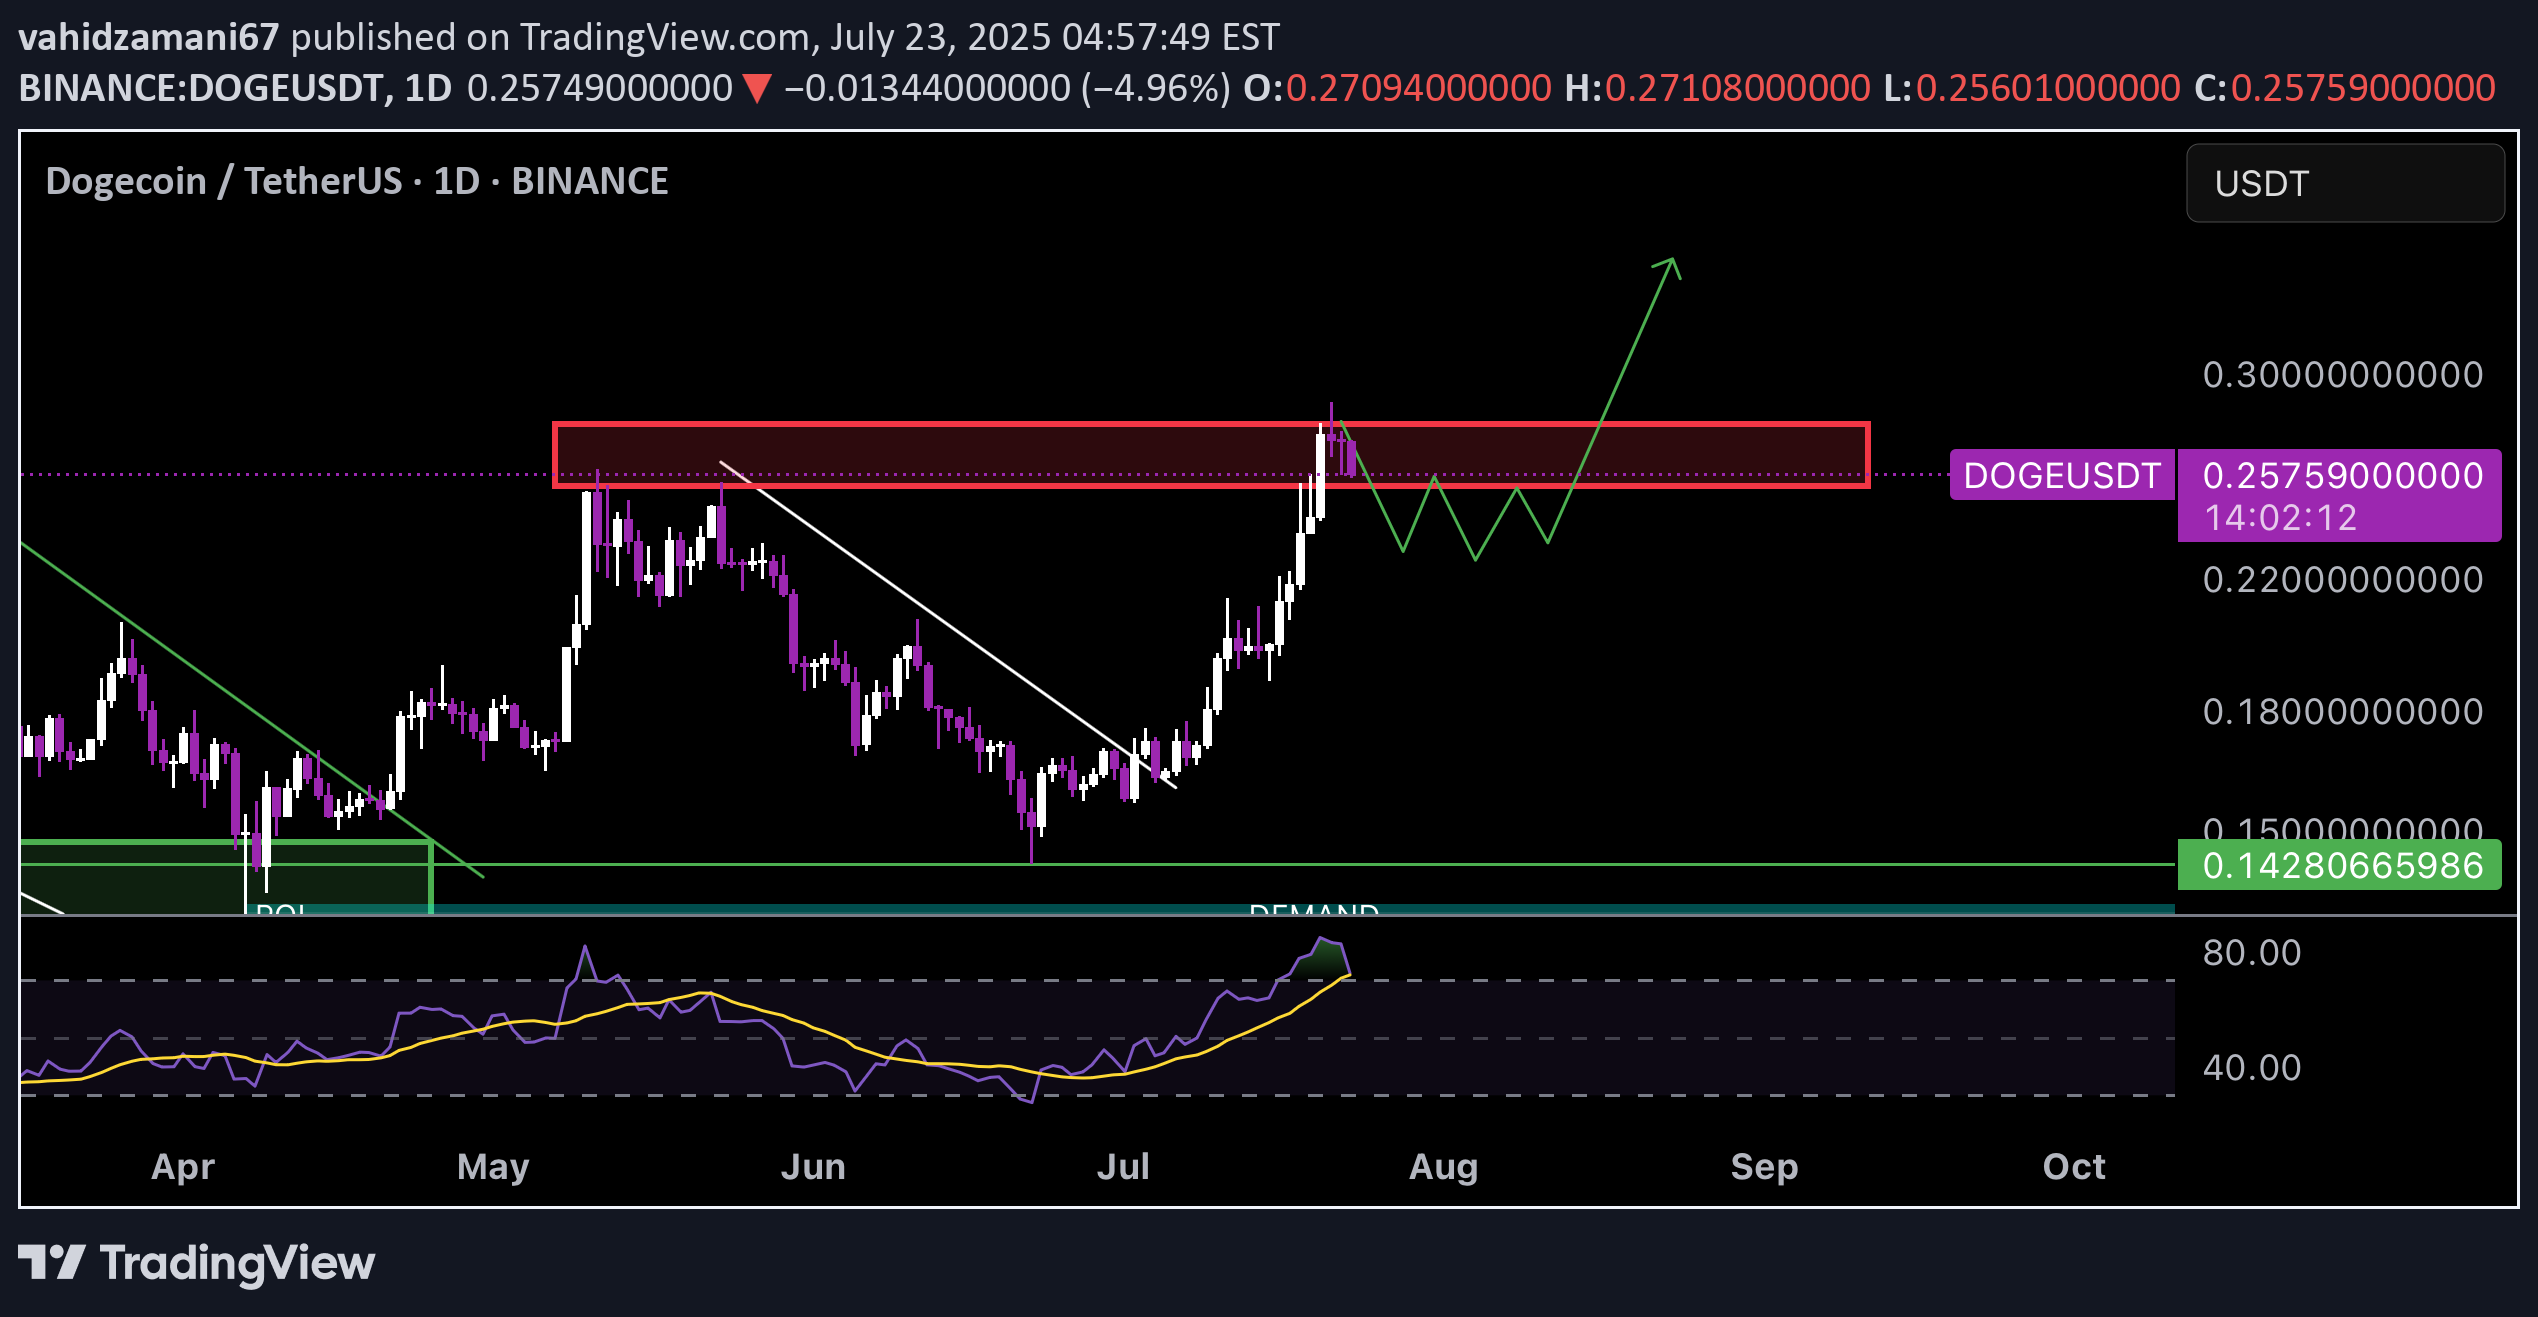
•Current Price Level: The current price is 0.25770 USD, with a decrease of 0.01323 USD (4.88%). •Support and Resistance Levels: ◦Key Resistance: Around 0.25770 USD (red line), which is currently a critical level to test. Breaking this could push toward the 0.30000 USD marked level. ◦Key Support: At 0.14280 USD (green line). If the price drops below this, it might fall to 0.11000 USD. •Trend Line: The white diagonal line indicates a previous downtrend that has recently been broken. This could signal a shift to an uptrend, but it needs confirmation with higher volume. •RSI (Relative Strength Index): At the bottom of the chart, RSI has moved out of the oversold territory (below 30) and is around 40-50. This suggests selling pressure is easing and it may soon enter a neutral or bullish zone (above 50). •Trading Volume: The recent increase in volume as the price approaches resistance indicates buyer interest, but sustained volume is needed to confirm an uptrend. •Patterns: The price movement forming a wavy (W-shaped) pattern near resistance could indicate consolidation. A decisive break above 0.25770 with a confirmation candle could activate the next target. Conclusion: The chart suggests DOGE is at a pivotal price point. Breaking the 0.25770 resistance could confirm an upward move, otherwise a drop to the 0.14280 support is possible. It’s recommended to use a stop loss below the support and monitor trading volume. For real-time data, I can search if you’d like.
vahidzamani67
Pepe
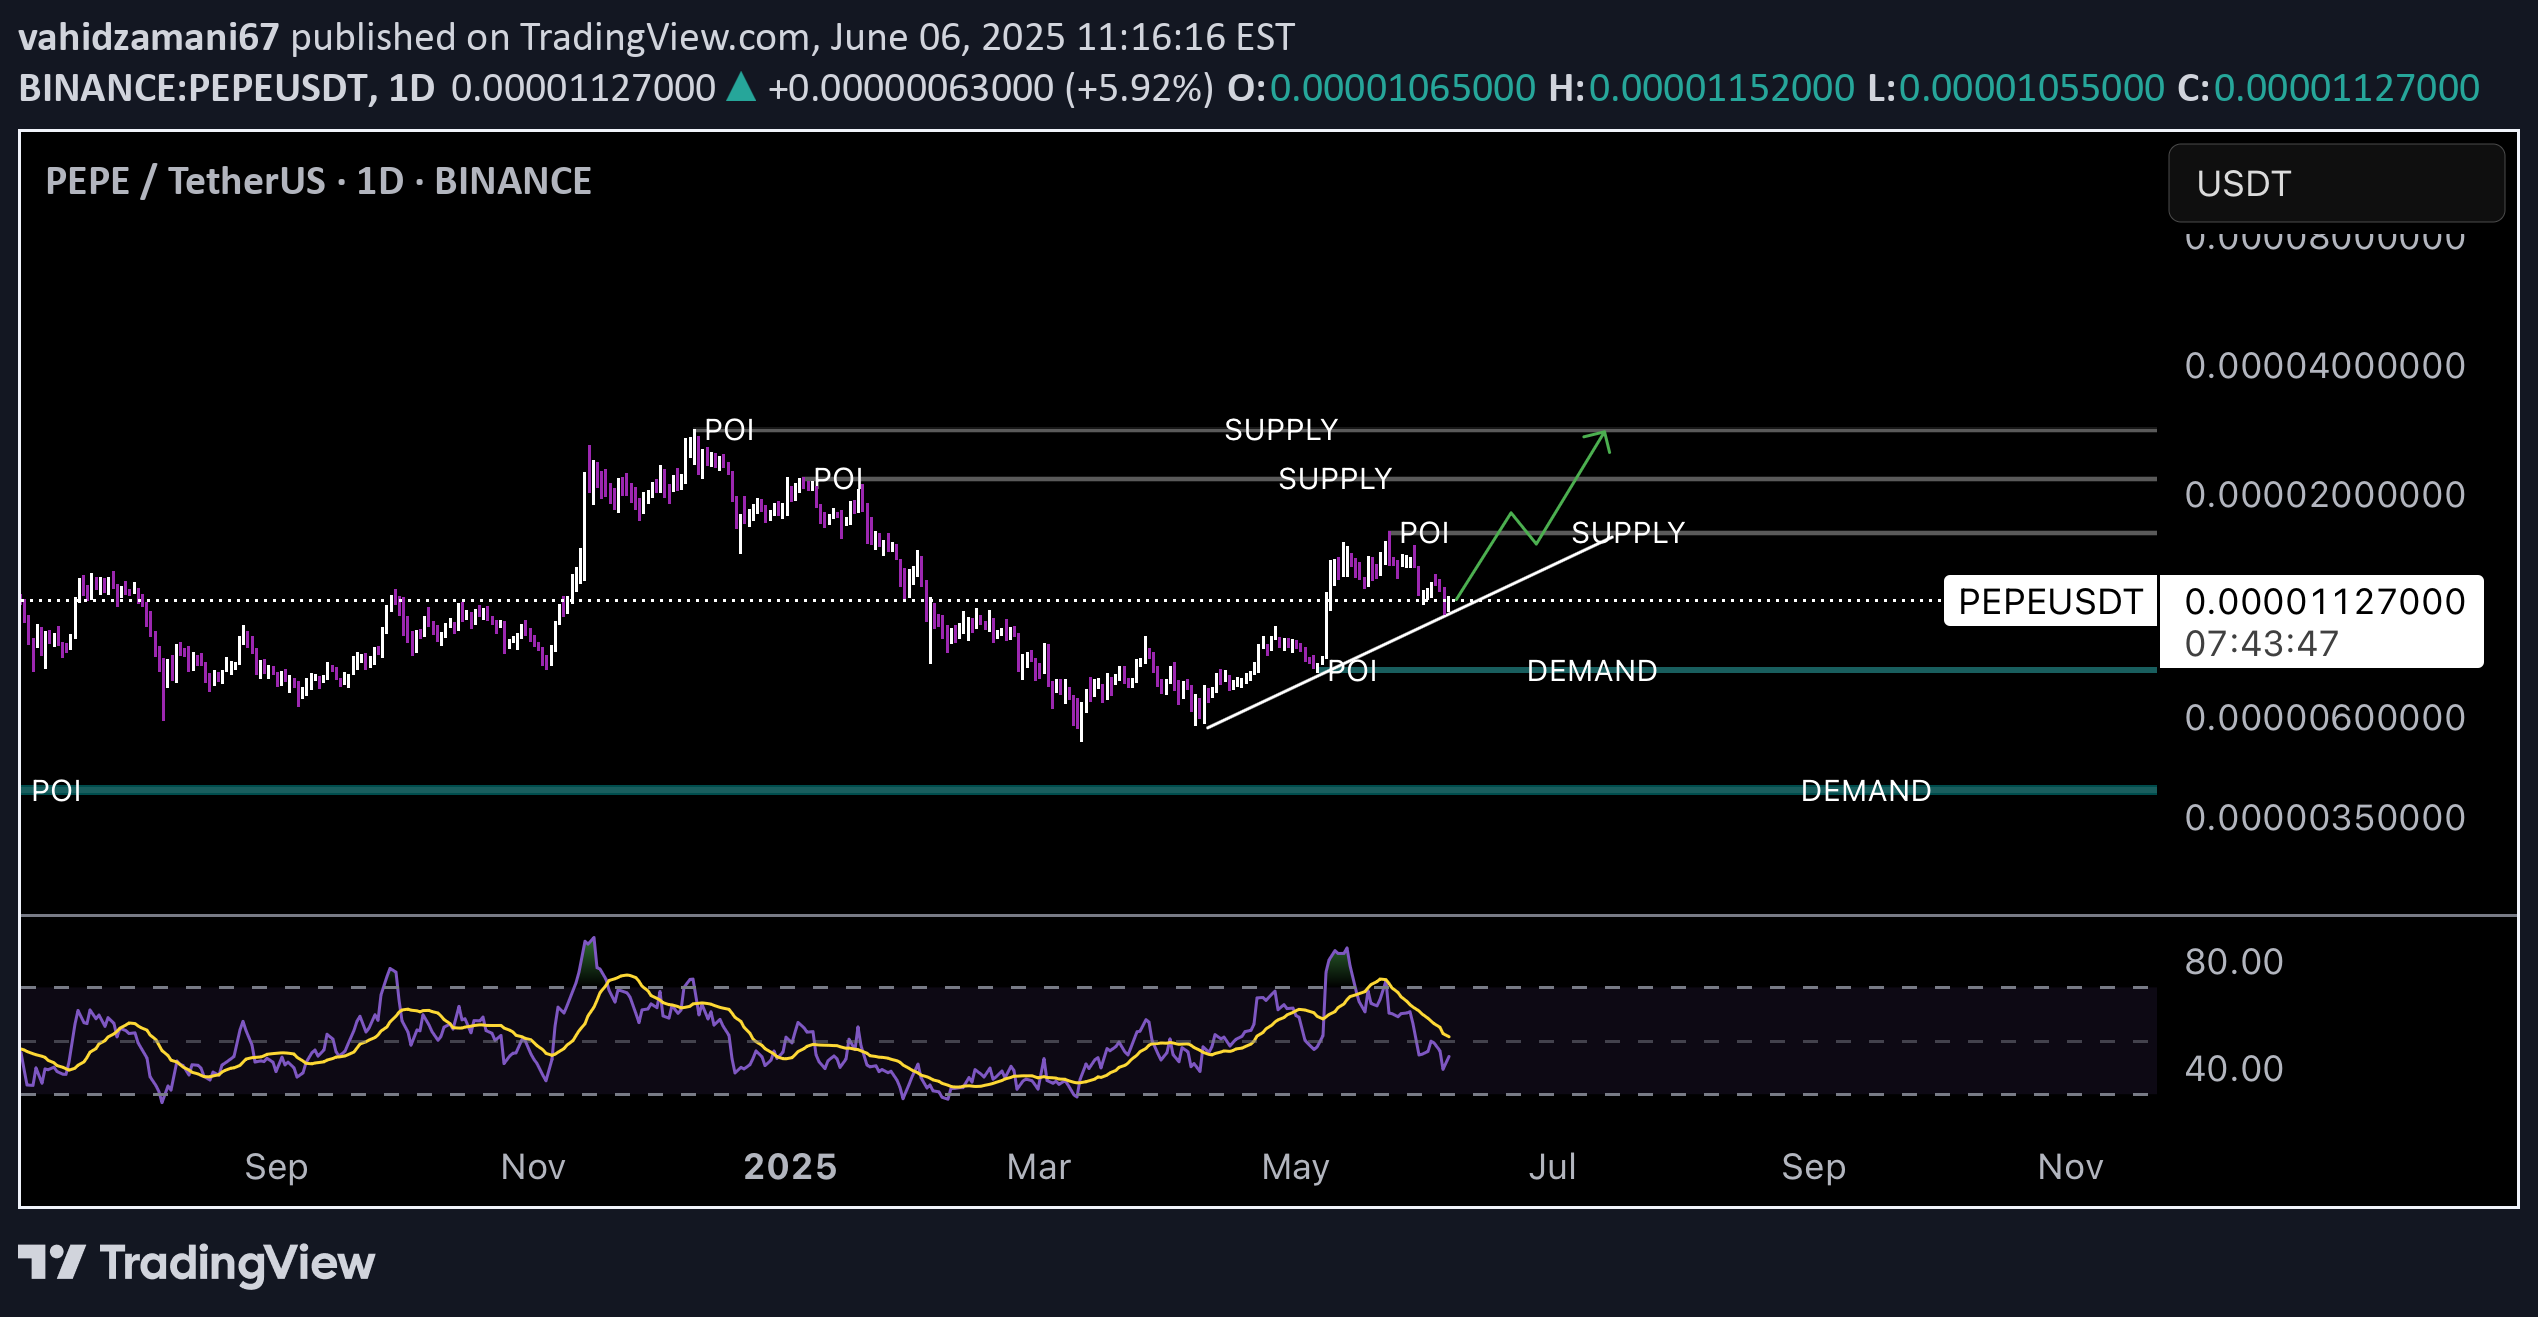
Let’s break down the chart for the PEPE/TetherUS (PEPEUSDT) trading pair on a 1-day timeframe from Binance, as shown in the image. This analysis will cover the price action, key levels, trends, and indicators visible on the chart. 1. Price Action and Trend •The chart shows the price movement of PEPEUSDT over a period from around September 2024 to July 2025. •The current price is 0.0000112600 USDT, with a +5.83% increase, indicating bullish momentum in the recent period. •The price has been oscillating between key levels of support (labeled as “DEMAND”) and resistance (labeled as “SUPPLY”). ◦Demand Zone: Around 0.0000070000 to 0.0000090000. This area acted as a strong support where the price bounced multiple times (e.g., around November 2024 and March 2025). ◦Supply Zone: Around 0.0000112600 to 0.0000150000. The price is currently testing this resistance area, which it previously struggled to break (e.g., around July 2025). •A Point of Interest (POI) is marked around the 0.0000112600 level, suggesting this is a critical area where the price might either break out or reverse. •The chart shows an ascending triangle pattern forming, with higher lows (indicating increasing buying pressure) and a flat resistance at the supply zone. This pattern often signals a potential bullish breakout if the price breaks above the resistance. 2. Volume Analysis •The volume bars at the bottom of the chart show fluctuations in trading activity. •There are noticeable spikes in volume at key price levels, particularly during the bounces from the demand zone (e.g., November 2024 and March 2025) and during attempts to break the supply zone (e.g., July 2025). •The recent price increase (+5.83%) is accompanied by a moderate increase in volume, which supports the validity of the upward move. However, for a confirmed breakout above the supply zone, we’d ideally want to see a more significant volume surge. 3. Indicator Analysis (Lower Chart) •The lower chart appears to show two indicators, likely the Relative Strength Index (RSI) and possibly the MACD or a volume-based indicator. •The RSI (likely the blue line) is currently around the 80 level, which is in the overbought territory (typically above 70). This suggests that the price might be overextended in the short term, and a pullback or consolidation could occur before any further upward movement. •The yellow line (possibly MACD or another oscillator) is also trending upward, indicating bullish momentum. However, if this is MACD, we’d need to check for any potential divergence (e.g., price making higher highs while the indicator makes lower highs), which could signal a reversal. 4. Key Levels to Watch •Resistance (Supply Zone): 0.0000112600 to 0.0000150000. A break above this level with strong volume could confirm a bullish breakout, potentially targeting the next resistance around 0.0000300000 (as seen on the right side of the chart). •Support (Demand Zone): 0.0000070000 to 0.0000090000. If the price fails to break the supply zone and pulls back, this demand zone will be critical to hold for the bullish structure to remain intact. •Current Price (POI): 0.0000112600. This level is pivotal. A rejection here could lead to a retest of the demand zone, while a breakout could lead to a strong upward move. 5. Trading Scenarios •Bullish Scenario: If the price breaks above the supply zone (0.0000112600 to 0.0000150000) with high volume and the RSI cools off without dropping too far, the next target could be 0.0000300000. This would confirm the ascending triangle breakout. •Bearish Scenario: If the price gets rejected at the current supply zone and the RSI shows overbought conditions leading to a reversal, the price could drop back to the demand zone (0.0000070000 to 0.0000090000). A break below this support would invalidate the bullish structure and could lead to further downside. •Neutral Scenario: The price might consolidate around the current POI (0.0000112600) as it gathers momentum for the next move. Watch for volume and RSI behavior during this period. 6. Additional Observations •The chart is labeled with “BUY” at 0.0000112600 and “SELL” at 0.0000112600, which might indicate a trader’s plan to buy at a breakout or sell if the price fails to break through. •The overall market sentiment for PEPEUSDT appears bullish in the medium term due to the higher lows and the ascending triangle pattern. However, the overbought RSI signals caution for short-term traders. 7. Conclusion The PEPEUSDT pair is at a critical juncture. The price is testing a significant resistance (supply zone) within an ascending triangle pattern, supported by moderate volume and bullish momentum. However, the overbought RSI suggests a potential pullback or consolidation before a breakout. Traders should watch for a confirmed break above 0.0000150000 with strong volume for a bullish continuation, or a rejection leading to a retest of the demand zone around 0.0000070000. As of now, the structure remains bullish, but caution is advised due to the overbought conditions. If you’d like a deeper dive into any specific aspect (e.g., the indicators, volume, or a prediction based on this setup), let me know!
vahidzamani67
Shib
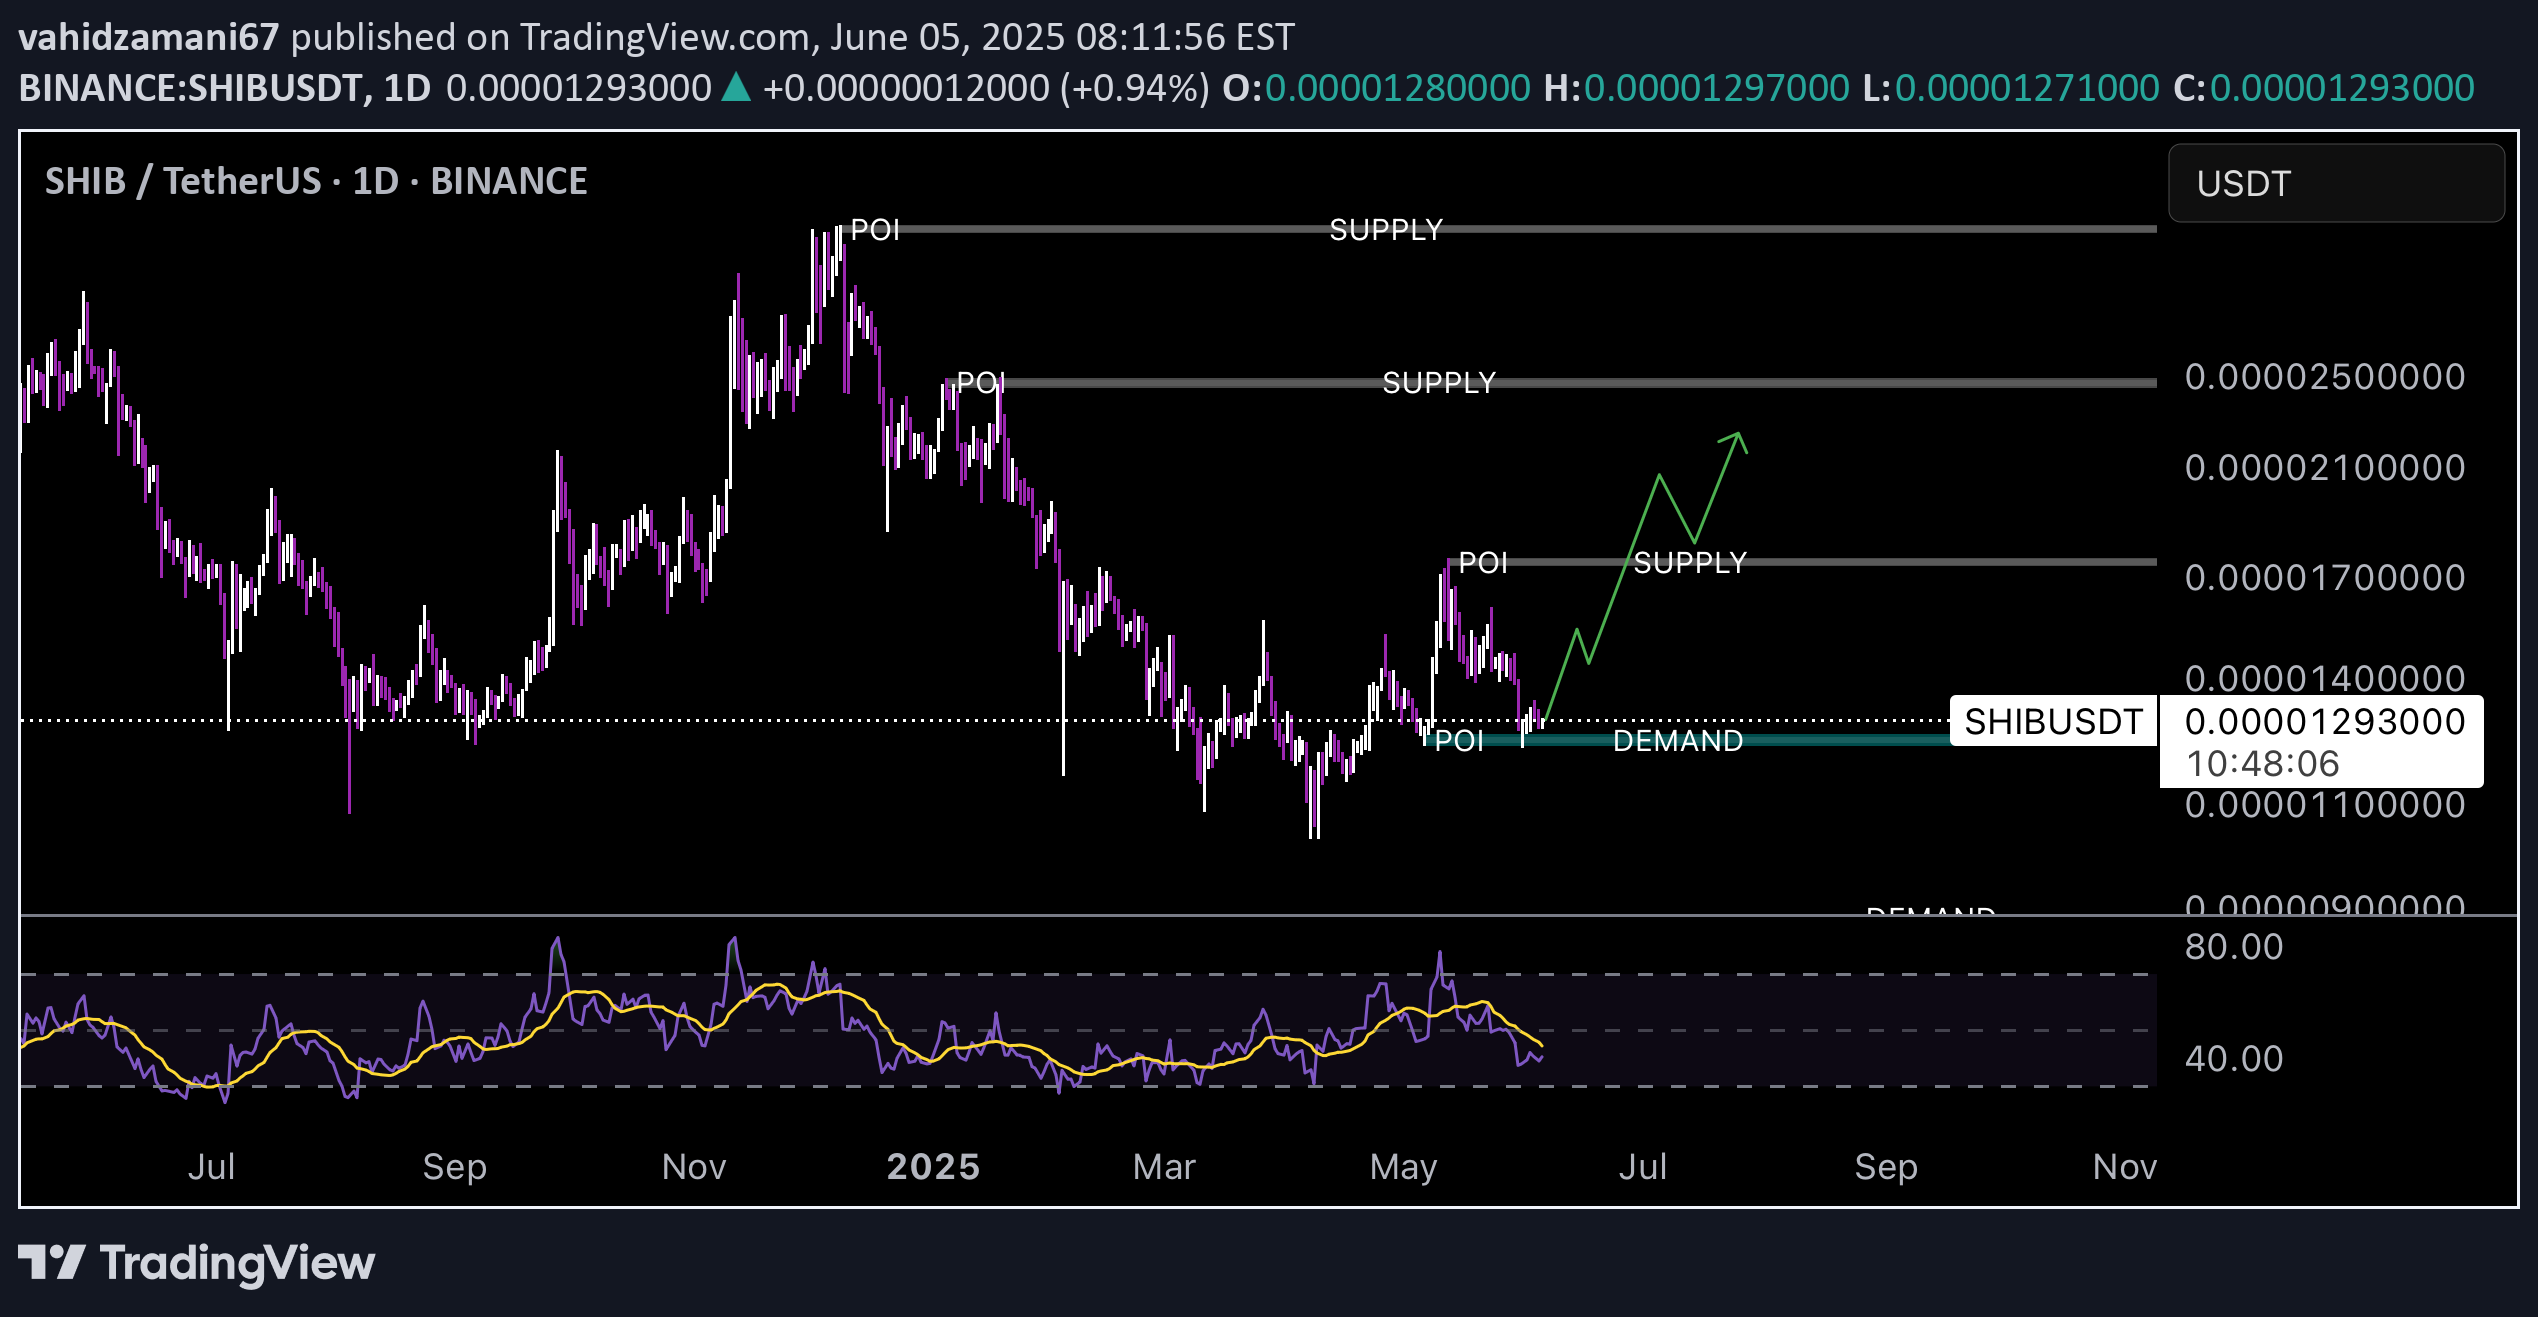
This image is a price chart of the SHIB/USDT trading pair on a daily timeframe (1D) from the Binance exchange, sourced from the TradingView platform. Let’s break down the analysis of this chart: 1. Chart Overview •Trading Pair: SHIB/USDT •Timeframe: Daily (1D) •Current Price: 0.00001296 USD •Price Change: +0.00000151 USD (+1.7%) •Date Range: The chart covers December 2024 to September 2025. •Indicator: RSI (Relative Strength Index) is displayed at the bottom of the chart. 2. Technical Analysis a) Support and Resistance Levels •Demand Zone: Around 0.00001296 USD (marked with the horizontal “DEMAND” line). This level indicates a zone where the price has previously bounced back up and is now acting as support. •Supply Zone: Around 0.00001800 USD (marked with the horizontal “SUPPLY” line). This level represents resistance where the price has faced selling pressure in the past. •Point of Interest (POI): Positioned between these two levels, indicating a potential equilibrium zone or a pivot point for price action. b) Price Trend •Past Trend: From December 2024 to early May 2025, the price was in a general downtrend, reacting multiple times to the demand zone. •Break Below Demand: In early May 2025, the price broke below the demand zone, dropping to around 0.00001050 USD. •Price Recovery: Starting mid-June 2025, the price began to rise and has now returned to the demand zone (0.00001296 USD). This recovery could indicate buyer strength at this level. •Next Target: If the price can move upward from the demand zone, the next target would be the supply zone at 0.00001800 USD. c) RSI Indicator •Current RSI Status: The RSI is currently around 50, indicating a neutral state (neither overbought nor oversold). •RSI Trend: Since early June 2025, the RSI has been trending upward alongside the price increase, suggesting growing bullish momentum. •Key RSI Levels: If the RSI rises above 70, it may enter overbought territory, potentially signaling a price reversal. Conversely, a drop below 30 could indicate weakness and a possible further decline. d) Price Patterns •Double Bottom Pattern: In late May 2025 and early June 2025, the price hit the 0.00001050 USD level twice before rising. This pattern can signal a bullish reversal. •Break of Downtrend Line: In June 2025, the price broke above a descending trendline (drawn from previous highs) and has since moved upward. This breakout confirms a shift to a bullish trend. 3. Order Block Analysis •Buy Signal: At the 0.00001296 USD level, a buy signal is displayed. This suggests that this level is identified as a good entry point for buying. •Sell Signal: There’s also a sell signal at the same 0.00001296 USD level. This might indicate market indecision at this level, but given the recent upward movement, the buy signal carries more weight. 4. Possible Scenarios a) Bullish Scenario •If the price can hold the demand zone (0.00001296 USD) and move upward, the next target would be the supply zone at 0.00001800 USD. •Breaking the supply zone could push the price to higher levels (e.g., 0.00002000 USD or more). •The rising RSI and the break of the downtrend line support this scenario. b) Bearish Scenario •If the price fails to hold the demand zone and falls below 0.00001296 USD, it could head toward the next support level at 0.00001050 USD. •A neutral or declining RSI and increased selling pressure could confirm this scenario. 5. Trading Suggestion •Entry Point: Given the buy signal at 0.00001296 USD and the recent upward movement, entering a long (buy) position could be reasonable. •Take Profit: The supply zone at 0.00001800 USD could be the first target (around 39% profit). •Stop Loss: Below 0.00001050 USD (around 19% loss) for risk management. •**Riskവ: Risk-to-Reward Ratio: This trade offers a risk-to-reward ratio of about 1:2, which is acceptable. 6. Conclusion The price of SHIB/USDT is currently at a critical juncture. The return to the demand zone and the break of the downtrend line suggest potential for a continued uptrend, but the price needs to consolidate above 0.00001296 USD to confirm this trend. The RSI is neutral and requires further movement to confirm bullish or bearish momentum. Traders should proceed with proper risk management and monitor price action at key levels. If you need further analysis or additional information, I’d be happy to help!
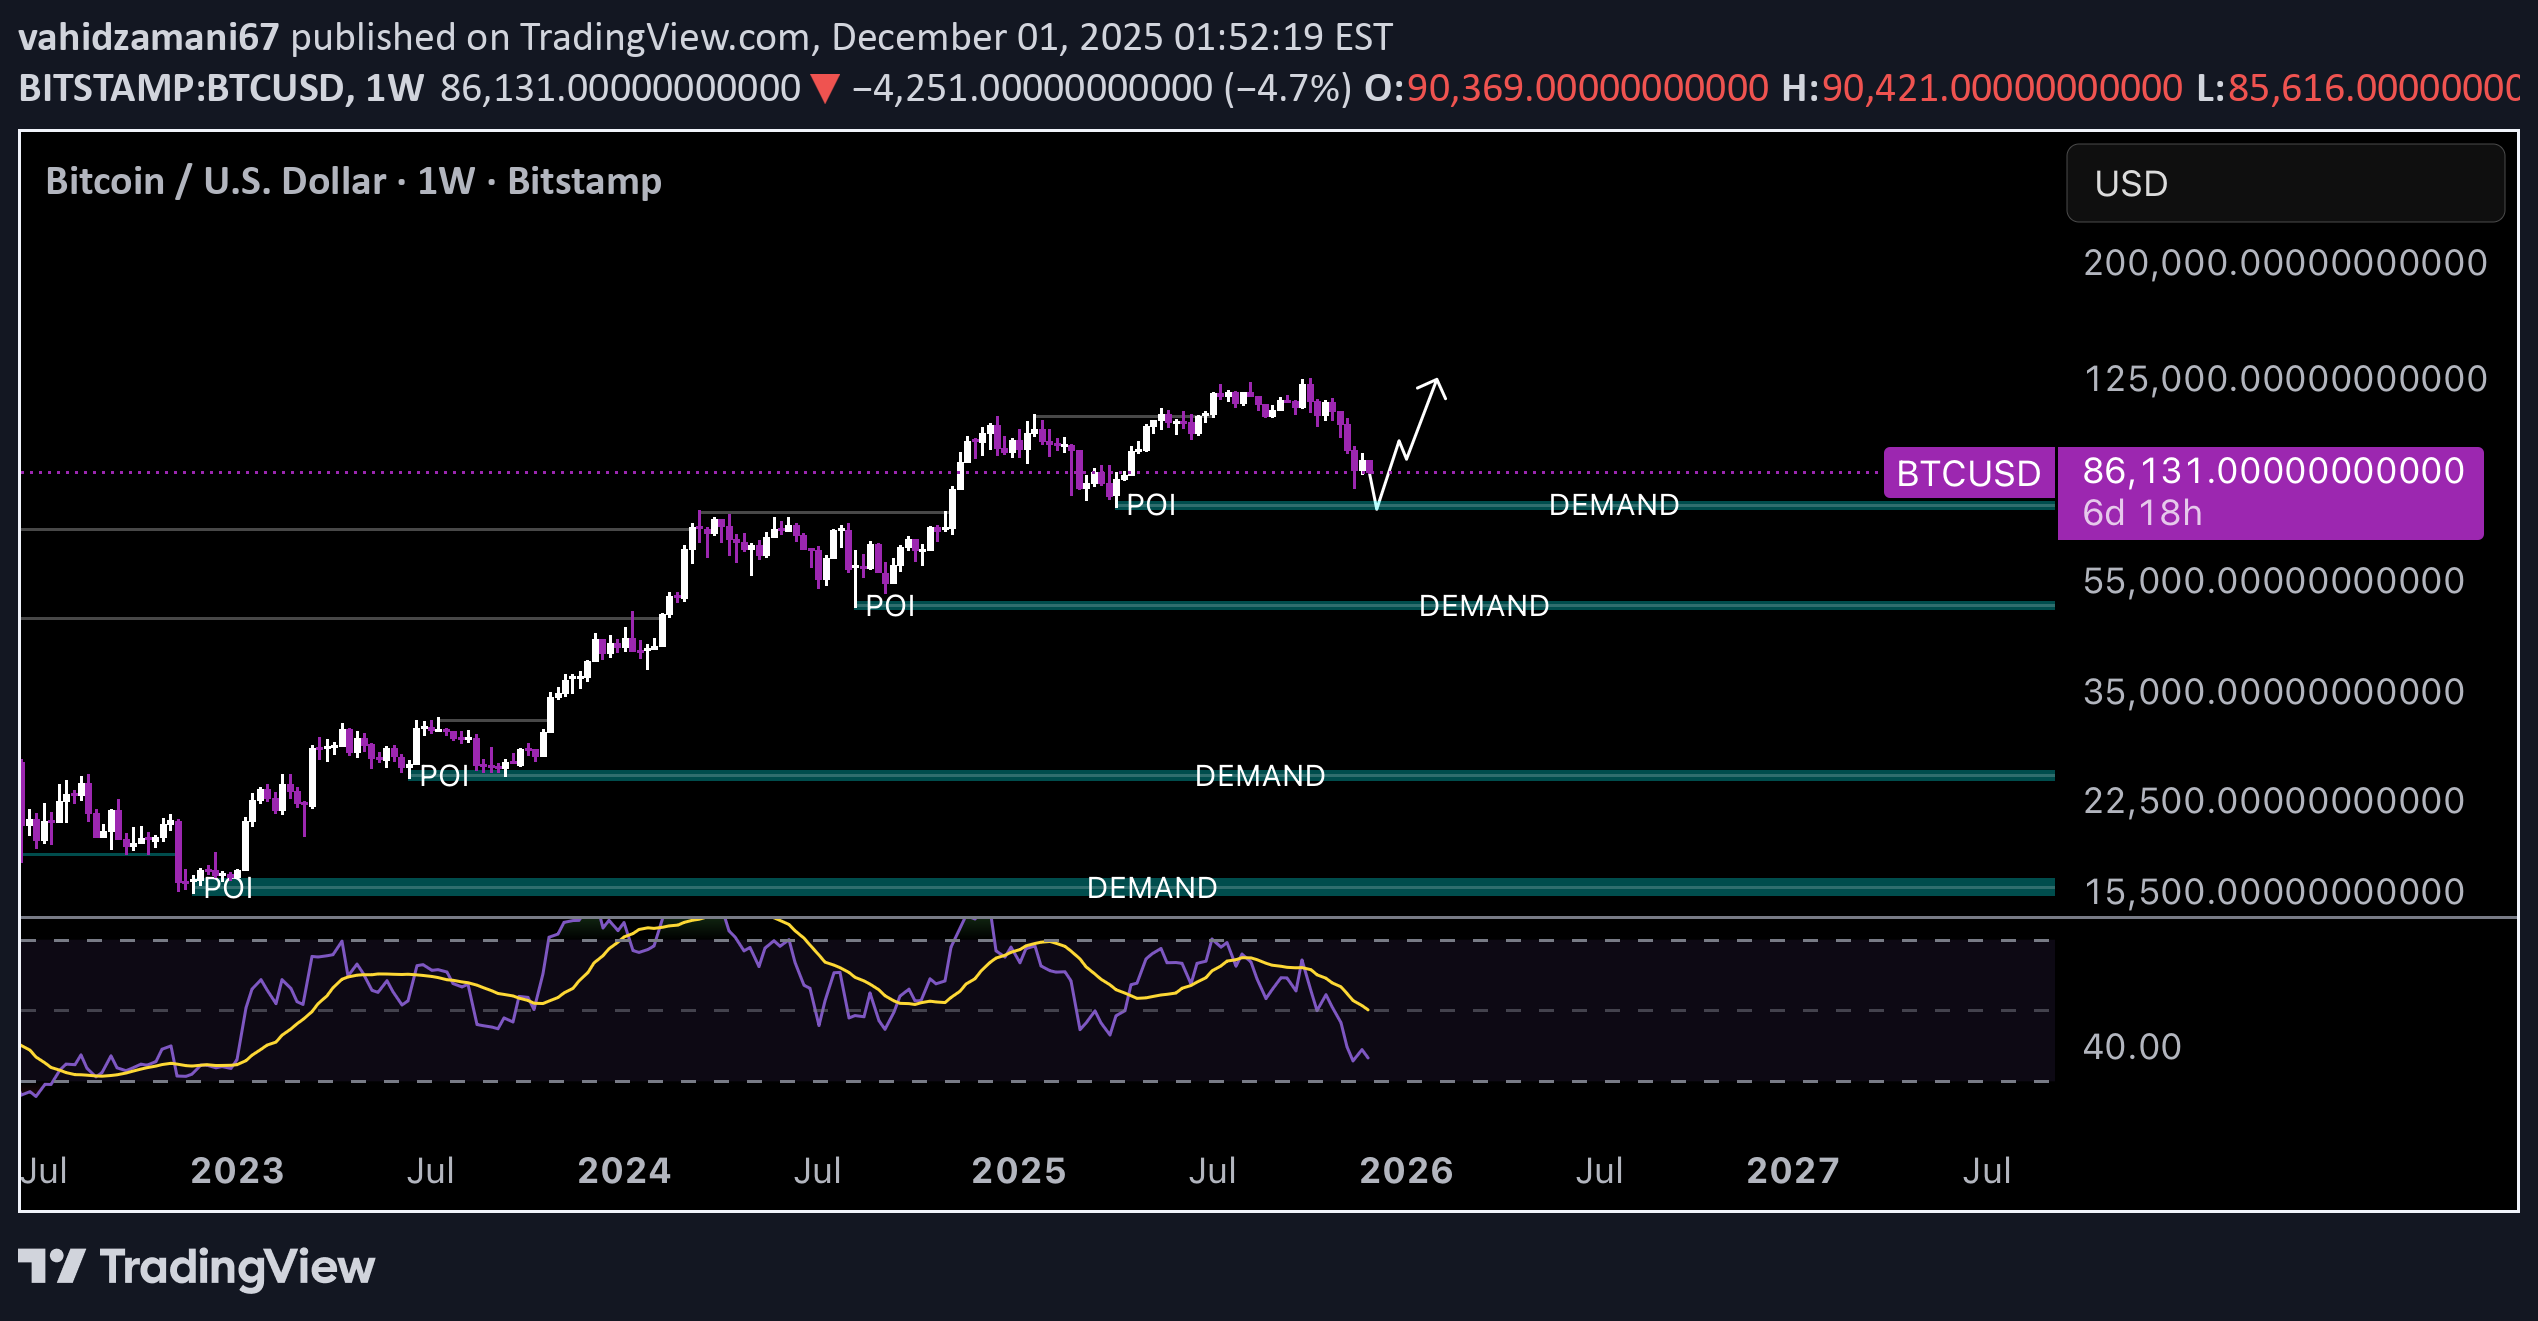
vahidzamani67
Btc

Hi guys #Bitcoin has completed the bullish flag pattern and can grow to $162,000 Dear friends, please note that this is the weekly chart of Bitcoin and this target is until the end of this summer
vahidzamani67
Btc

- The post analyzes Bitcoin's failure to break above a descending trendline on the daily chart, suggesting a potential further decline as Tether's dominance (USDT) finds support at an ascending trendline, indicating market caution. - Bitcoin's price is hovering around $92,000, with key support levels at $80,000 and $70,000, as noted in recent market analyses, aligning with the post's bearish outlook. - The author has moved to cash, awaiting a better entry point, reflecting a strategy of risk management amid market uncertainty highlighted by recent institutional Bitcoin acquisitions and ETF inflows.
vahidzamani67
Doge

Dogecoin (DOGE) Hi guys ### Key Observations: 1. **Price Action:** - Current price: **0.16358 USDT**. - Projected price movement indicates a potential upward trend toward **0.42232 USDT**. 2. **Supply and Demand Zones:** - **Demand Zone (green box):** Indicates areas where buyers might step in, increasing the price. - **Supply Zone (red box):** Represents areas of potential selling pressure, causing resistance. 3. **Trading Tools & Indicators:** - Labeled as **FluidTrades - SMC Lite 10 20 2.5**, suggesting a strategy based on Smart Money Concepts (SMC). - Points of Interest (POI) are highlighted, likely indicating critical levels for price reaction. 4. **Market Sentiment:** - The terms "BUY" and "SELL" prices suggest a current spread, with the price slightly above the equilibrium level. This chart provides a detailed framework for predicting Dogecoin's price action, catering primarily to technical traders. The marked zones and projected trend offer clues on potential market behavior. Let me know if you'd like a deeper dive into any of these aspects!
vahidzamani67
XAU

Hi guys I took a look at your chart, which maps the daily price movements of Gold Spot against the U.S. Dollar (XAU/USD) from 2024 to 2025. Here's a brief analysis: ### Price Trends: - **Current Price**: $2,861.055, with a daily change of +18.765 (+0.66%). - **Projected Movement**: The green arrow suggests a potential future price movement towards the $3,200.000 level. ### Key Levels: - **Fibonacci Retracement Levels**: - 0%: $2,276.094 - 50%: $2,523.810 - 61.8%: $2,585.966 - 100%: $2,797.874 - 161.8%: $3,178.087 ### Points of Interest: - **POI and Demand Zones**: Highlighted to indicate potential areas where the price could react (either by rebounding or consolidating). ### Trading Information: - **Sell Price**: $2,860.660 - **Buy Price**: $2,861.370 ### Insight: The chart indicates a bullish trend with the projection towards the higher price level of $3,200. The Fibonacci levels provide potential support and resistance areas, useful for identifying trade opportunities. If you're into gold trading or investing, this chart is valuable for tracking price movements and making informed decisions. Let me know if you need further assistance or specific insights! 😊
Disclaimer
Any content and materials included in Sahmeto's website and official communication channels are a compilation of personal opinions and analyses and are not binding. They do not constitute any recommendation for buying, selling, entering or exiting the stock market and cryptocurrency market. Also, all news and analyses included in the website and channels are merely republished information from official and unofficial domestic and foreign sources, and it is obvious that users of the said content are responsible for following up and ensuring the authenticity and accuracy of the materials. Therefore, while disclaiming responsibility, it is declared that the responsibility for any decision-making, action, and potential profit and loss in the capital market and cryptocurrency market lies with the trader.