Technical analysis by vahidzamani67 about Symbol ETH on 7/23/2025

Eth
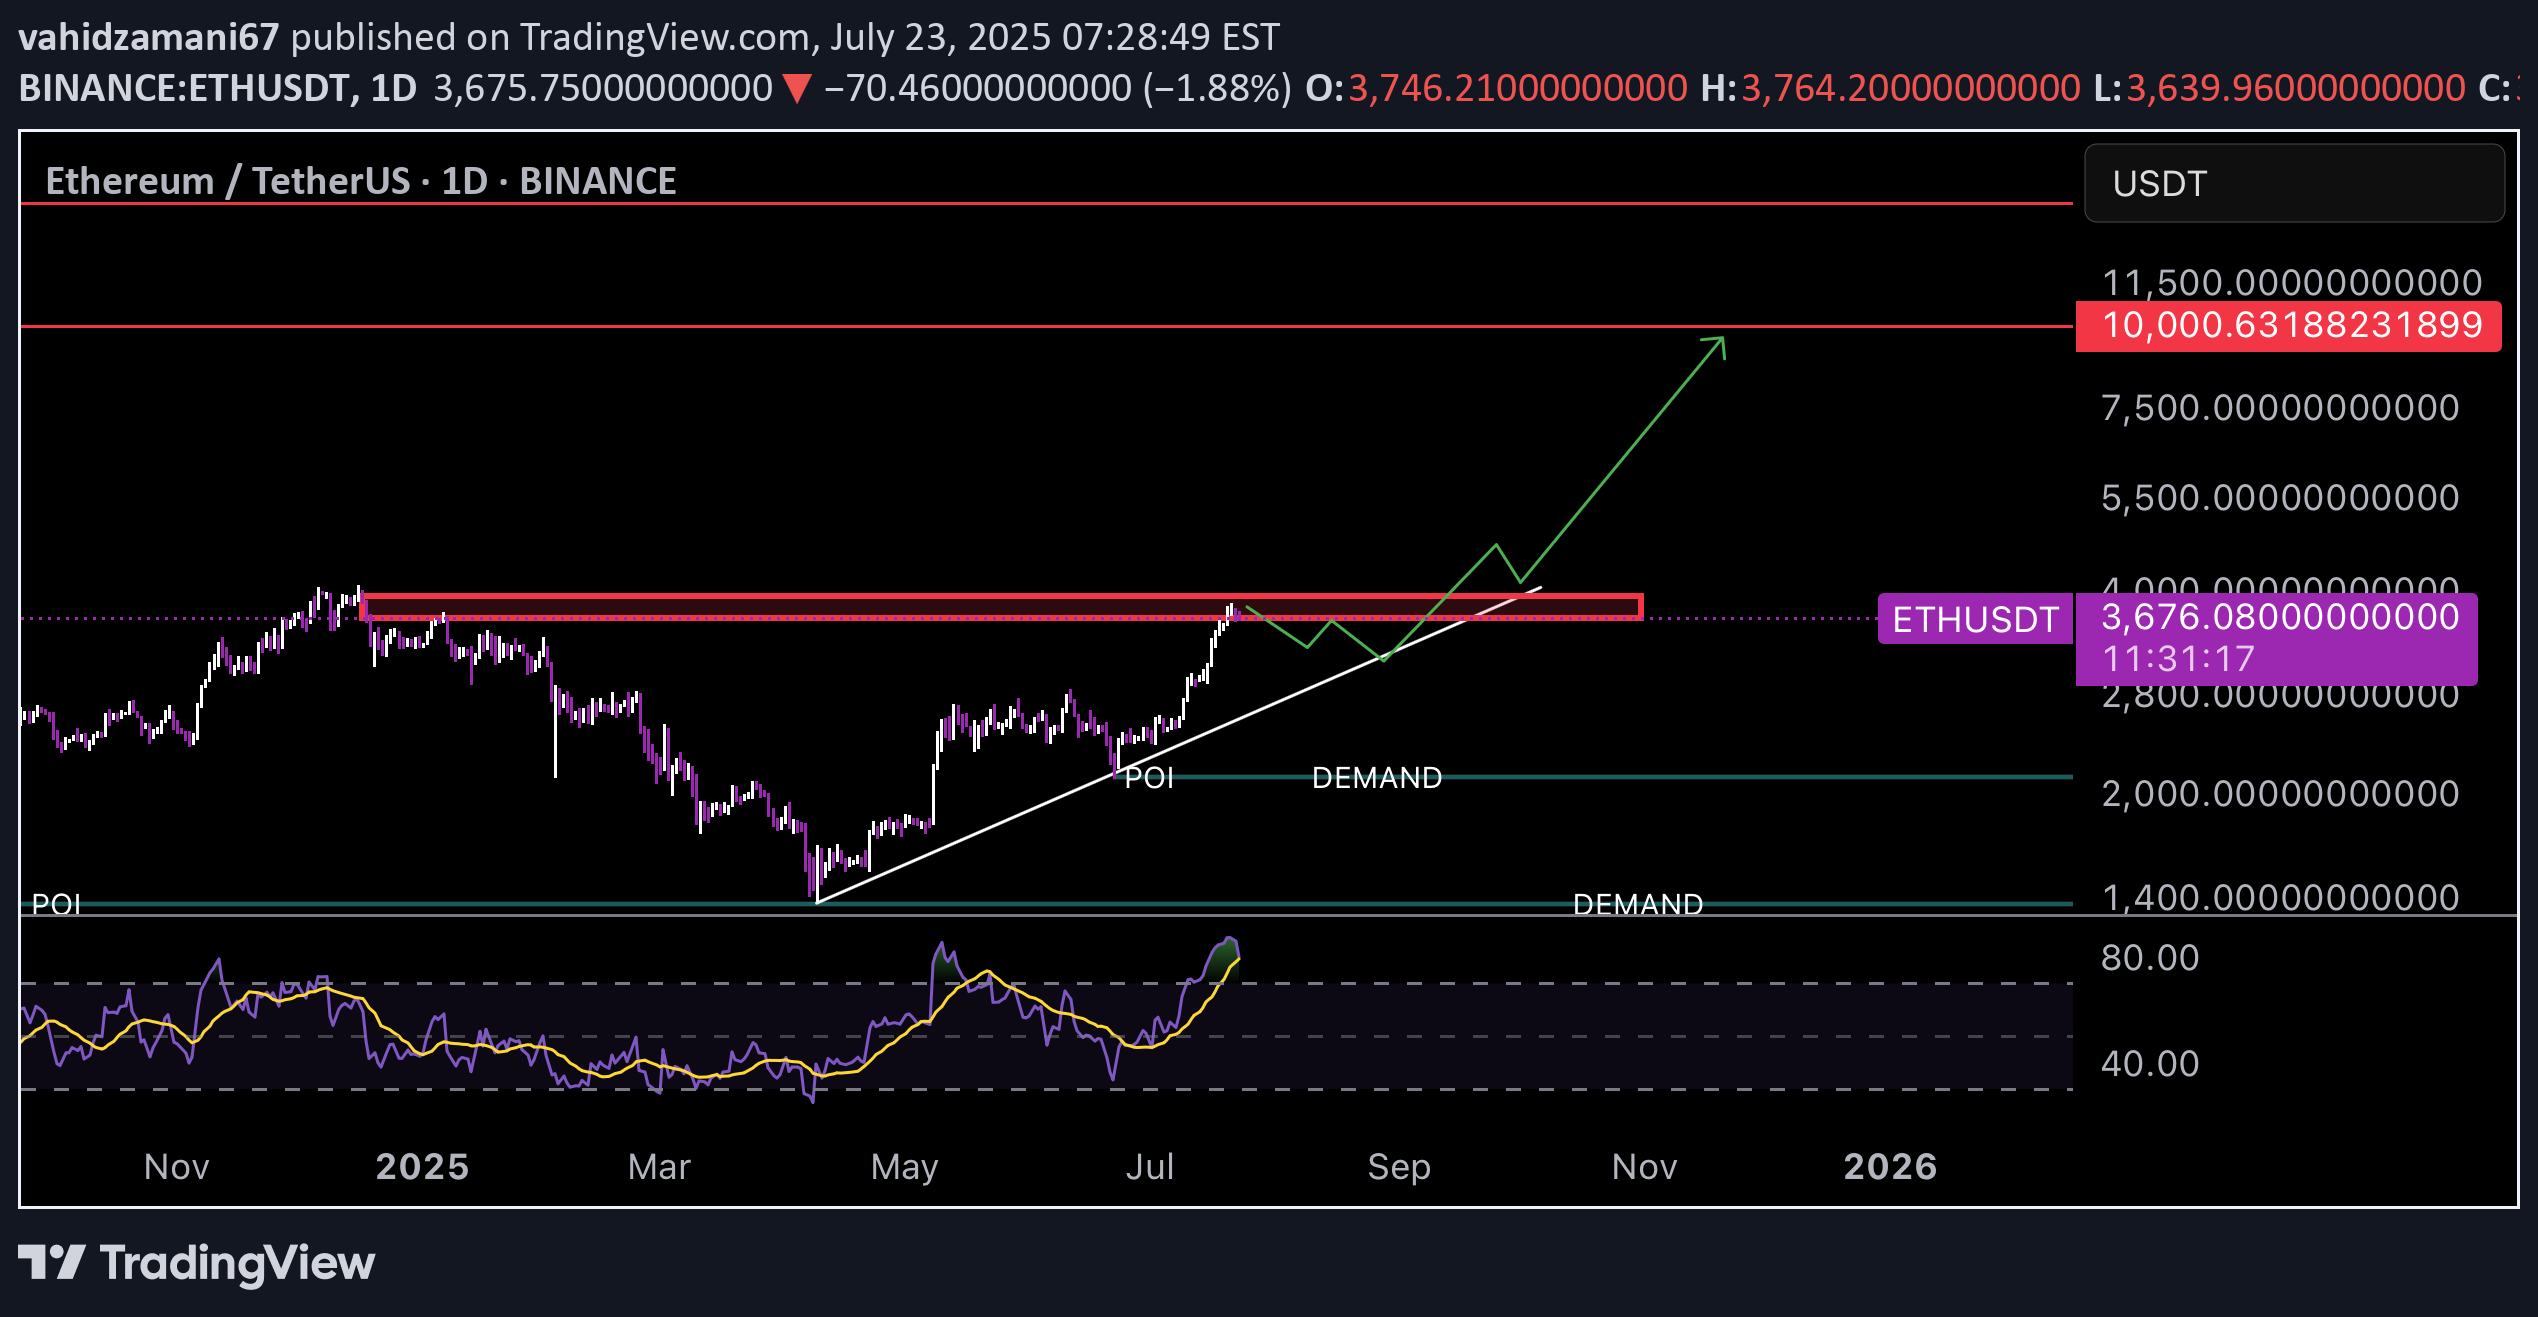
For a technical analysis of the provided ETH/USDT 1D chart, here are the key points: 1. **Current Price and Changes**: The current price is around 3,672.23 USD, down 1.99% (74.54 USD) from the previous day. 2. **Support and Resistance Levels**: - **Resistance**: Near 3,672.24 USD (current SELL level), marked by the red line. - **Supports**: Demand levels around 1,800 and 40 USD indicate potential support zones if the price drops significantly. 3. **Trend and Direction**: An upward trend line from the chart's bottom to the current point suggests an overall bullish trend, though the recent break below the resistance line may indicate weakness. 4. **Indicators**: - The POI (Point of Interest) line near 3,672 USD highlights a key level where price is fluctuating. - The lower indicator (likely RSI or similar) shows price oscillations, currently in a neutral zone with no clear buy or sell signal. 5. **Short-Term Outlook**: If the price fails to stabilize above 3,672 USD, it may move toward lower demand levels (e.g., 1,800 USD). A breakout and stabilization above resistance could target 10,000 USD (based on the upward trend line). For a more detailed analysis, consider adding indicators like MACD or Bollinger Bands. Would you like me to create a visual chart in a separate panel?