Technical analysis by vahidzamani67 about Symbol DOGE on 7/23/2025

Doge
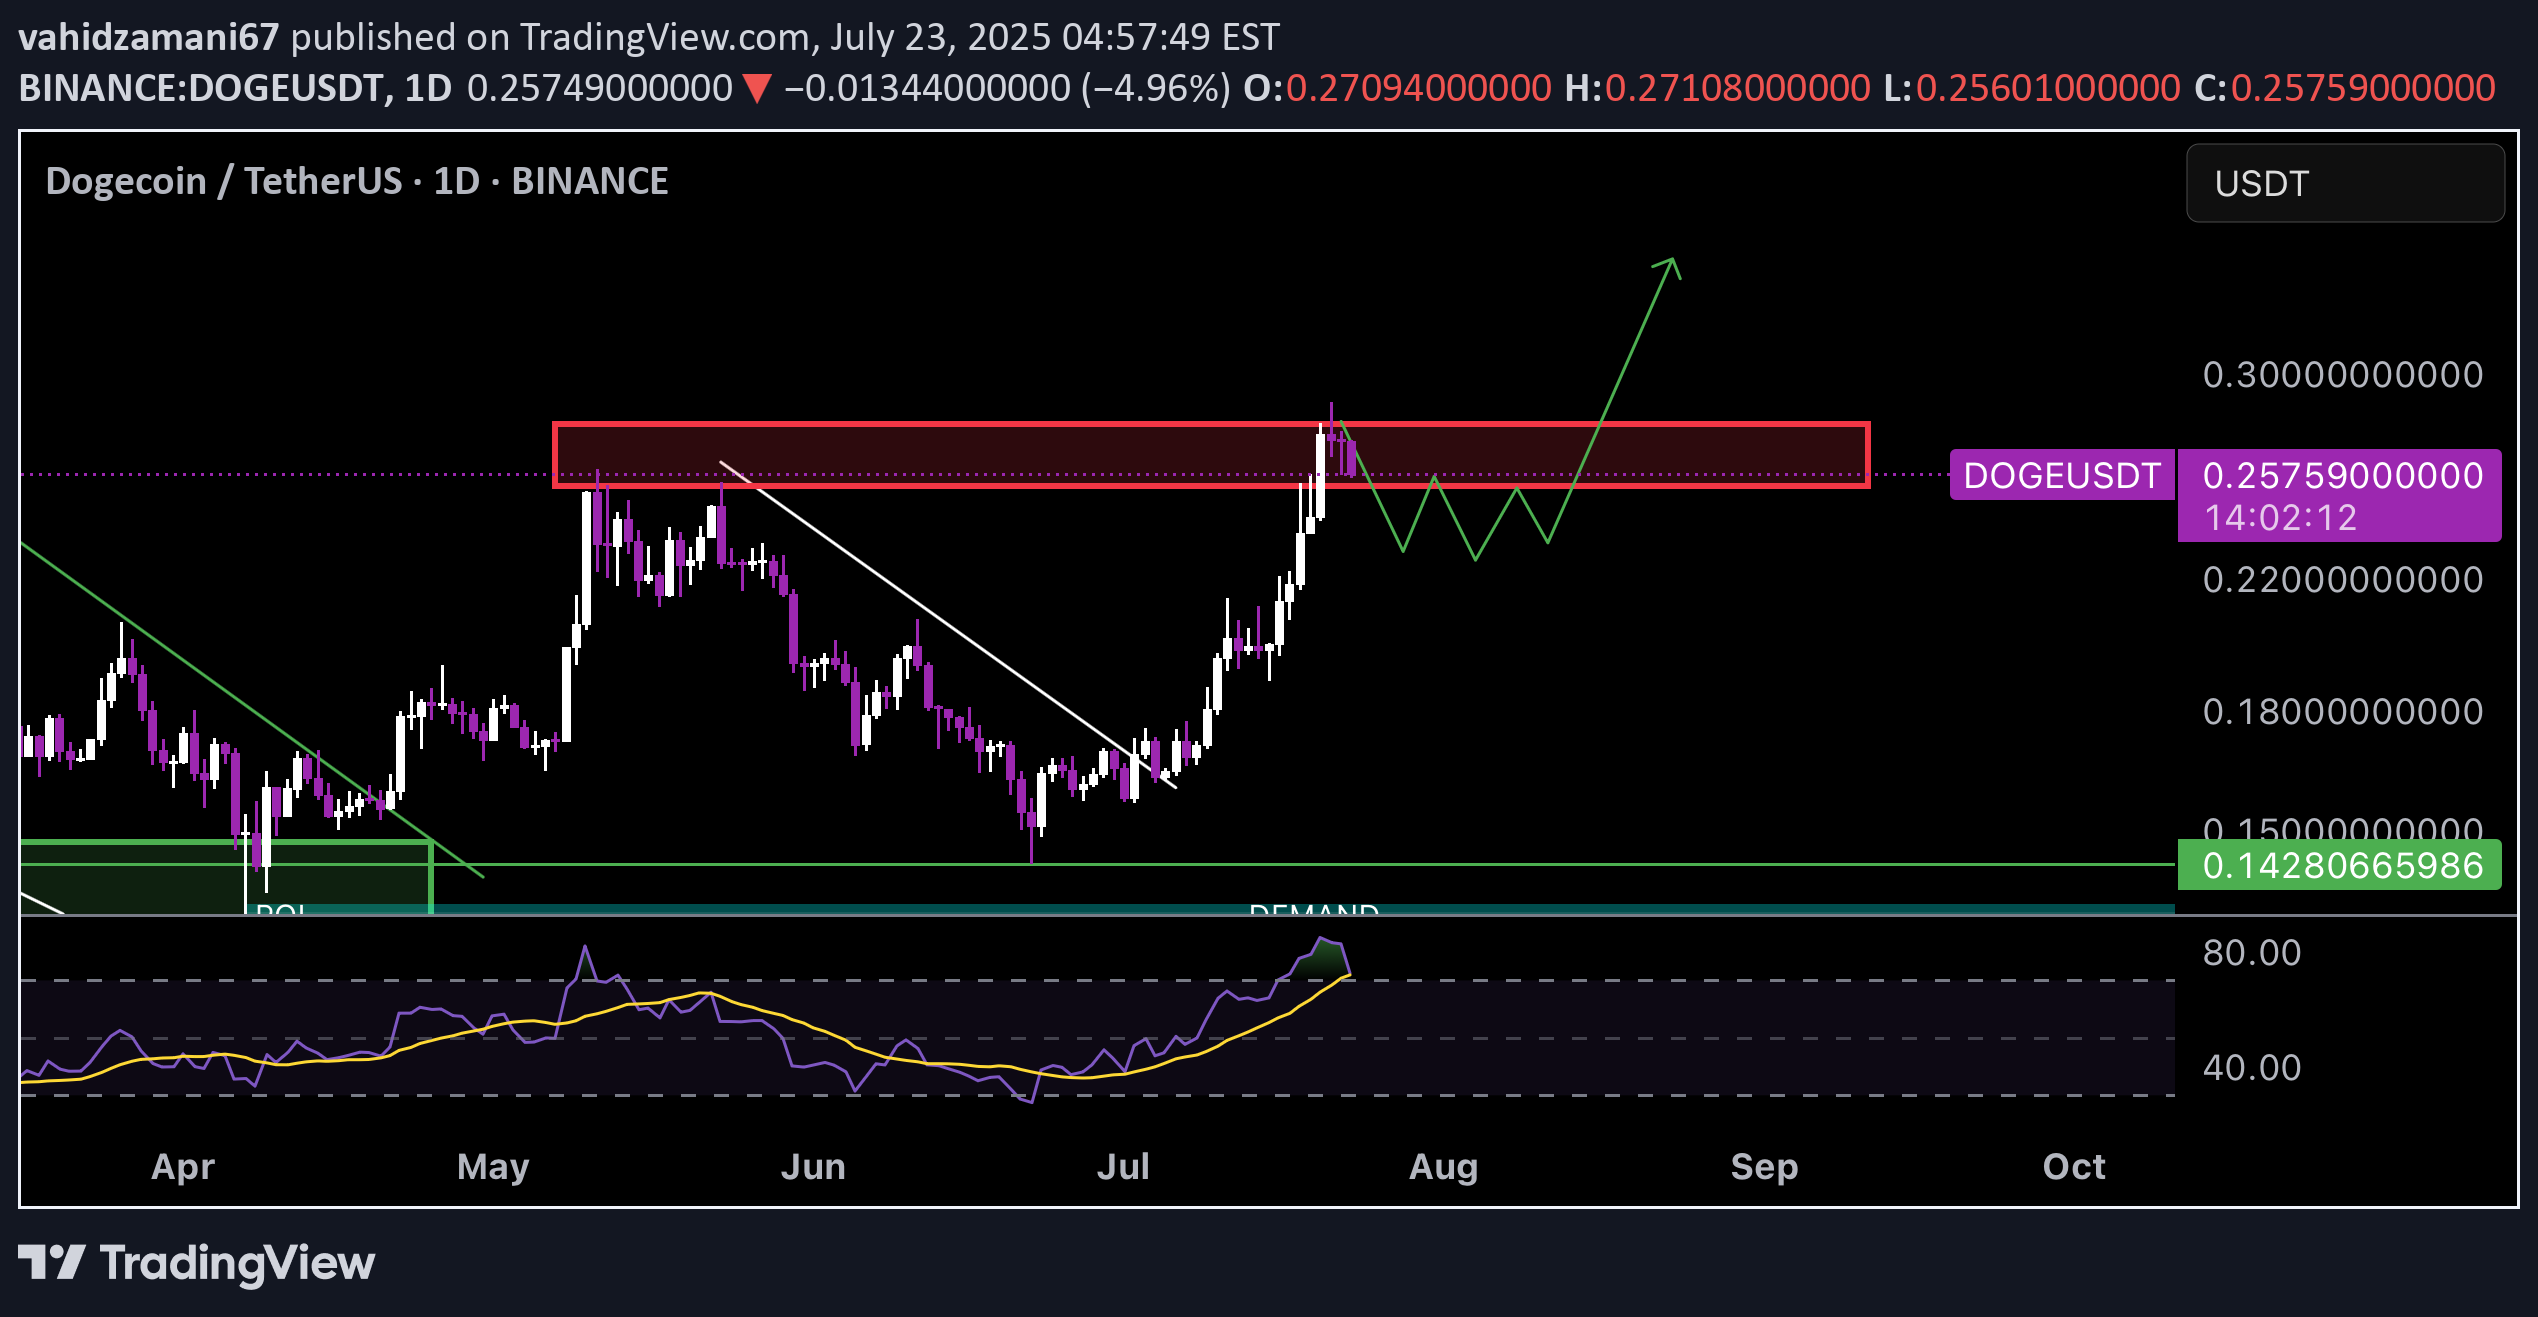
•Current Price Level: The current price is 0.25770 USD, with a decrease of 0.01323 USD (4.88%). •Support and Resistance Levels: ◦Key Resistance: Around 0.25770 USD (red line), which is currently a critical level to test. Breaking this could push toward the 0.30000 USD marked level. ◦Key Support: At 0.14280 USD (green line). If the price drops below this, it might fall to 0.11000 USD. •Trend Line: The white diagonal line indicates a previous downtrend that has recently been broken. This could signal a shift to an uptrend, but it needs confirmation with higher volume. •RSI (Relative Strength Index): At the bottom of the chart, RSI has moved out of the oversold territory (below 30) and is around 40-50. This suggests selling pressure is easing and it may soon enter a neutral or bullish zone (above 50). •Trading Volume: The recent increase in volume as the price approaches resistance indicates buyer interest, but sustained volume is needed to confirm an uptrend. •Patterns: The price movement forming a wavy (W-shaped) pattern near resistance could indicate consolidation. A decisive break above 0.25770 with a confirmation candle could activate the next target. Conclusion: The chart suggests DOGE is at a pivotal price point. Breaking the 0.25770 resistance could confirm an upward move, otherwise a drop to the 0.14280 support is possible. It’s recommended to use a stop loss below the support and monitor trading volume. For real-time data, I can search if you’d like.