
takethecannoli
@t_takethecannoli

What symbols does the trader recommend buying?
Purchase History
پیام های تریدر
Filter
takethecannoli
LTO/USDT GÜNLÜK

The image is beautiful. Falling broken, there is TOBO formation below. Similar image is available in many coine. Especially in the FTM graph, there was a very similar image and took it. Let's see what he will do. I also think that when RWA is a trend again, it will benefit from this wind in this coin.
takethecannoli
BOME/USDT 4H

Meme is a little behind in the coin craze. For now, it is rising by making rising bottoms. Let's see if there will be an explosion.
takethecannoli
CFG/USDT HAFTALIK (RWA NARRATIVE)

Centrifuge is the sand and cement of the rwa trend. They have very close contacts with Blackrock. I hope it will be reflected in its price much more positively. You see, there is no need to explain the graph. What's coming is coming. Ytd is for my own follow up.
takethecannoli
APT/USDT HAFTALIK

Three scenarios in my mind for Aptos. Since I view the market as bullish, I think it is bullish. It is for my own monitoring. YTD
takethecannoli
ADA/USDT HAFTALIK

When we look at the past periods, we can see that Ada is preparing for something again. I love graphics with history. This chart is not a chart where Ada will be $100. Charts with historical data also help you understand the trend. It tells us how previous cycles started and how they ended. It is for my own monitoring. YTD
takethecannoli
CHZ/USDT HAFTALIK

It is a weekly chart. It broke its downward trend and made a retest. It also won an important region horizontally. Unless something goes wrong, it will aim higher. It may take time. He's just waiting to have the wind at his back. Ytd is for my own follow up.
takethecannoli
STRK/USDT 2H TOBO
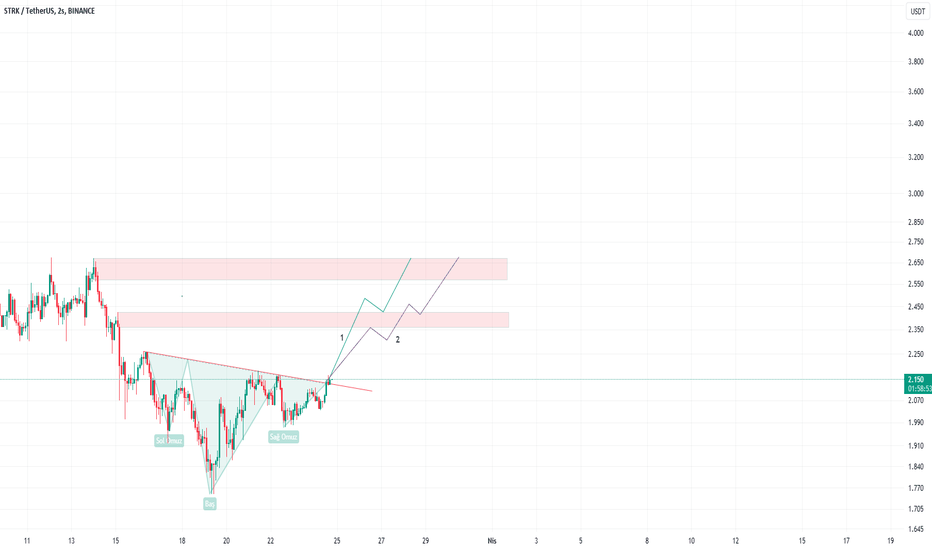
There is TOBO image, let's see if it works? I'm thinking of 2 scenarios. YTD is for my own tracking.
takethecannoli

takethecannoli
ALGO/USDT HAFTALIK

The tobo formation below is positive that it has already broken the falling wedge. It will want to aim upwards with a gain of 0.28. For tracking purposes YTD
takethecannoli
STRK/USDT
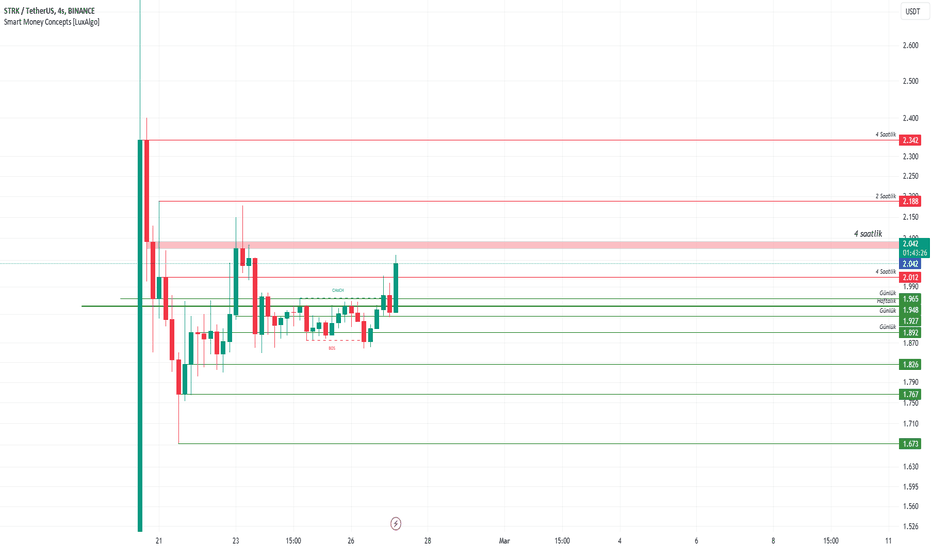
It is a new coin and has an unstable chart. But the current levels are working fine. I think it will evolve into a more bullish structure as it gains the red regions above. I care about candle closes. It gained momentum with its daily closing above 1,966. 2,092 in 4 hours is important now. Closing on it will make it even more active. Selling pressure was continuing due to an eventful airdrop and a large amount of locked tokens to be opened in April, but the company made a statement and said that they had changed tokenomics and it had a positive effect, the price jumped to around $2.17 and the selling pressure decreased. The market seems to have the wind behind it as BTC reached 55 thousand. I think it will aim for higher prices unless something goes wrong. I made gradual purchases from the $2.23 and $1.88 regions and accumulated money. My average is $1.99. I will add it if it reaches the green areas below. Its investors are big and it is a project as big as its investors. I think they will not leave this property on the ground even if it falls. This is a chart I created for my own tracking. ytd
Disclaimer
Any content and materials included in Sahmeto's website and official communication channels are a compilation of personal opinions and analyses and are not binding. They do not constitute any recommendation for buying, selling, entering or exiting the stock market and cryptocurrency market. Also, all news and analyses included in the website and channels are merely republished information from official and unofficial domestic and foreign sources, and it is obvious that users of the said content are responsible for following up and ensuring the authenticity and accuracy of the materials. Therefore, while disclaiming responsibility, it is declared that the responsibility for any decision-making, action, and potential profit and loss in the capital market and cryptocurrency market lies with the trader.