
stewdamus
@t_stewdamus

What symbols does the trader recommend buying?
Purchase History
پیام های تریدر
Filter
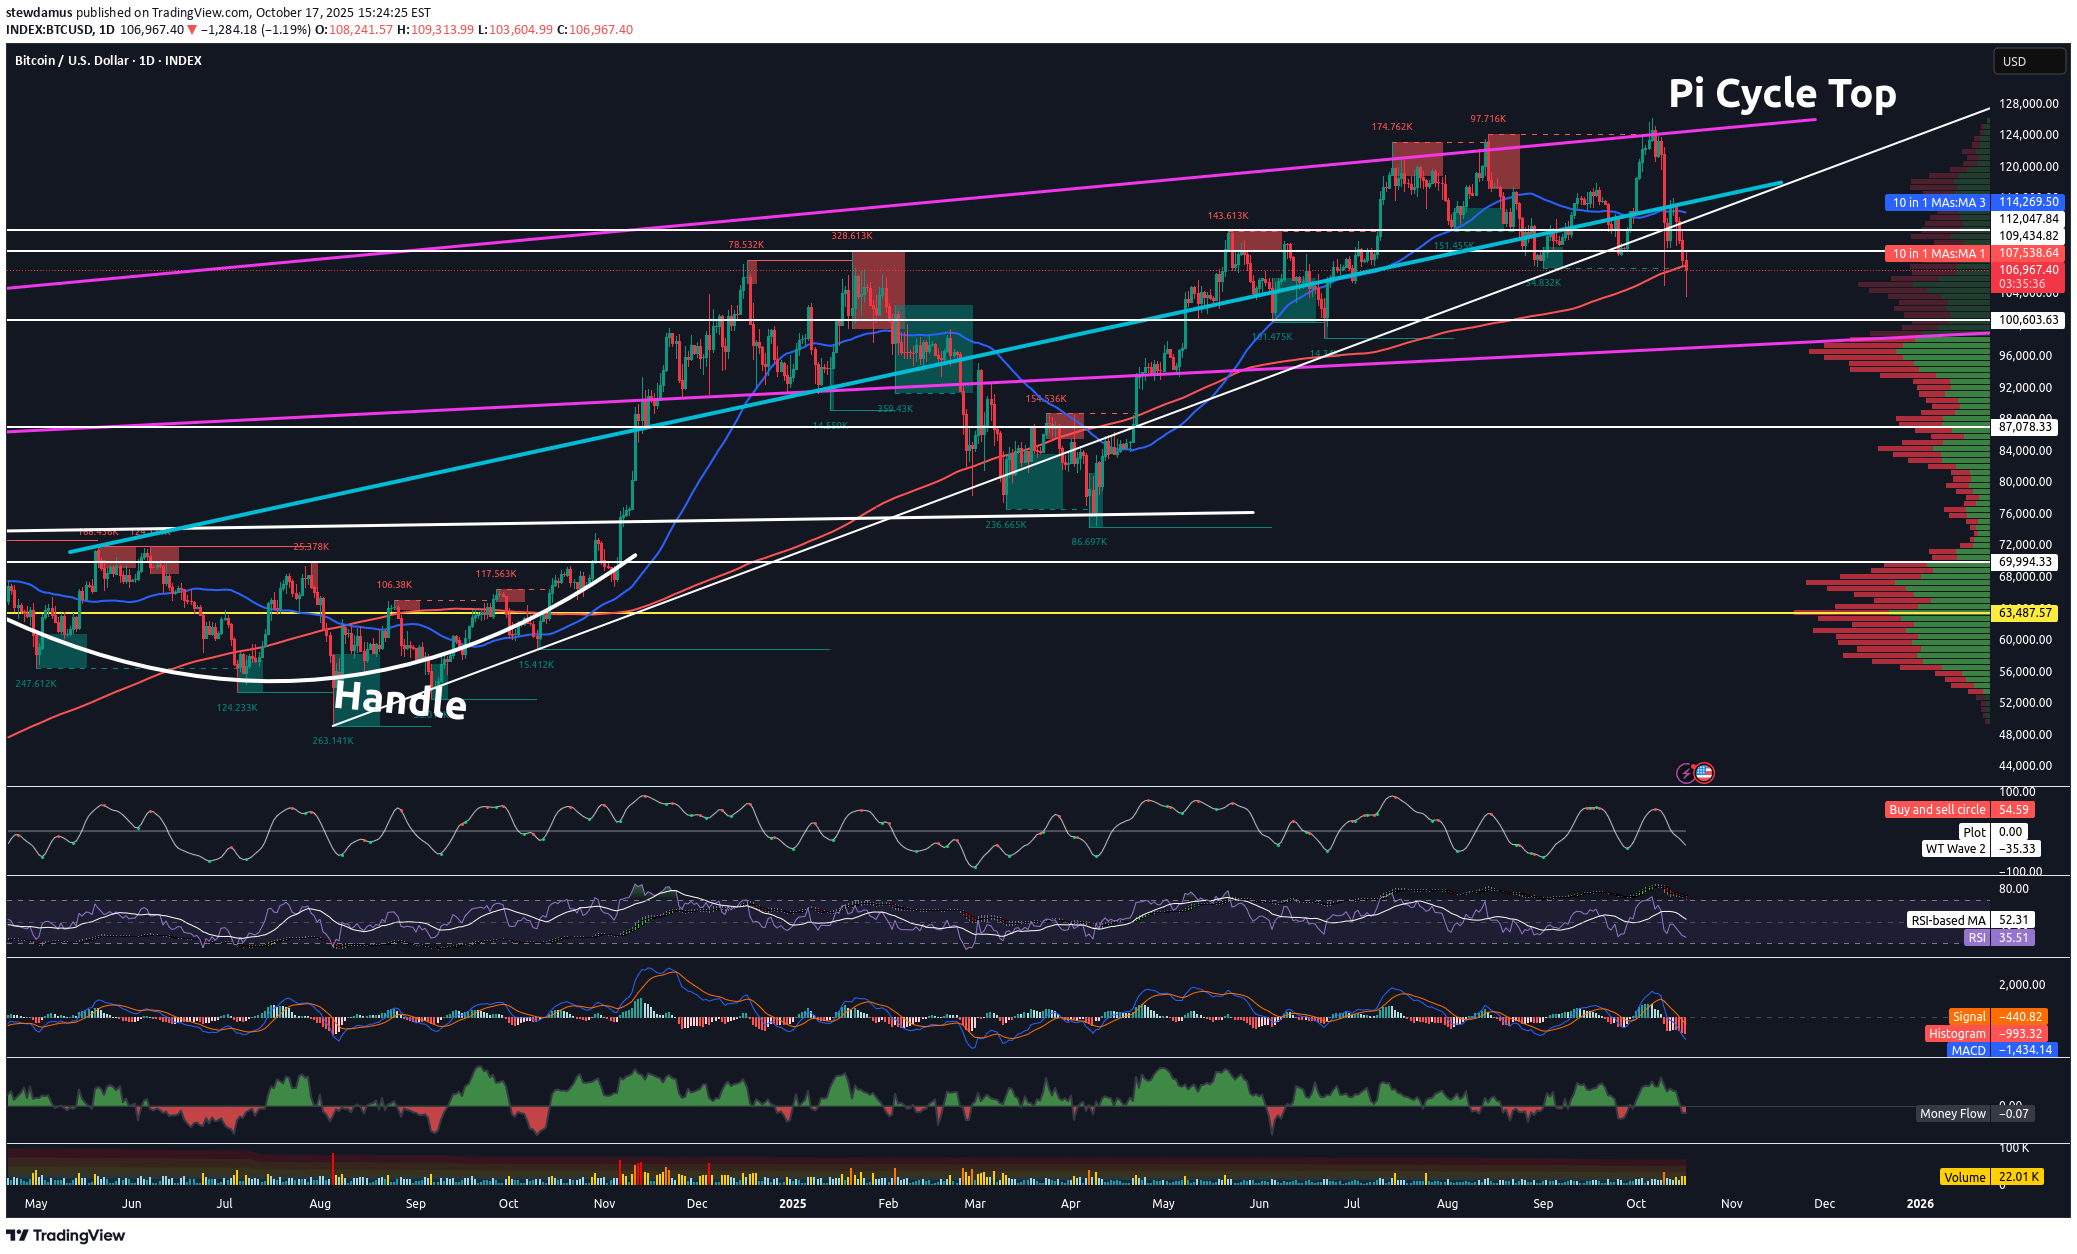
Unless BTC Breaks Above 200/350 Daily SMA ...Still Bearish

Trading Fam, Crypto traders must have been naughty this year. Even our expected Santa Rally fell short of expectations. In other words, even this crypto grinch expected more from Santa’s reindeer. As stated in previous posts, I was expecting a bounce to at least 100k. But so far, that hasn’t happened. BTC remains in the bear flag and could not even muster enough energy to touch the top of the channel. Unless Santa had mechanical issues with his sleigh and is running behind, it looks like crypto traders have received coal in their stockings this year. So, here’s what I am seeing for price action moving into next year. The only way we can count our Wyckoff Market Cycle as complete is if we happen to rally up above the top of our bear flag channel and break above the 350 SMA (orange) with confirmation. However, even that leaves some doubt. I’d prefer to see us break above that 200 SMA (red) and confirm to be more sure, otherwise, any rally may simply become a big old bull trap. The remaining scenarios I see are noted: we either break down from the bear flag immediately, or we touch the top of the flag first, or that descending red trendline before continuation down. At this point, these are the most likely scenarios. That red trendline on the underside of price, which is currently acting as support, comes all the way from the previous cycle highs in April of 2021 to Nov. of 2021 and is continued out to the present day. If this is broken, further selling should be expected. At that point, I am not even sure my Target #1 would hold strong. Meanwhile, gold, silver, and basically all precious metals are flying! Just don’t let Peter Schiff know you’ve noticed. ✌️Stew
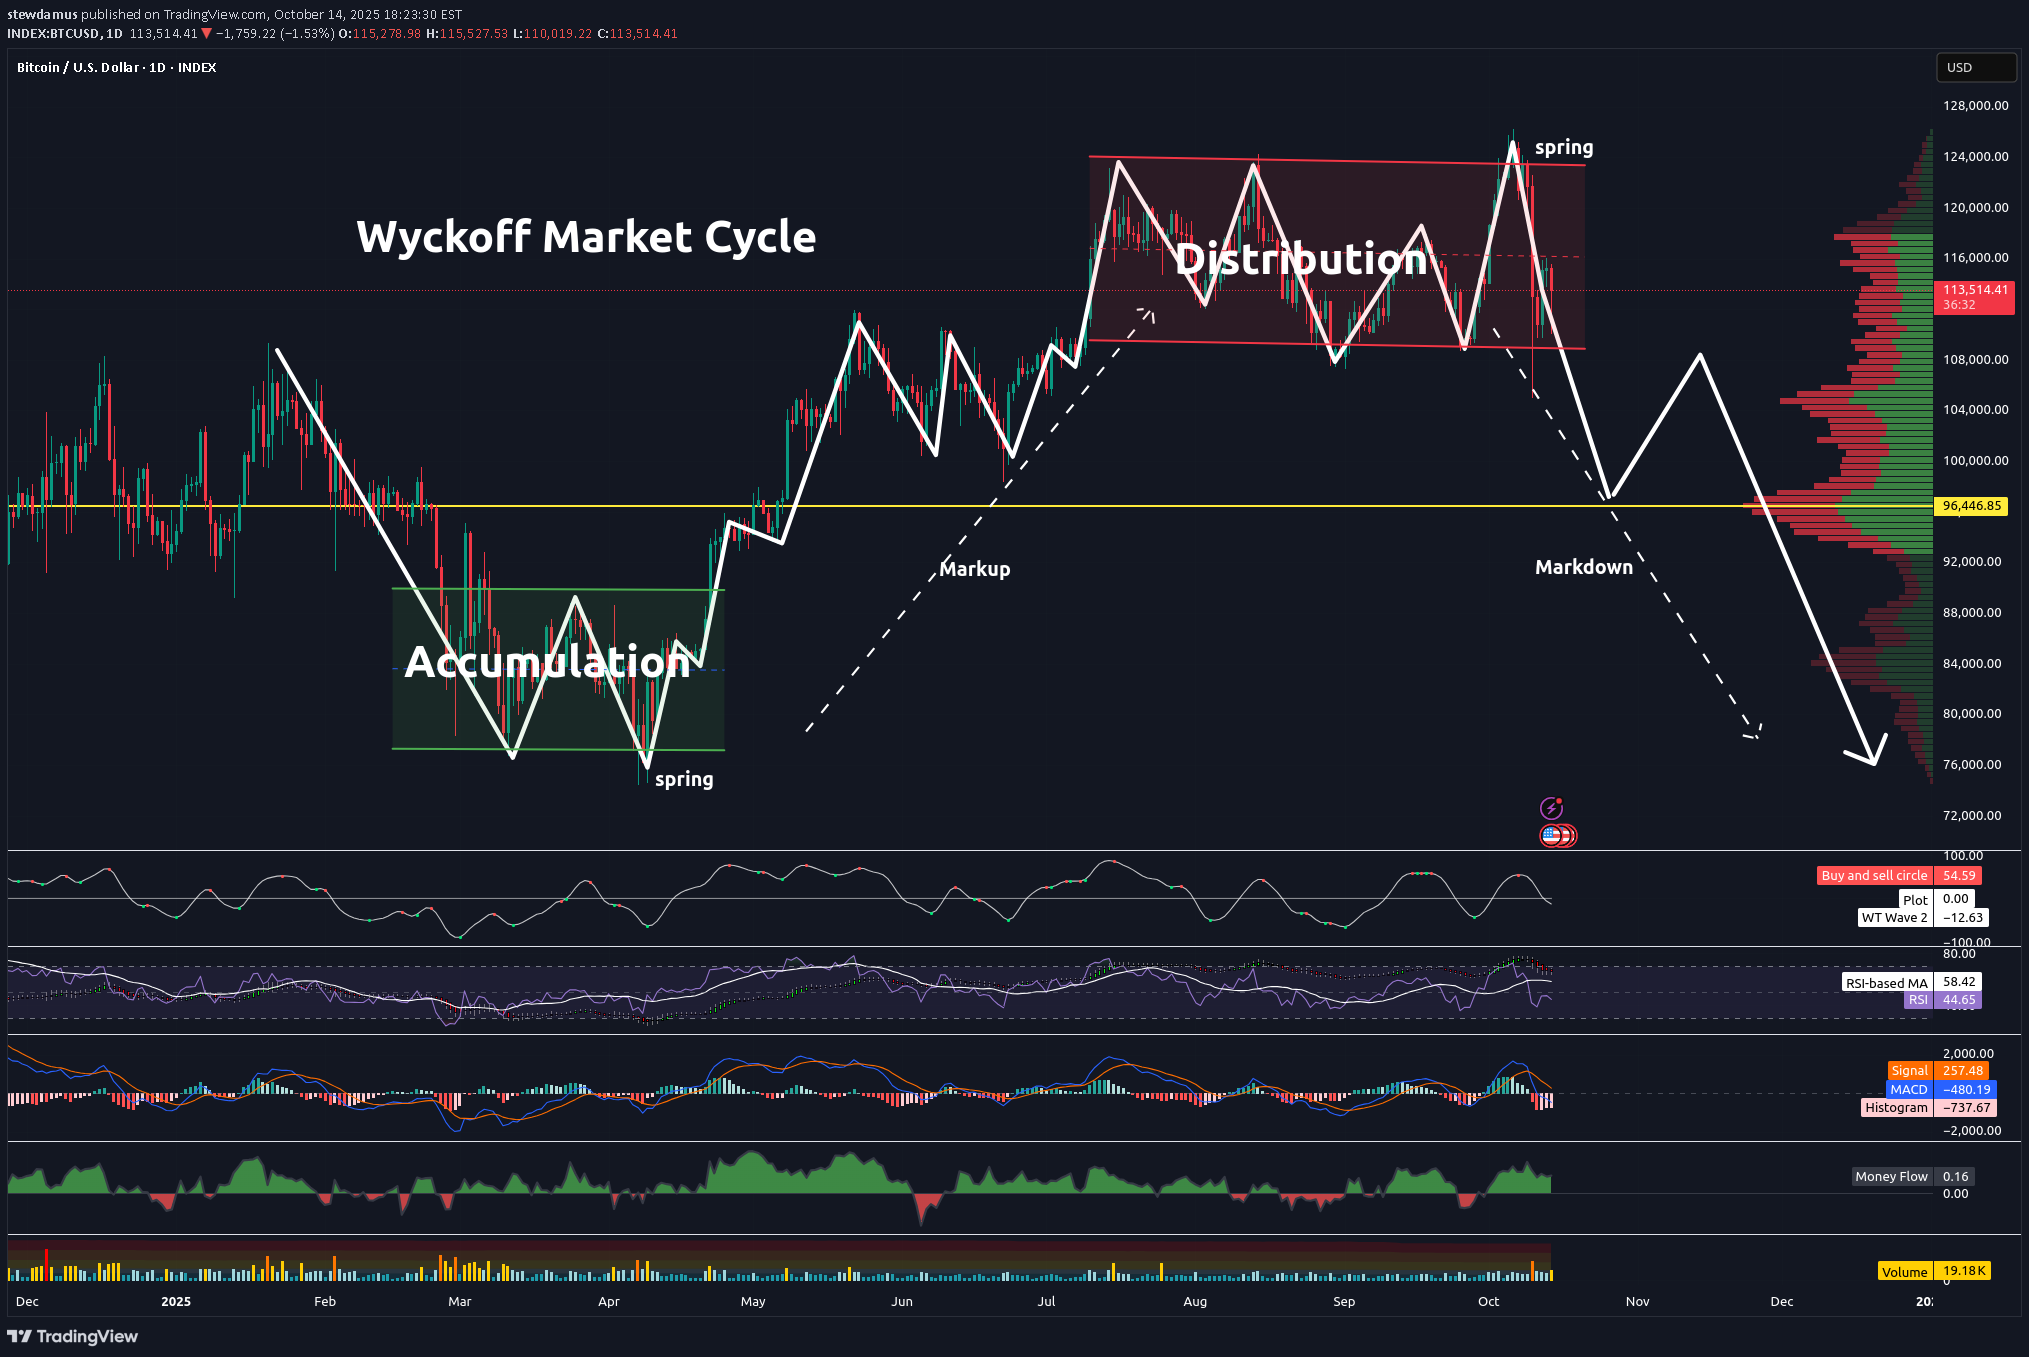
Confirming Chart Patterns With Volume

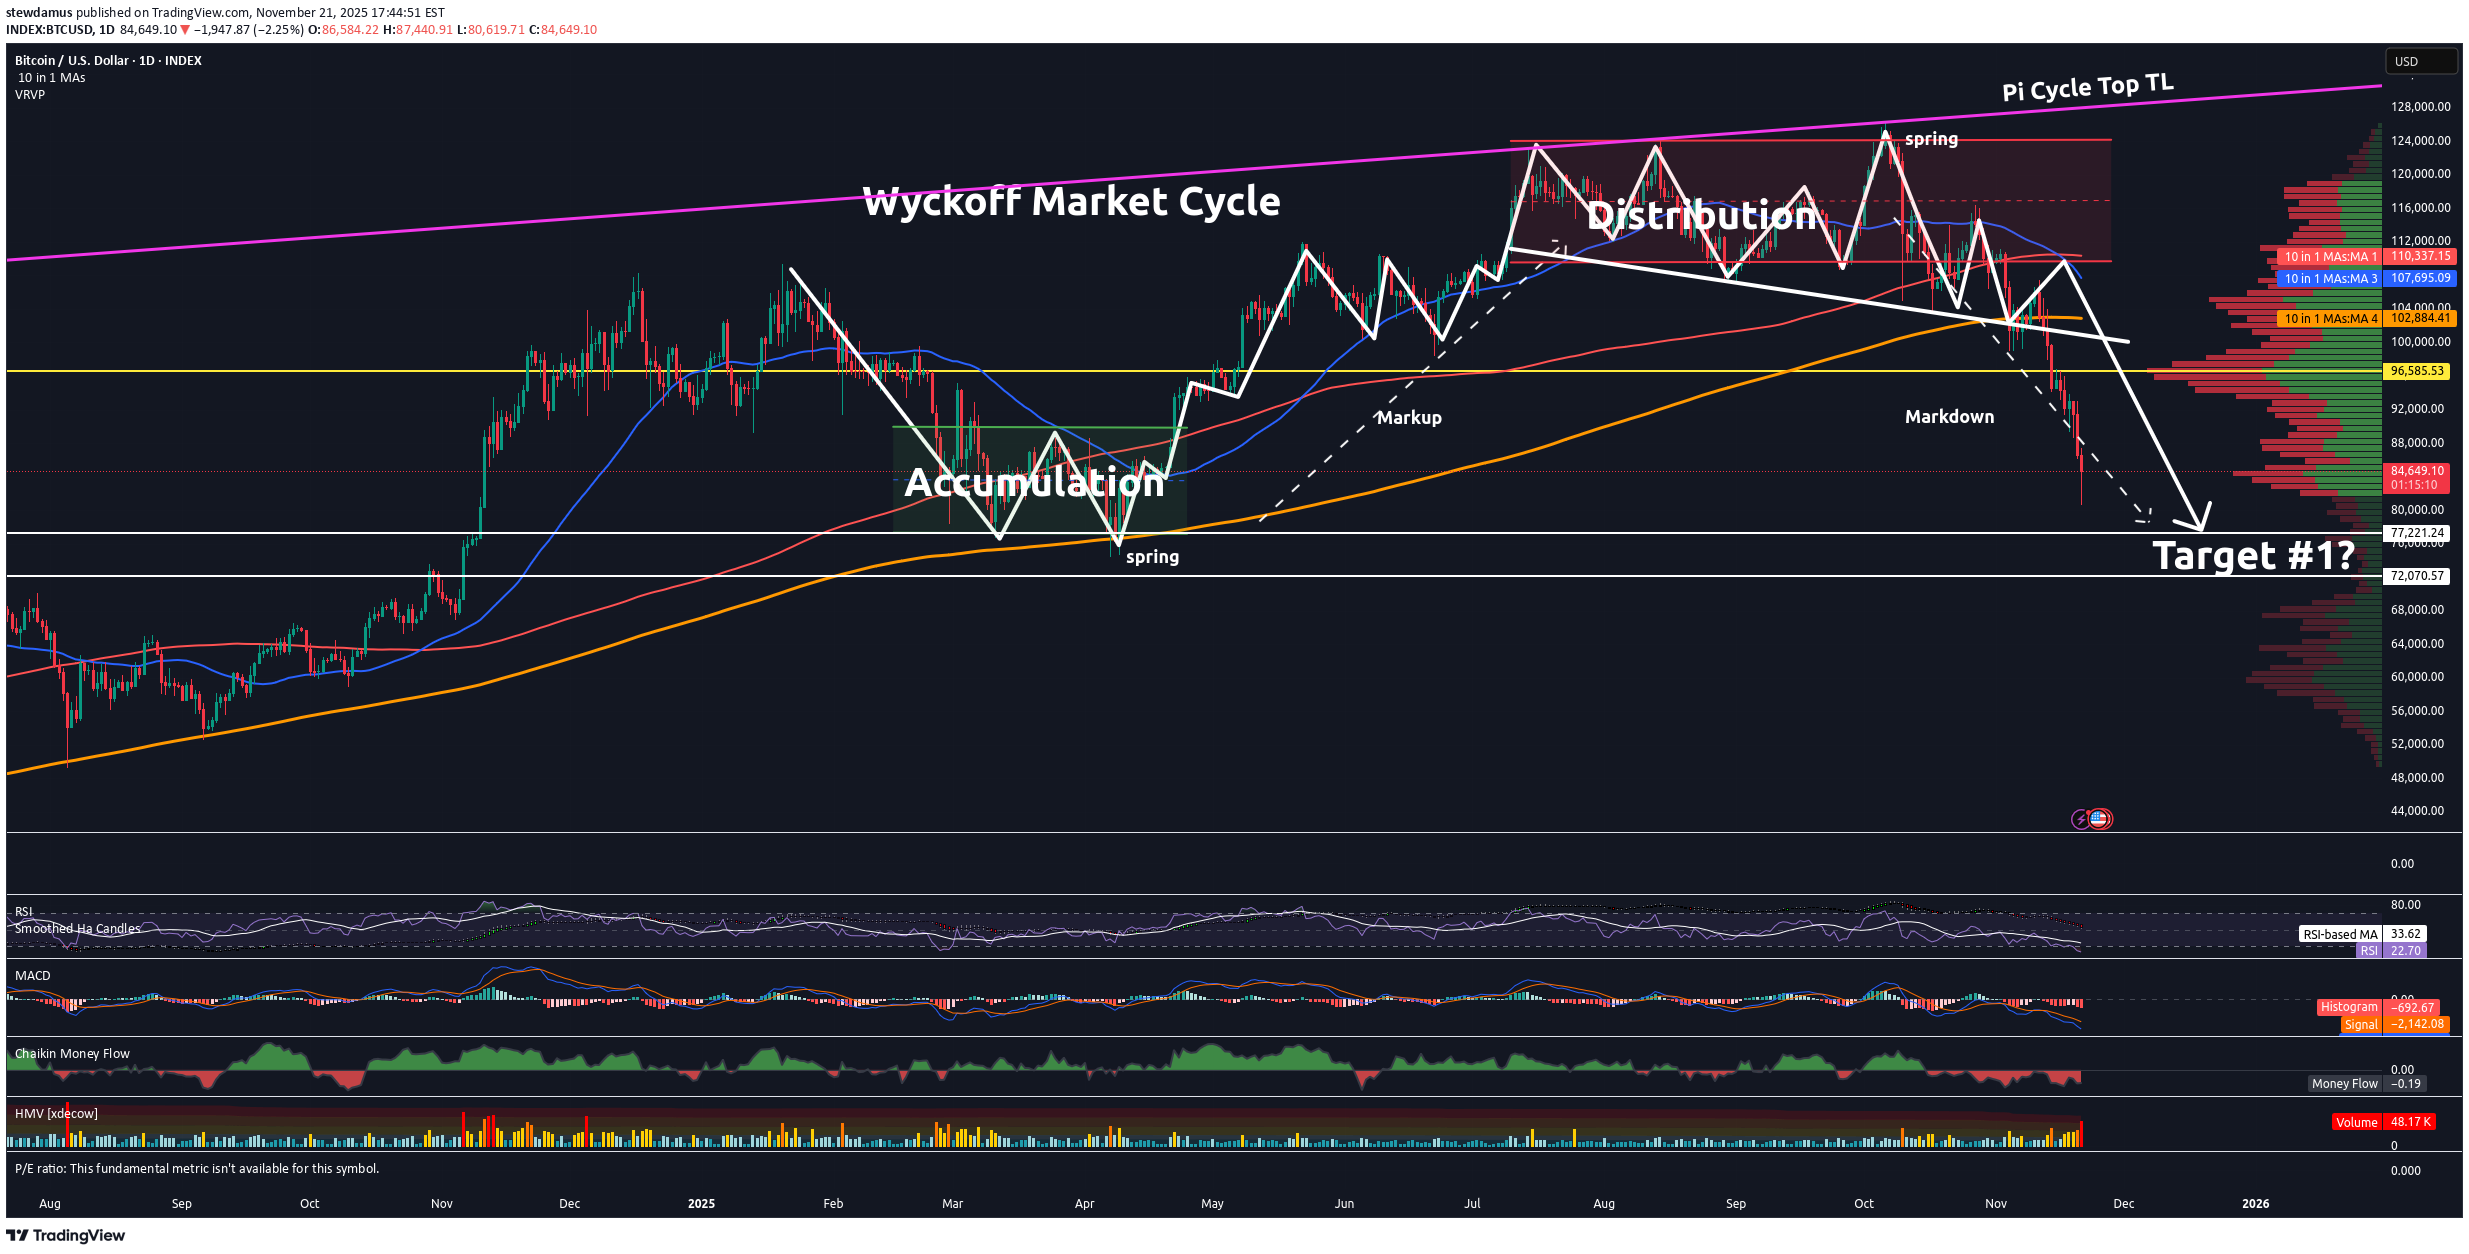
In the chart above, one can clearly recognize the Wyckoff Market Cycle pattern. The pattern legitimacy can be confirmed by volume. The volume is represented in the lower portion of the chart. Low to average volume candles are blue. Average volume is indicated by light blue candles. Yellow candles represent higher than average volume. Orange is high volume. And red, represent extremely high volume. You will see each phase of the Wyckoff Market Cycle pattern confirmed by this volume on our current Bitcoin chart. First, the market enters into the accumulation phase. Market volume is fairly high as seen in the accumulation quadrant in the lower left on the chart. However, it is important to note that there is an equal distribution of high volume selling days as there are high volume buying days. Thus, price tends to trend sideways within the channel until the true buying power comes into action. Next, the buyers step in and take price higher. This is generally indicated by a high volume day when price breaks above the accumulation channel. When buyers step in, most of the yellow and orange volume candles are, in fact, buyers in the markup phase. You can verify this is true by lining these high than average volume candles up with the green price candles on the Bitcoin chart. This indicates the markup phase has begun and is underway. Then, we come to the distribution phase on our chart. Notice the volume in that 3rd quadrant, the distribution quadrant. It is mostly average volume. Institutional sellers are attempting to carefully exit quietly. But you can also see that near the end of the distribution phase, sellers are starting to step in, tipping their hats and indicating that the distribution phase is about to end. Finally, sellers take back full control, dropping us from the distribution channel altogether. High volume selling confirms this move and the pattern. The final quadrant in the bottom right proves that mostly sellers have control as the majority of higher volume candles (yellow, orange, and red) are credited to the sellers. Our Wyckoff Market Cycle pattern is now confirmed and further selling can be expected until volume is once again taken back by the buyers. One will need to see clearly that high volume candles are in line with green price candles. In this chart, that is not yet the case. Thus, more selling should be expected until it is clearly evident that buyer command control once again. Hope you found this brief educational write-up informative and helpful as volume can often be utilized in many uncertain pattern formations to find pattern legitimacy and confirmation. ✌️Stew
بیت کوین تا ۱۰۰ هزار دلار صعود میکند، سپس چه بلایی سرش خواهد آمد؟ (تحلیل شوکهکننده)
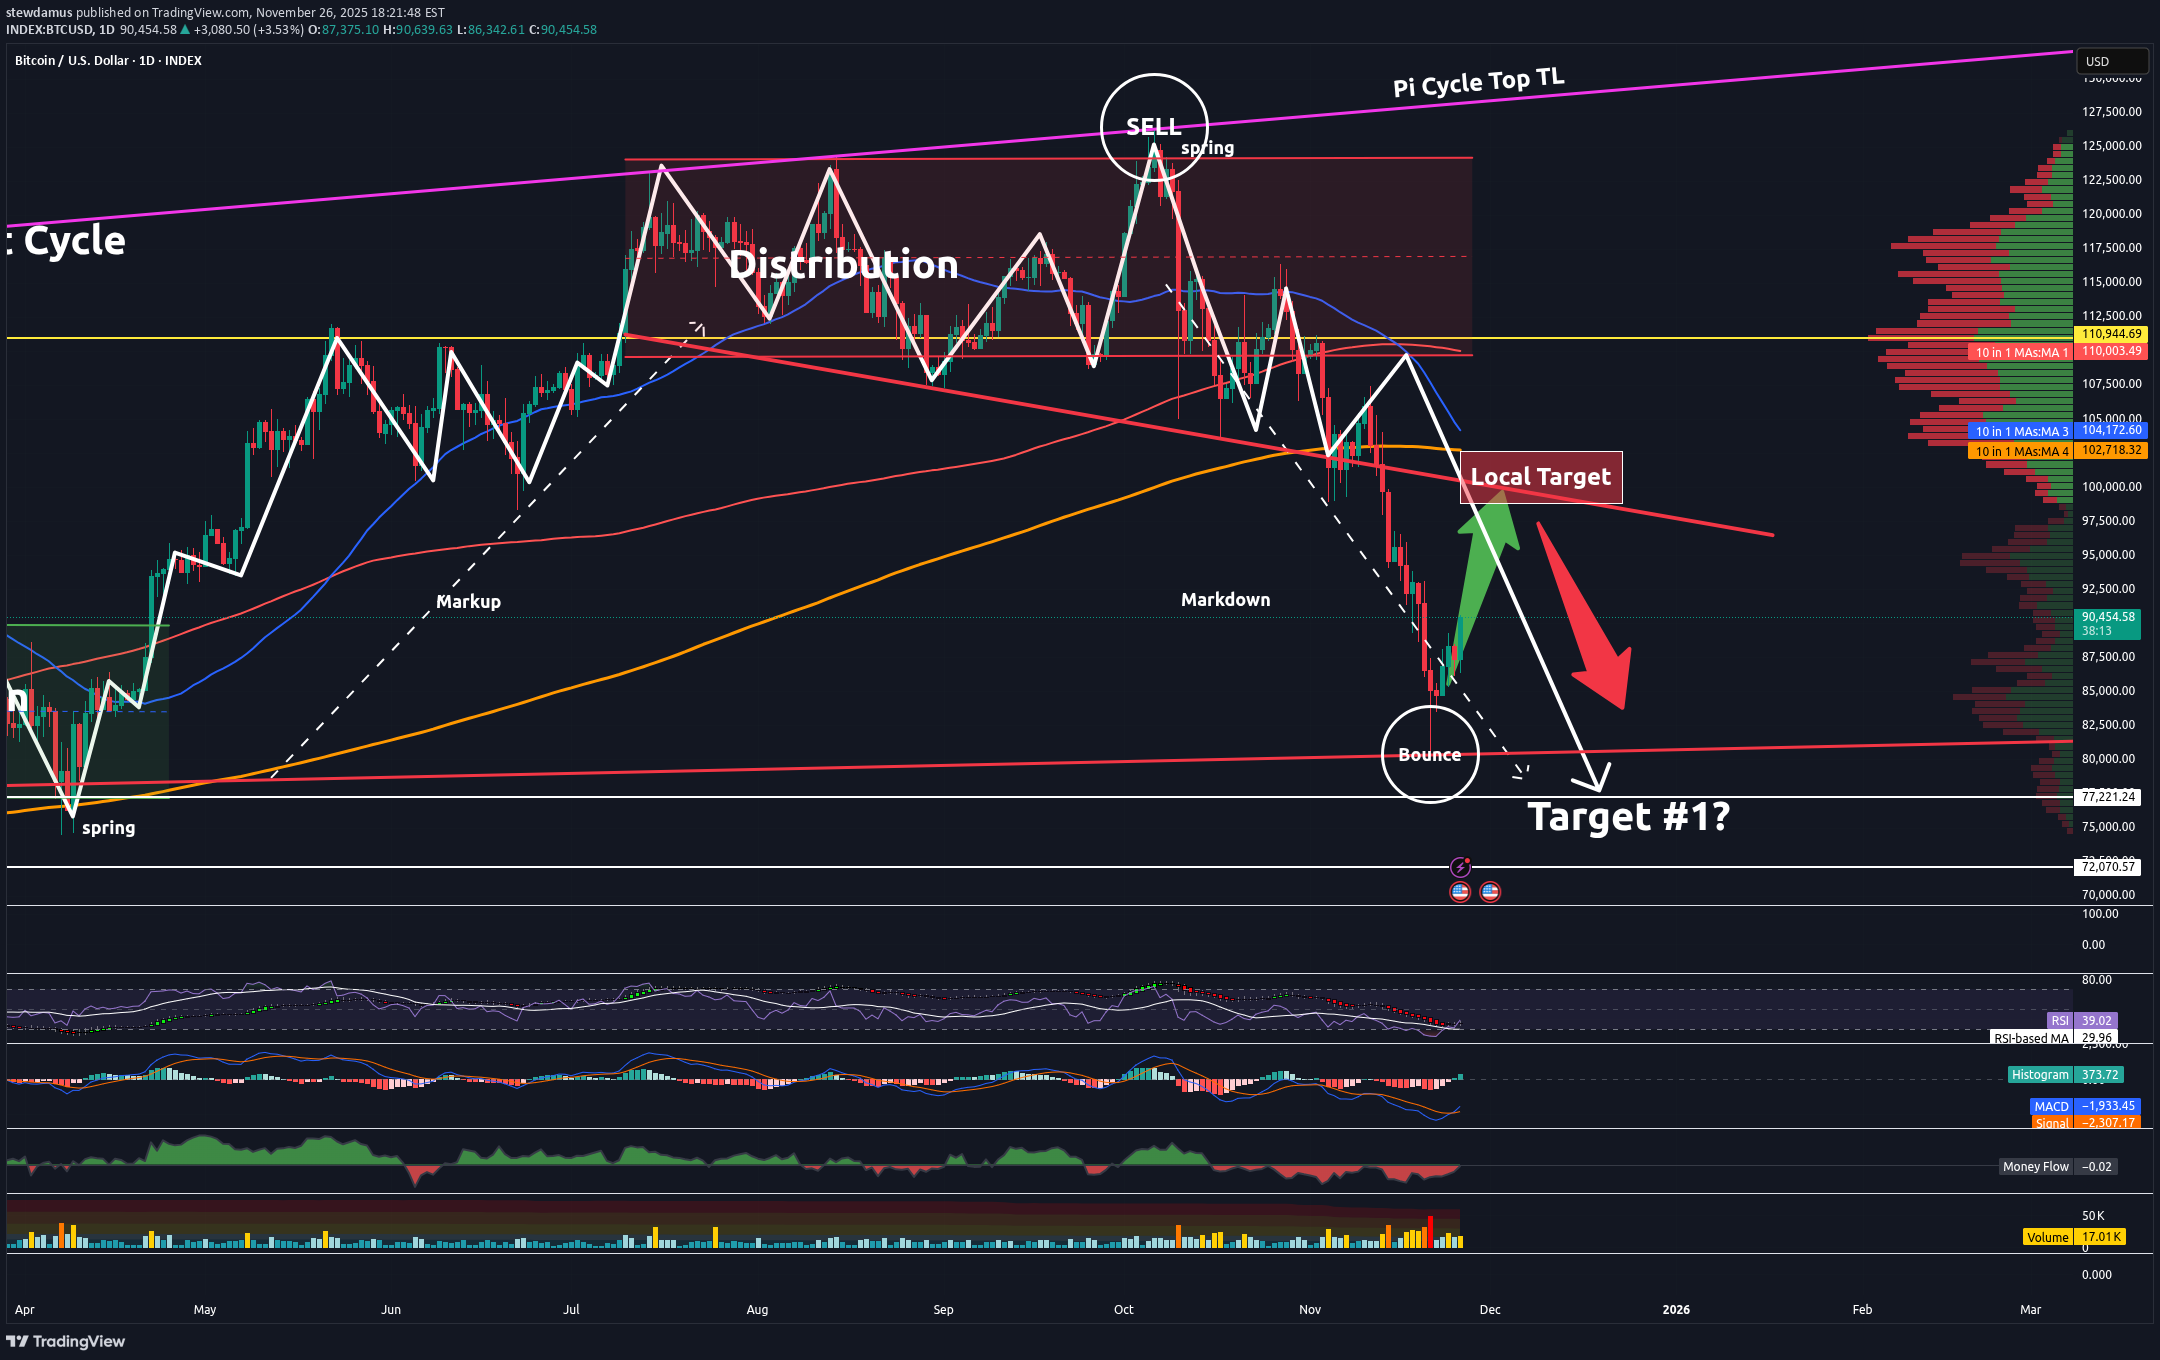
Trading Fam, First things first, Happy Thanksgiving to my U.S. followers. I hope your holiday is blessed as you enjoy time with friends and family. Let's get to the chart. As noted numerous times in previous posts, BTC is now in a longer-term bearish trend. There are many indicators that have shown us this. Our first signs came when my indicator flashed a rare sell signal This coincided with the third touch of our Pi Cycle Top Trendline It also formed what I thought at the time might be the "spring" of our Wyckoff Market Cycle pattern After these first three important indicators flashed, I waited for a drop below the support (RED descending TL) of our bearish megaphone pattern. That happened. Finally, we almost synchronized that drop with the drop below our 350 SMA I have a target down of 72-76k. We almost reached that but we were stopped by 80k support. That RED ascending TL prints on the weekly starting with one of our tops in April of 2021! We bounced off of this trendline, using it as strong support. It should be and I expected this bounce! Now, I am expecting we should go to at least 100-102k. Even that is a very underwhelming target. I will NOT be impressed at all if the bulls should succeed at hitting it. This, at least, should be expected! If we don't hit that target, I will be wrong about how bearish I should have been. Even the "Buy the Dip" Viagra being sold by all these whales as exit liquidity will not have worked for these bulls. What a disappointment they will have become! And my target of 72-76k will still be in play. But you can all see that I have a question mark there. See, the thing is, what happens when Michael Saylor's Microstrategy goes underwater? Microstrategy owns nearly 650k BTC at an avg cost of 74.5k. Current strategy is: issue shares → raise debt → buy BTC → repeat. If BTC falls below 74.5k it could become: buy back shares → lower debt → sell BTC → repeat. If this occurs, BTC could drop even further. My next serious support is not found until around 46k! Therefore, we have to keep a serious eye on this area of 72-76k if we do in fact visit it. Now, if bulls do beat 102k and then 110k after that, I think I can admit I was wrong. I missed my downside target by a whopping 4k! I will admit defeat even though I was a small fraction of a coin off. Honestly, I hope I am wrong. I hope the market is revived and Santa gives you all the profit you ever wanted for the Christmas season. But the grinch in me thinks not. So, play this rally as you like. Personally, I think it's an early gift to some of you who were not expecting this or just didn't believe it would occur. You now have your second chance to exit. This is a contrarian view. I know. But think about who might be propagating the "Buy the Dip" memes. I alluded to it above. If I were a whale and wanted to exit without crashing the market how would I best do this? Ding, ding, ding. That's right. I'd market the hell out of "Buy the Dip". It would become the meme of the hour. Retail would buy it up and hopefully provide the exit liquidity I need. This might be my only way out if I were looking for it. Something to think about. ✌️Stew
آخرین سیگنالها: بیت کوین به کجا میرود؟ آیا این پایان ریزش است؟
سیگنال خرید سولانا: ترید مطمئن با ریسک کم و سود 32 درصدی!
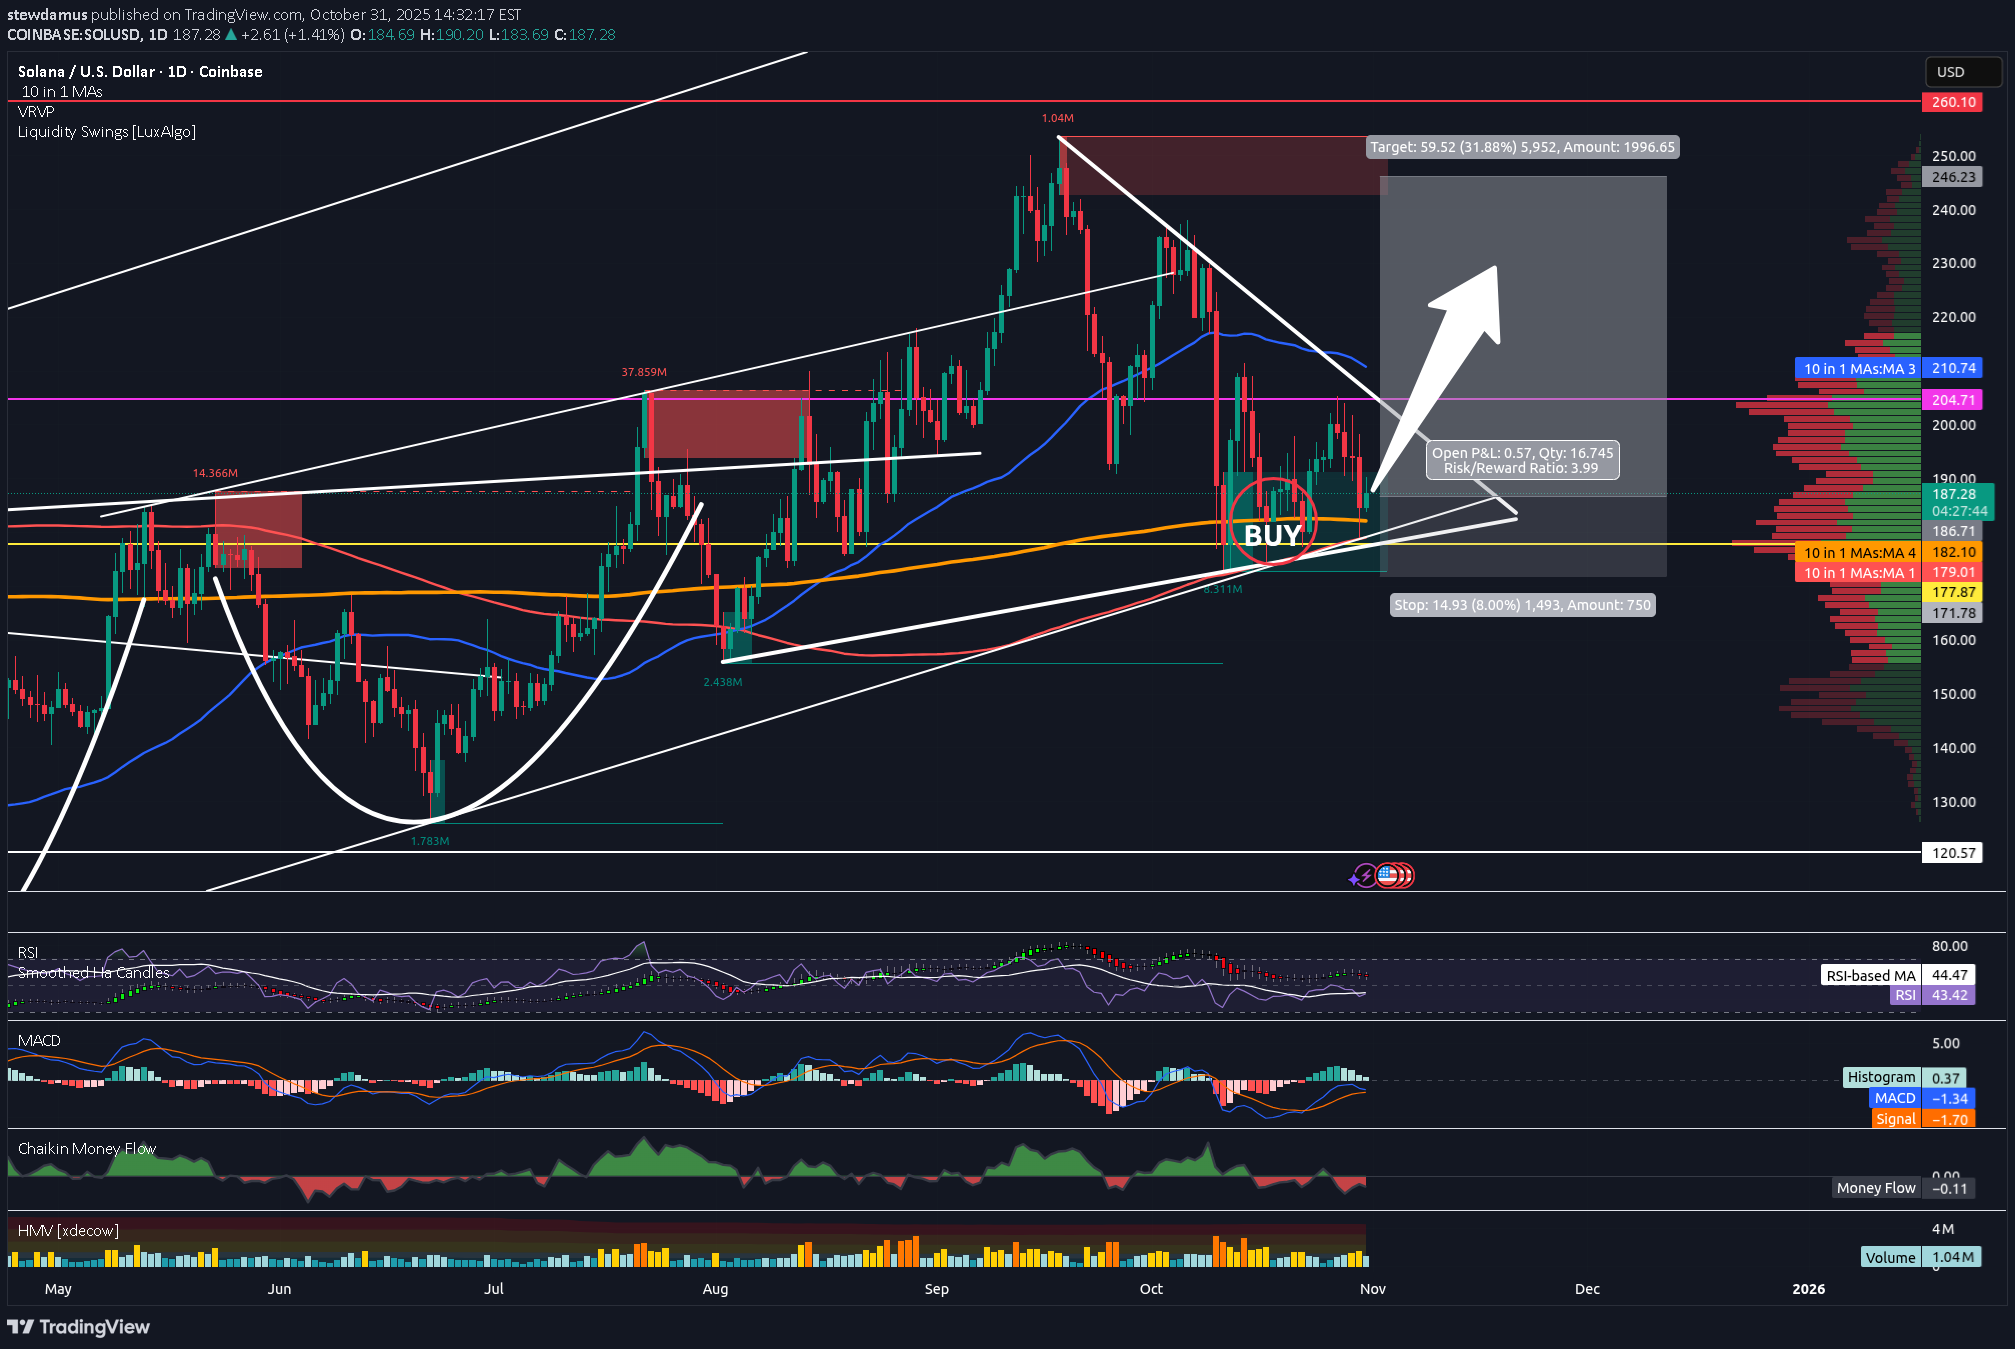
Trading Fam, Received a buy signal from my indicator on Solana the other day. Inside a nice liquidity block, above the 200/350 SMA, and inside a bullish triangle. I'll easily take this trade all day. But with the crypto market continually disappointing, I am not going to risk more than an 8% loss here. Shooting for a target of around 32% profits brings my rrr to a 1:4. Best of luck! ✌️Stew
اولین فروش استراتژی جدید تسلا: آیا این اندیکیتور روی نزول هم کار میکند؟
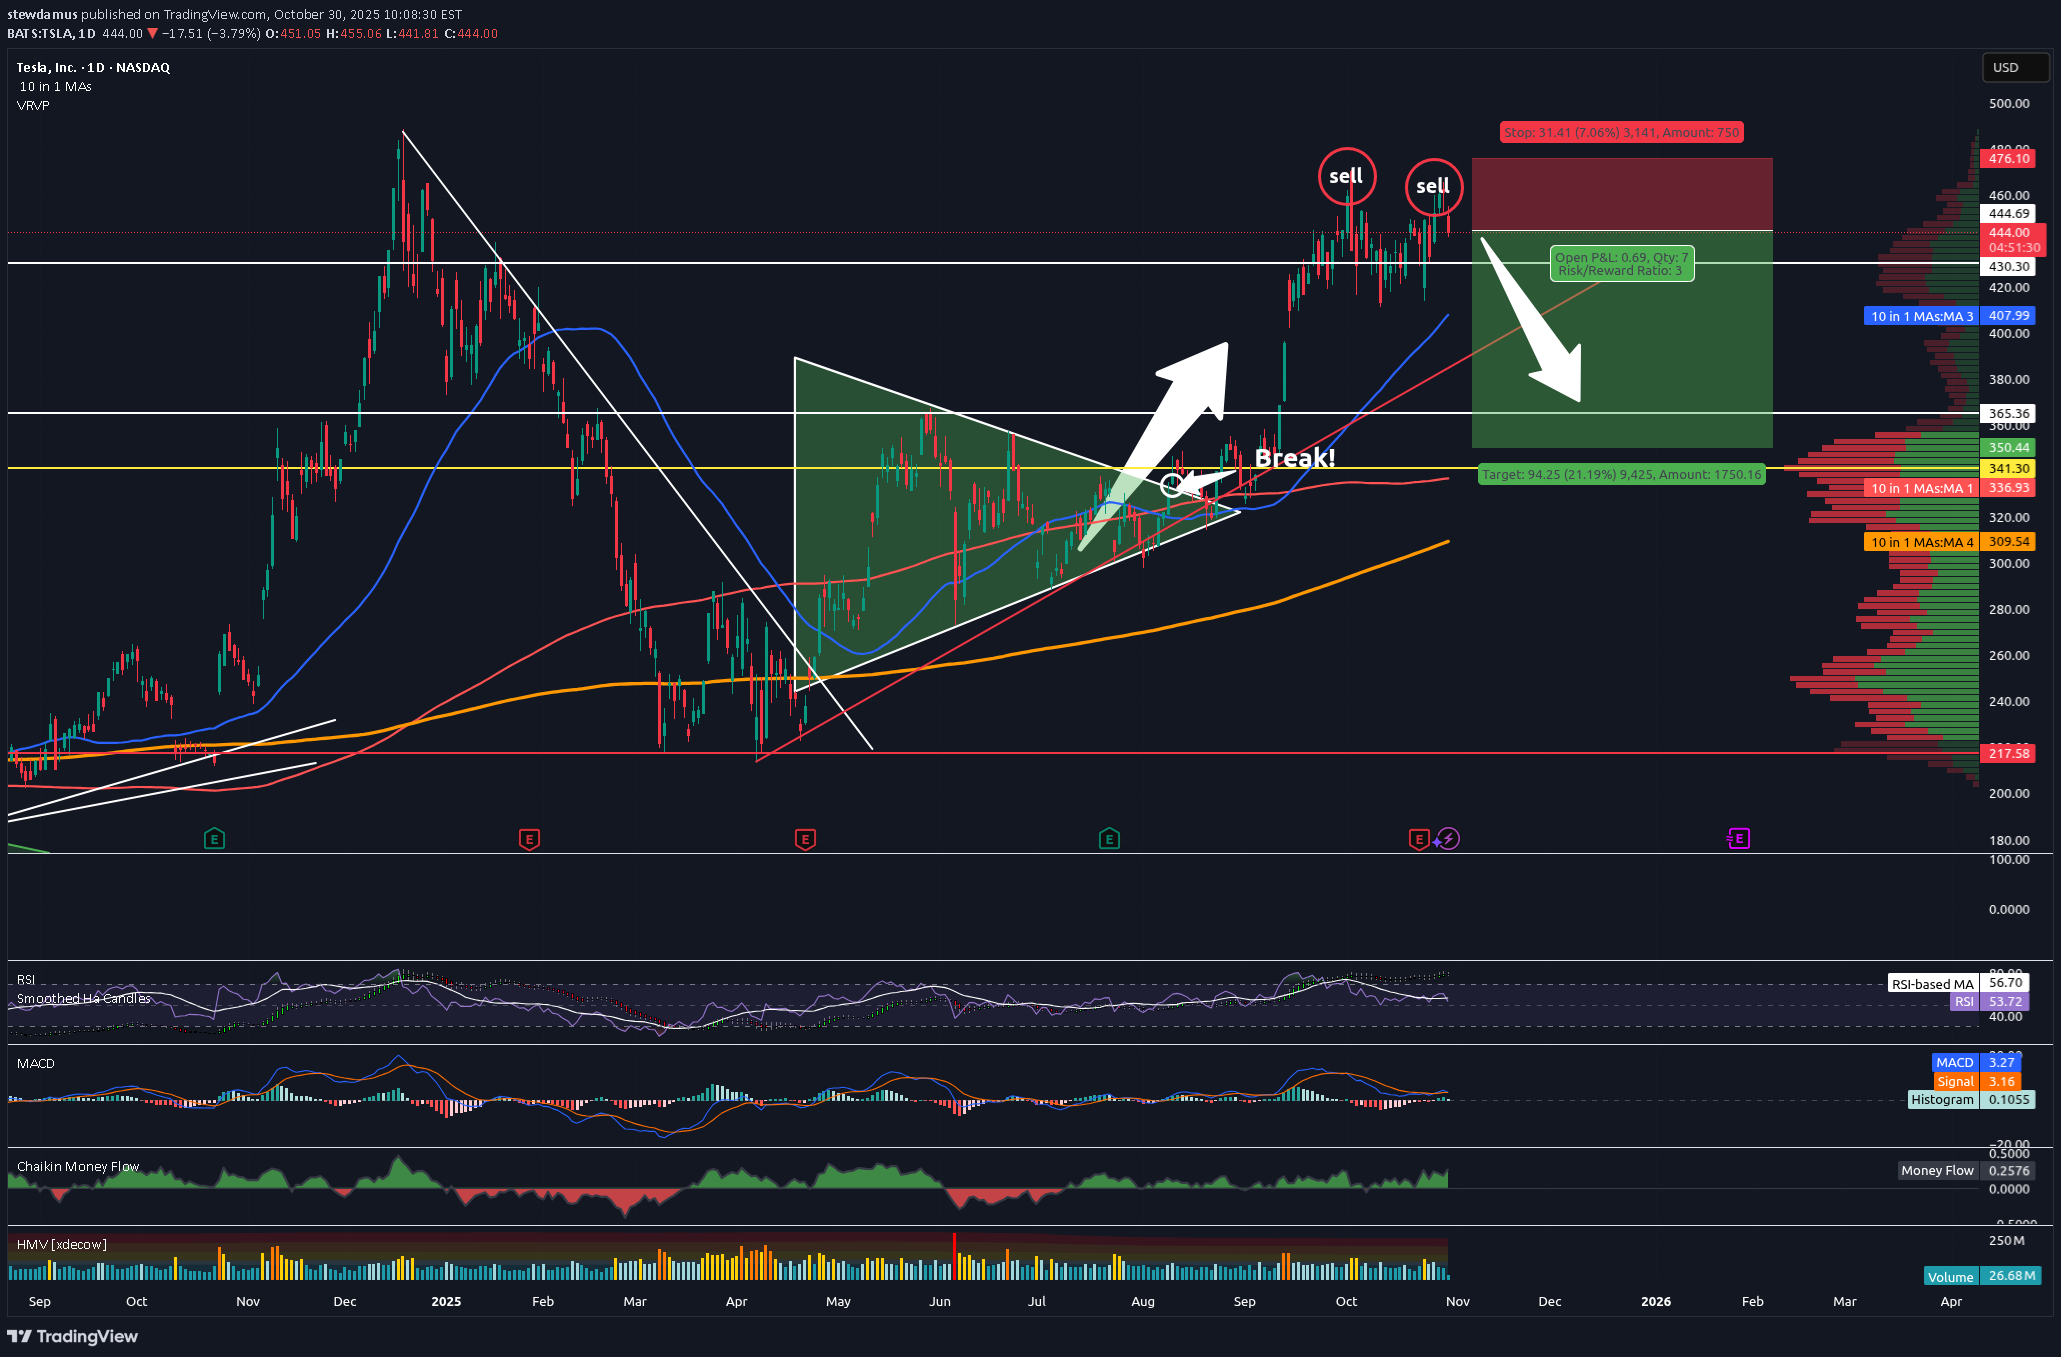
Trading Fam, I'm taking my first ever short here since implementing my new indicator. It has been killing it on the long side. We've exited our last 17 trades, all for wins, with an average profit of 30% per trade and our portfolio is up over 86% on the year. Now, it's time to test the short signals. We received two here on TSLA. I've taken a small entry since this is my first short, representing around 9% of the portfolio total. I'm going to target $350 but will not take more than a 7% loss, thus my stops are set at $476 bring the rrr on this trade entry to 1:3. Let's see how this goes. ✌️Stew10% profit now. Will be looking to exit half and trail stops soon.Good Morning Trading Fam, We are about halfway to my final target. I sold half of my position exactly at the trendline outlined in this chart ($185), lowered my stops to break-even, and will let the rest ride, trailing stops as we go.
نصف سود آمازون محقق شد: استراتژی جدید، سود تضمین شده و رکورد ۱۴ برد متوالی!
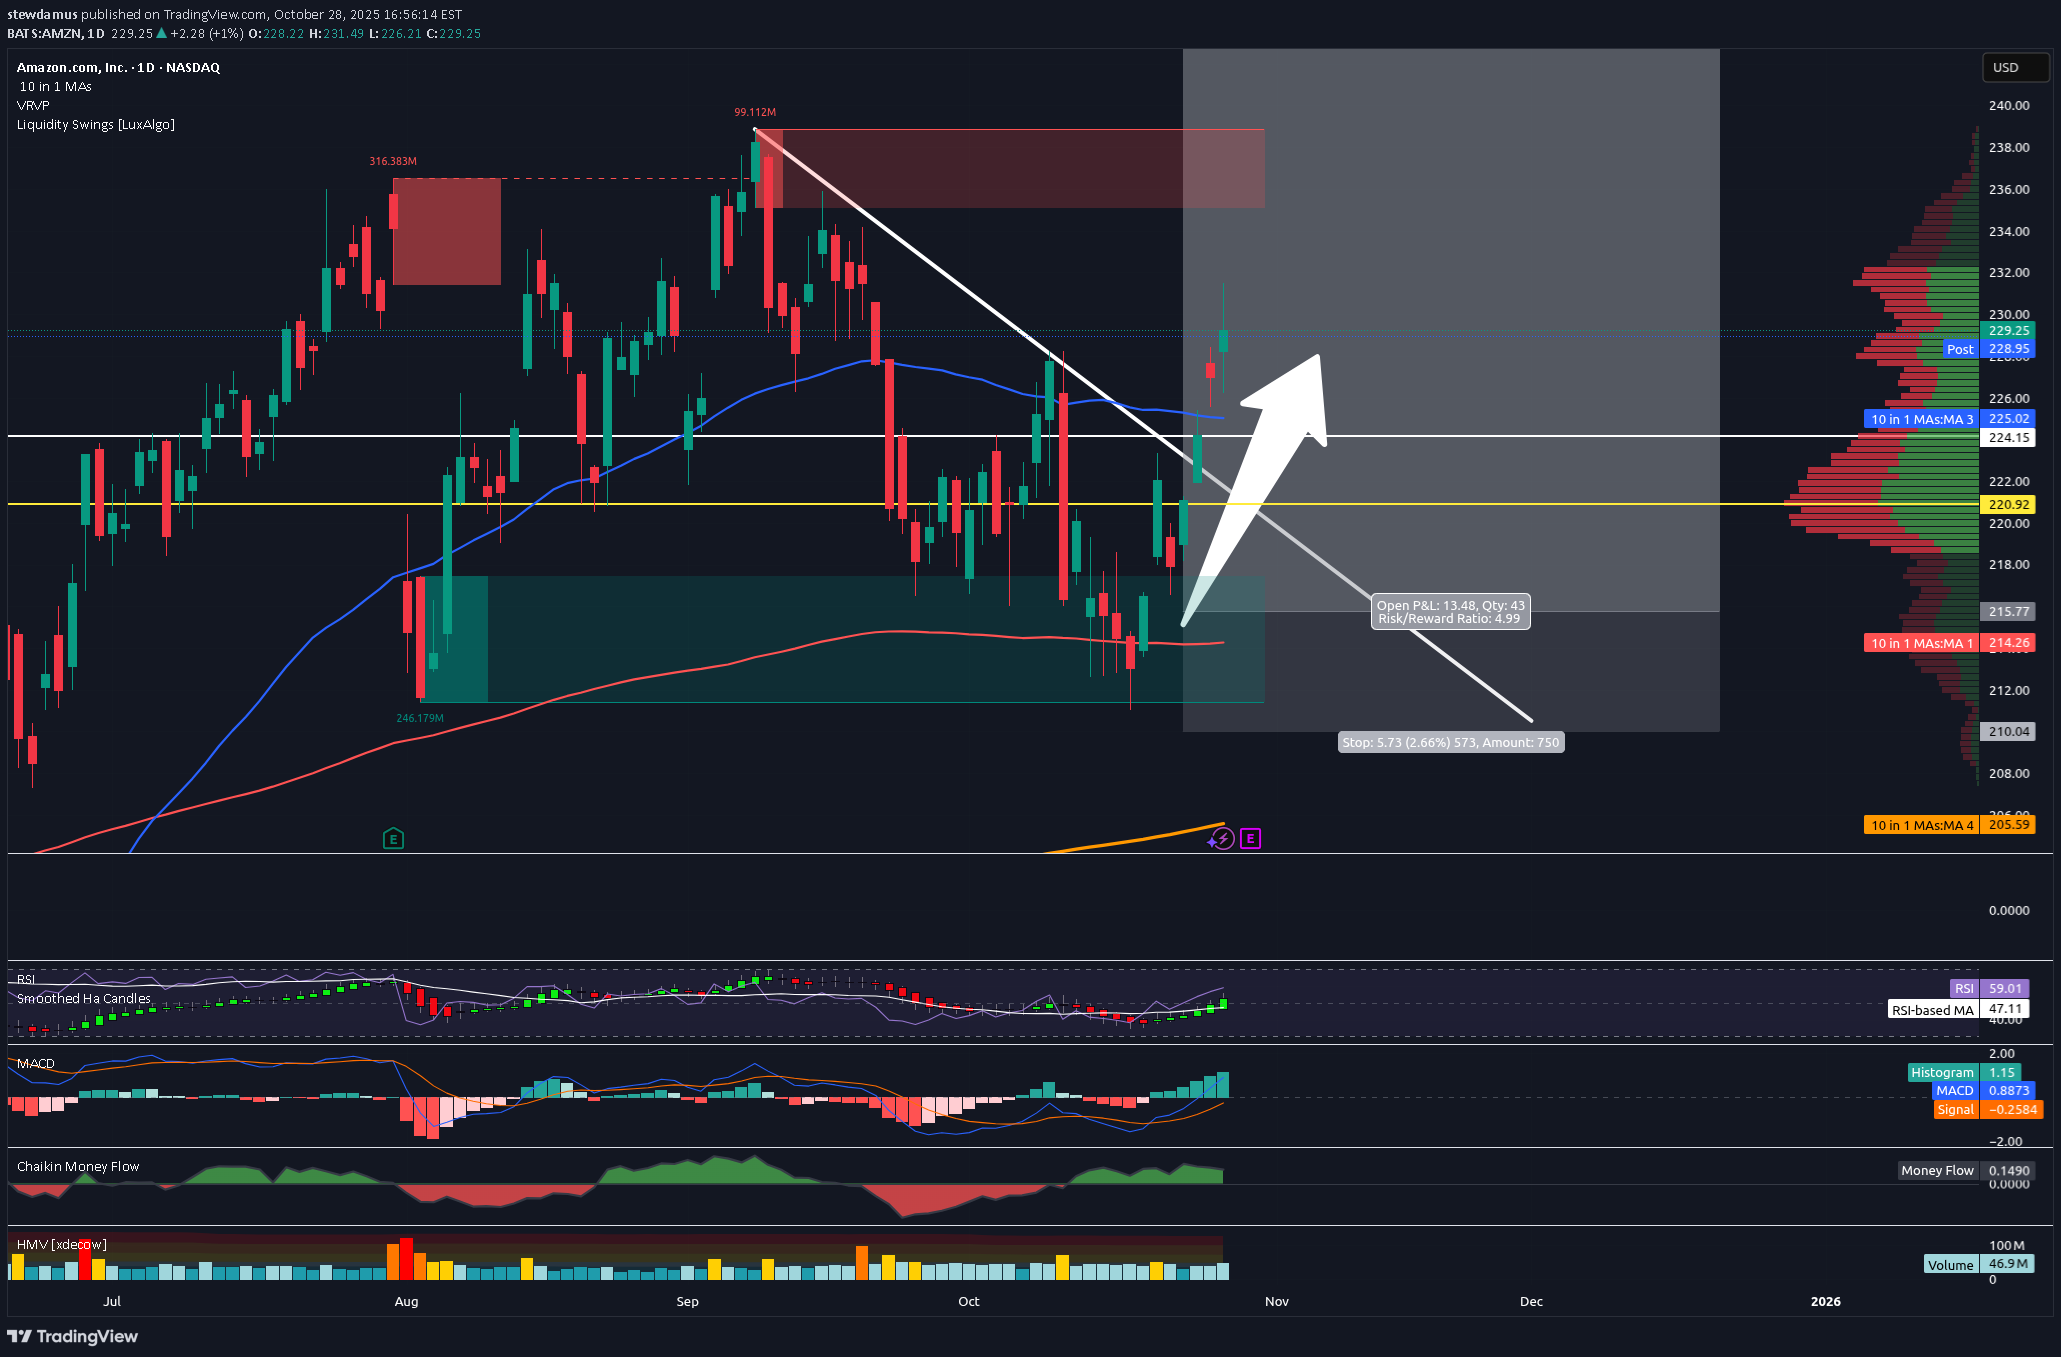
Trading Fam, We are halfway to my final target. I've been trading safe lately. So, I decided to sell half here, capture some profit, and raise my stops to $225, ensuring we're all in the money on this trade. Congrats to those who followed me. We are 14 wins for the last 14 trades with an avg. of 33% profit per trade. Since implementing my new indicator just over a year ago, I continue to improve trade accuracy with each trade. Experience is growing and so are our wallets. Our portfolio is up 69% since we started with the indicator! Those are incredible stats for any trader, nevermind someone like me who just learned how to trade liquidity! You guys know where to find me and all of my trades. 100% free to all of my followers. ✌️StewRaised stops. Sold all in profit.
سیگنال خرید قوی بیت کوین: آیا ترون (TRX) به زودی سقف جدیدی را میبیند؟
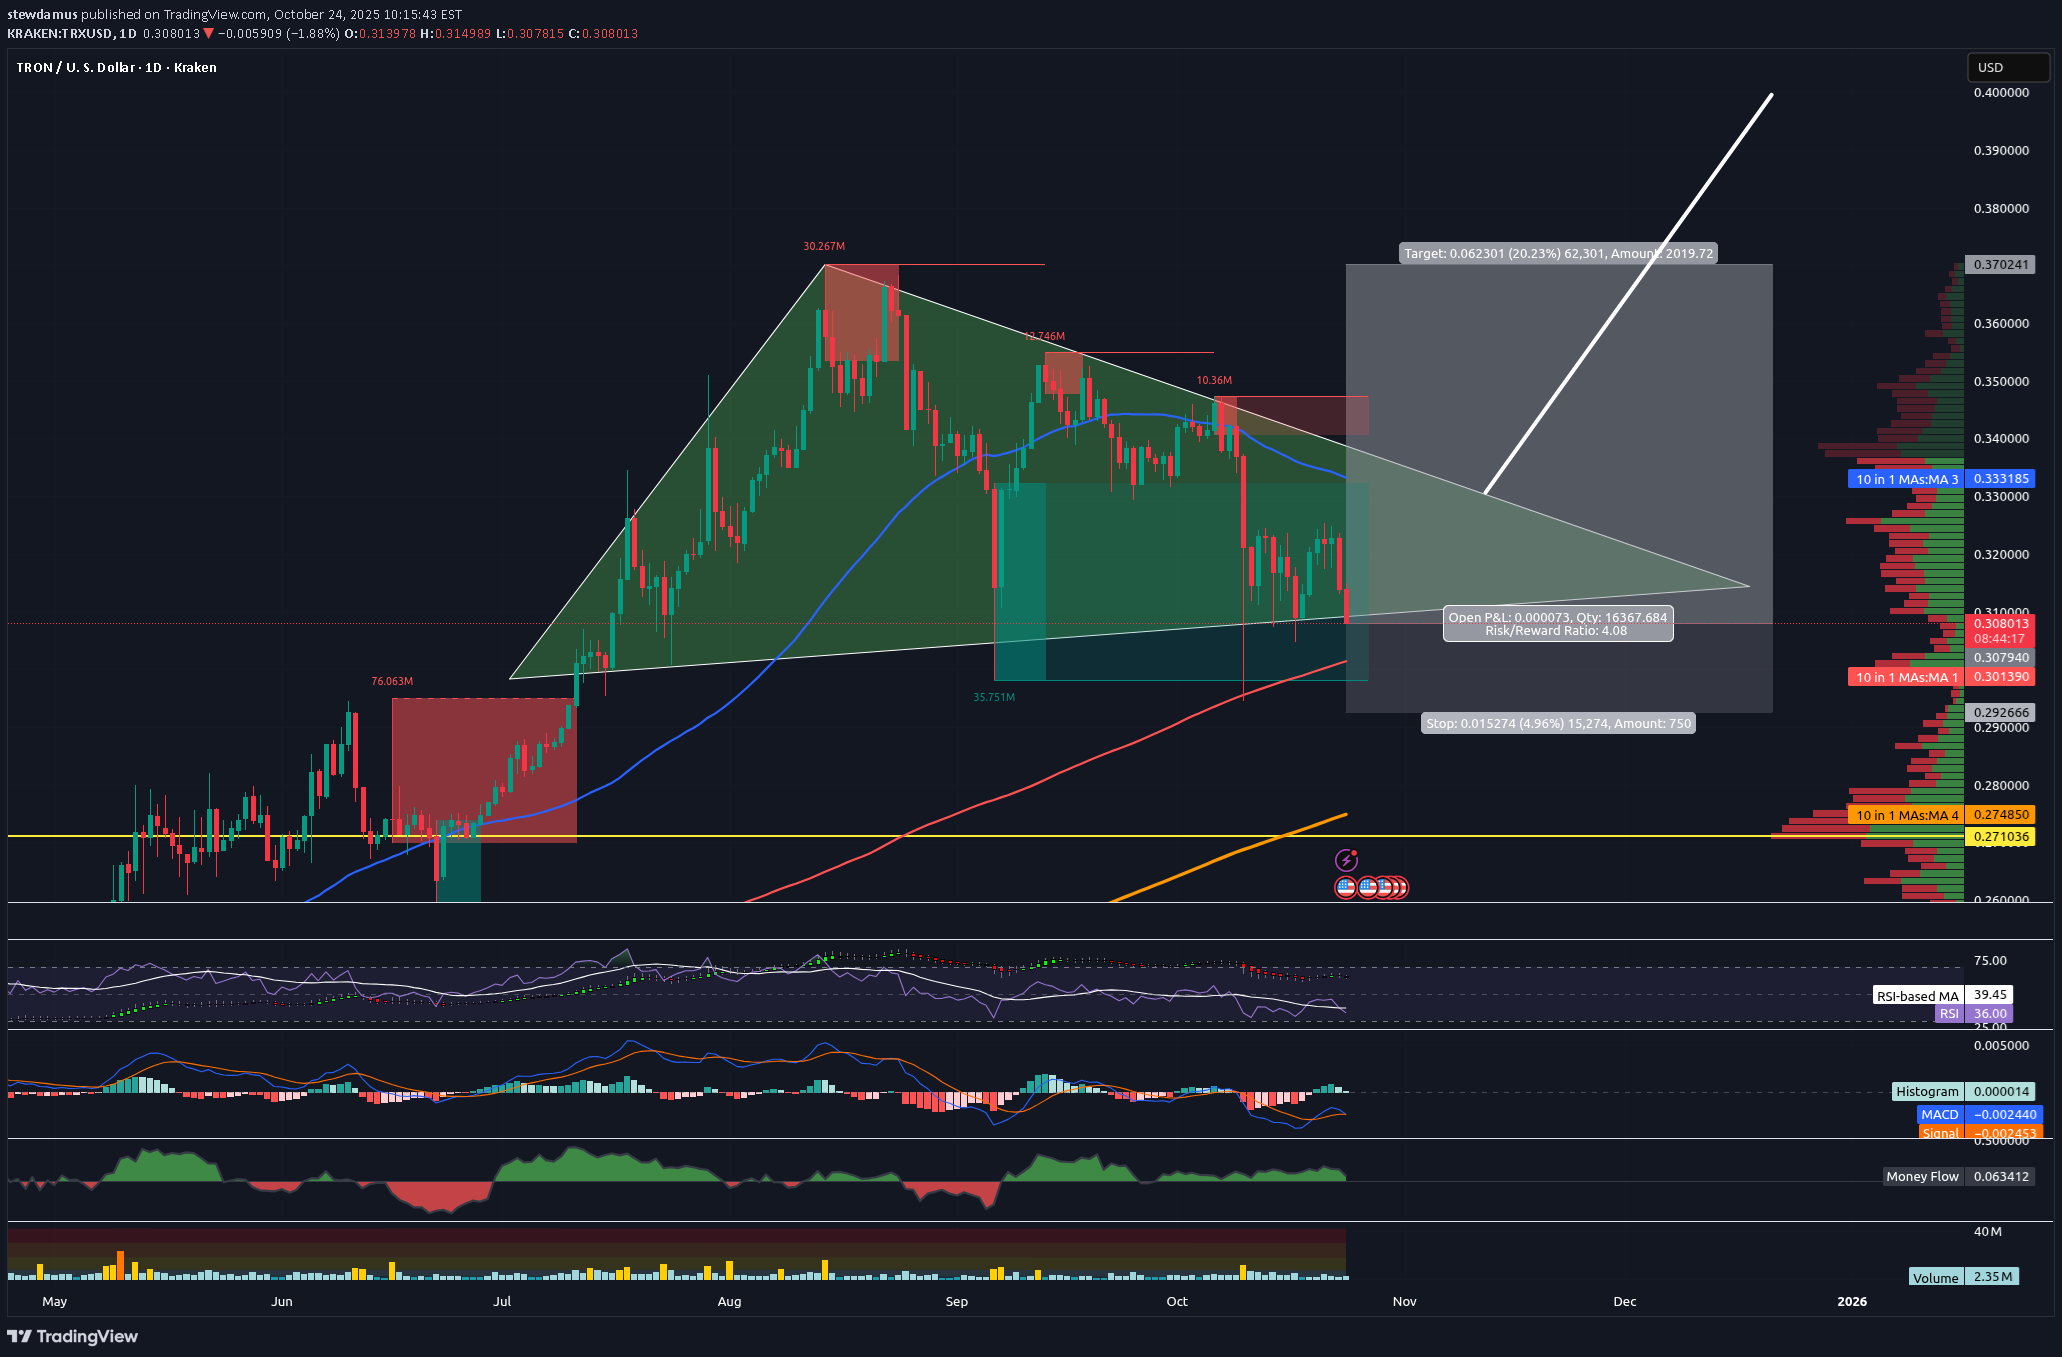
Trading Fam, A rare buy signal was given a few days ago by my indicator. Tron is one of the few altcoins that remains above the 350 SMA, while at the same time, BTC.D is currently below the 350 SMA. Additionally, you can see that Tron is testing the bottom side of our triangle. I am expecting a bounce from here to go back up to the top. If we break, I have my target set at .37, though we could go as high as .40 cents with a breakout. You can see we are in a large buy-side liquidity block, meaning there are a lot of institutional buyer at this level. Finally, you can see that red 200 dma, which will also help support price should we get that low. All this being said, this is a higher risk trade since most alts are obviously in a local downtrend. Therefore, I am not willing to take more than a 5% loss on the trade. ✌️Stew
رمزگشایی نمودار بیت کوین: آیا وایکوف بازگشته و زنگ خطر سقف قیمتی به صدا درآمده است؟
Hey Trading Fam, As the Donald keeps the market gambling and scrambling, I want to step away from the headlines a bit and take a closer look at what our charts might be suggesting. Admittedly, the bias indicated may be somewhat contrarian at the moment. If you're not into that, this video is probably not for you. It feels like an echo chamber out there with most analysts. Everyone keeps yelling, "Buy the dip! Buy the dip!" But what about a more cautious approach? Maybe it was time to sell the top and preserve your cash? I don't know. Just throwing it out there. As many of you are aware, we've reached my third and final target on the SPY. I've been talking about 670-700 on the SPY for a couple of years now. It's been hit, and personally (though I am cautiously still trading publicly), I've exited. My goal is to preserve my cash. Maybe I do this through precious metals? Haven't decided yet. But I am happy with the profit I've made to this point and will probably not test fate too much further. As for crypto, old Bitcoin usually follows our stock market. And we have tracked the SPY for that part. If the market does, in fact, pull back further, I would expect Bitcoin and all of crypto to follow. I know, I know. But what about that altcoin season? I don't know guys. That may not actually start until next year. I'm not saying this will be the case for sure. But more and more, it sure is looking that way. Enjoy the vid, ✌️Stew
آیا آقای وایکوف واقعاً برگشته است؟ غافلگیری بزرگ بازار!
Just a question folks. Don't shoot the messenger. Mr. Wyckoff loves to surprise the market. When they least expect it, he'll jump out and scare the hell out of everyone. ✌️Stew
Disclaimer
Any content and materials included in Sahmeto's website and official communication channels are a compilation of personal opinions and analyses and are not binding. They do not constitute any recommendation for buying, selling, entering or exiting the stock market and cryptocurrency market. Also, all news and analyses included in the website and channels are merely republished information from official and unofficial domestic and foreign sources, and it is obvious that users of the said content are responsible for following up and ensuring the authenticity and accuracy of the materials. Therefore, while disclaiming responsibility, it is declared that the responsibility for any decision-making, action, and potential profit and loss in the capital market and cryptocurrency market lies with the trader.