
sorooshx
@t_sorooshx

What symbols does the trader recommend buying?
Purchase History
پیام های تریدر
Filter
اتریوم در 3000 دلار گیر کرده؟ نقشه بعدی برای رسیدن به 4000 دلار چیست؟
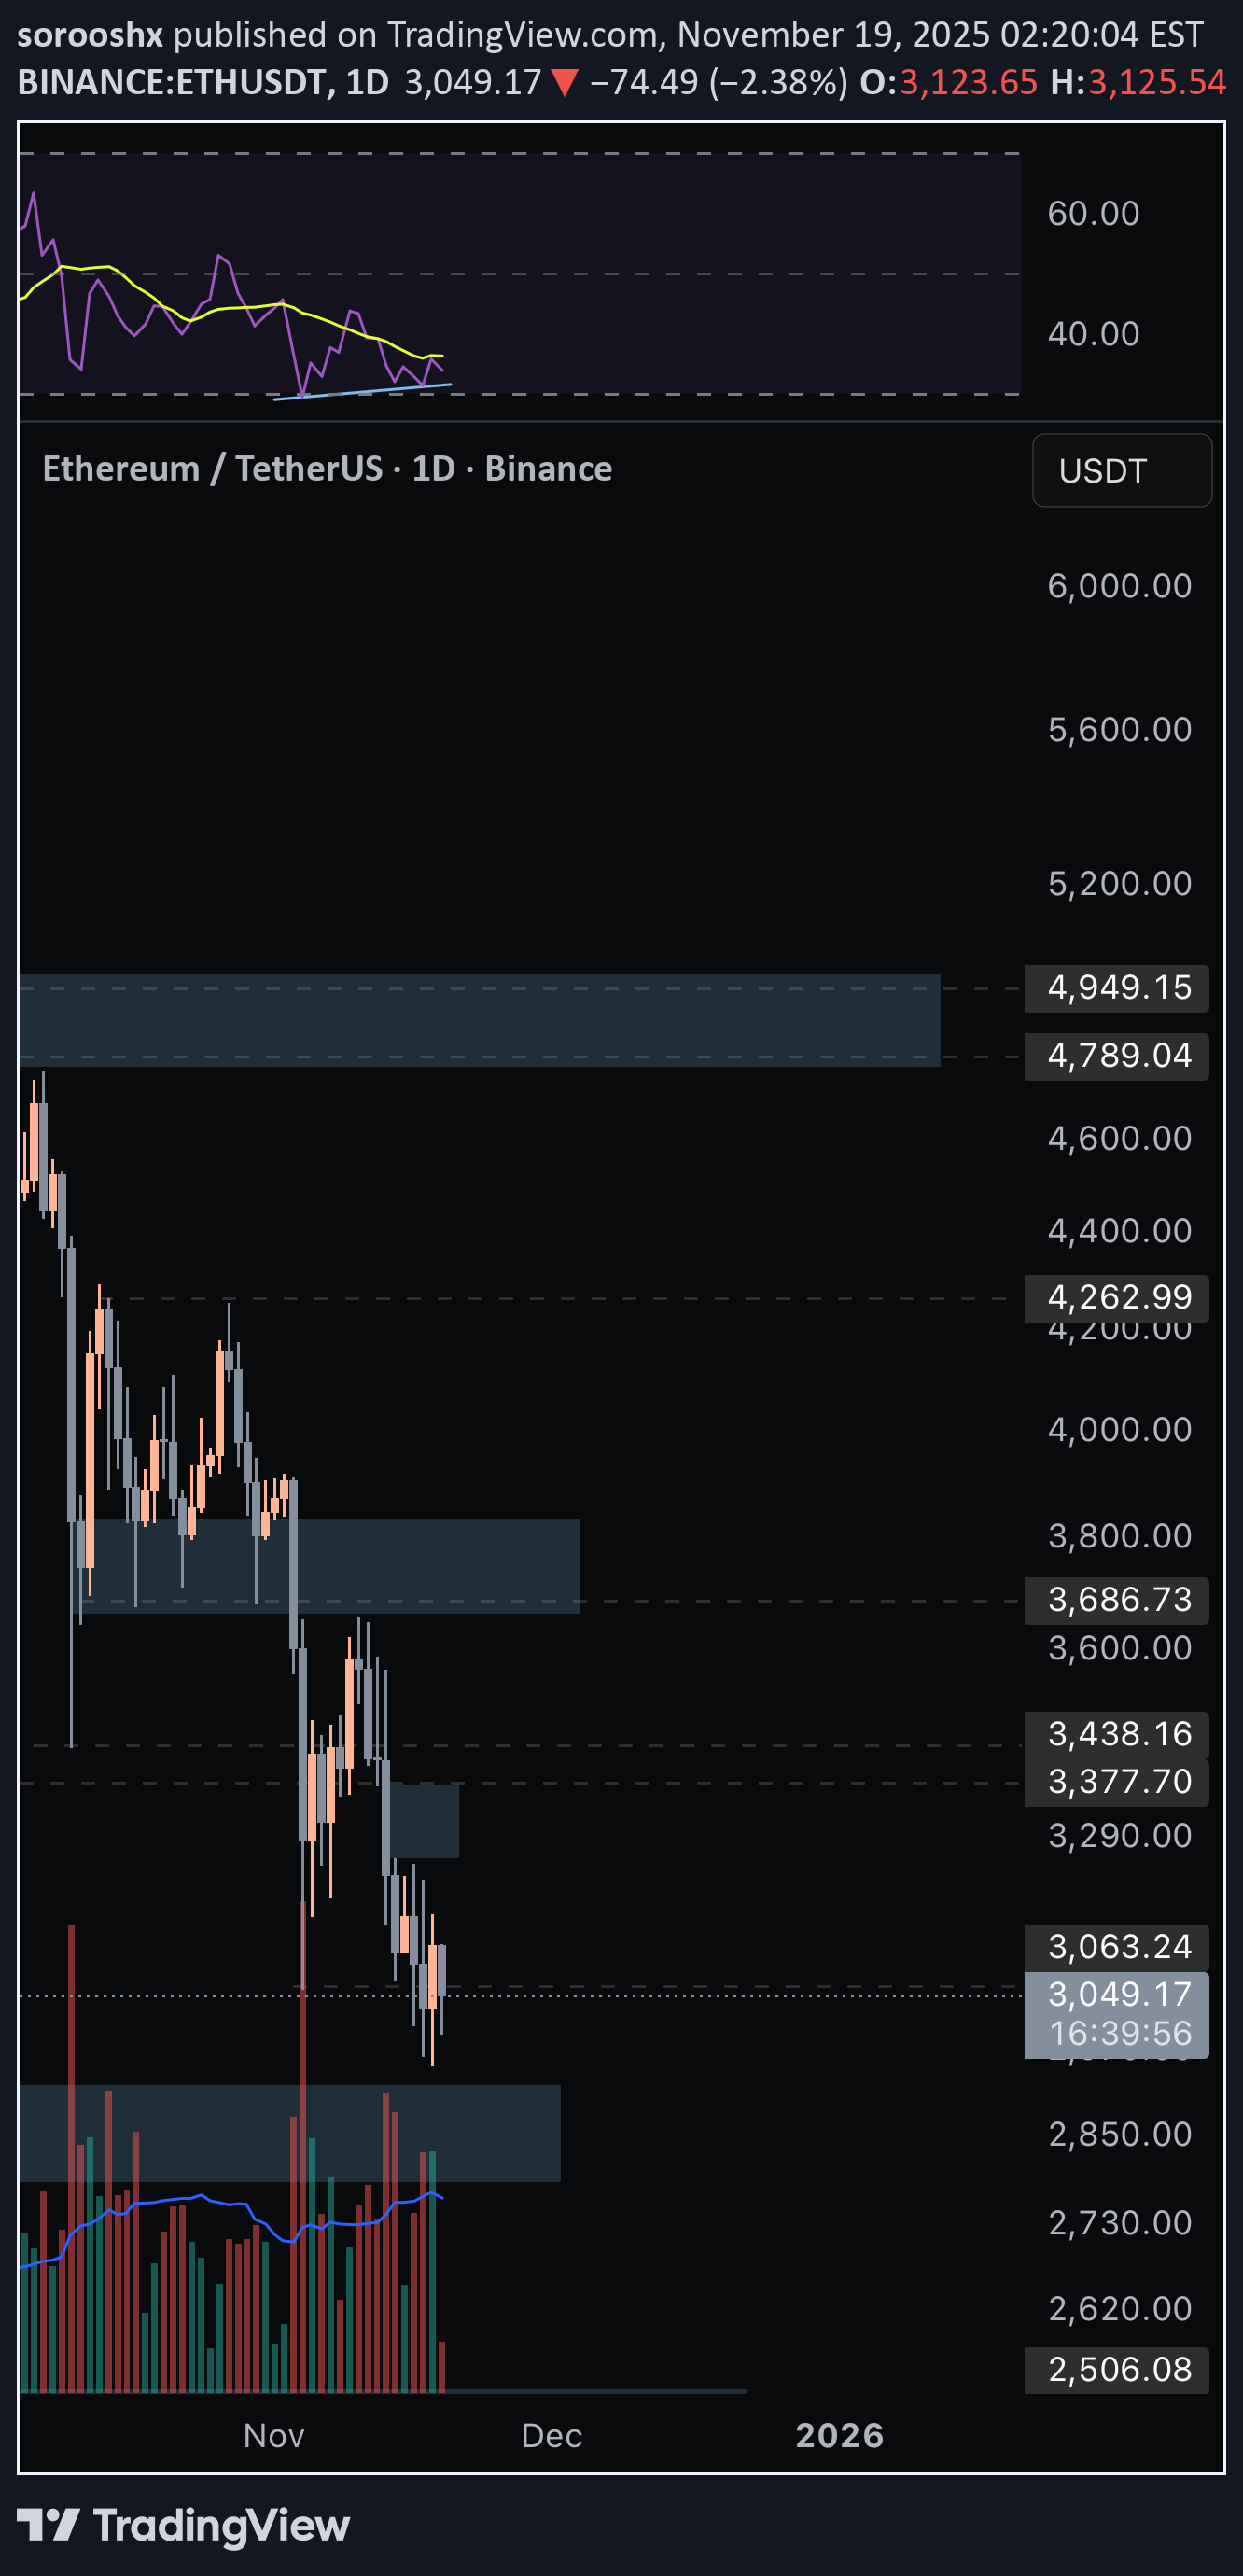
ETH accumulating around $3K? Spot on it’s coiling at ~$3,100 (up 3.44% short-term, per latest feeds), building steam after the recent dip. Next resistance retest at $3,400 makes sense: that’s the broken support-turned-resistance from early Nov, aligning with the 50-day MA and Fib 0.5 extension. Break it, and we’re eyeing $3,850–$3,900 by month-end (Fusaka upgrade hype + ETF inflows fueling the push). Whale zones at $2,800–$2,400? Bullish af—matches on-chain data where big players scooped $1.37B during the $3,331 breakdown (June highs echoed in Nov buys like Tom Lee’s $63.6M stack today). Wintermute’s loading millions amid the dump, signaling reversal vibes (last time = massive pump). If $2,800 holds (key Fib 0.618 + demand zone), that’s your dip-buy floor before $4K+. Mildly bullish here (70/30 odds on upside) RSI resetting from oversold, HAR dipping but whales countering retail sells. Load on #SorooshX signals if it tests $2,800. Your play? 😎 #ETH #Crypto
تحلیل جامع LINK: مقاومتها، سیگنال نهنگها و آینده قیمت تا سقف ۵۵ دلار!

Price: $16.61 Up 0.81% (24h) after testing $16.96 resistance. Technical Analysis: Supports: $16.00, $15.50 Resistance: $17.00, $18.00 RSI: 46.75 (daily, neutral) MACD: -0.19 (daily, sell) EMAs: Below 50-day ($17.00), above 200-day ($15.00) Bollinger: Near mid-band ($16.50) LINK/BTC Chart Analysis: Ratio: 0.000248 Supports: 0.000240, 0.000230 Resistance: 0.000260, 0.000270 RSI: 50 (daily, neutral) MACD: Neutral, slight bearish divergence Patterns: Symmetrical triangle forming (October 1–18) Head and Shoulders potential (daily, bearish) Bullish Engulfing: October 15 Plot on TradingView for visualization. On-Chain Analysis: MVRV: Neutral, fair valuation Exchange Reserves: Stable, moderate selling Whale Activity: 4,624 large transactions, 73% surge in accumulation Coin Days Destroyed: Moderate, profit-taking Glassnode Funding Rate: Neutral on CEXs (SorooshX/OKX perpetual futures ~0.01%, balanced leverage) Fundamental News: Macro: Fed rate cuts Q4 2025, easing inflation Regulatory: S&P Global partners with Chainlink for on-chain stablecoin assessments Institutional: Franklin Templeton, DTCC, Euroclear adopt Chainlink for tokenized assets Social Sentiment: 450K+ #LINK mentions on X 60% bullish (S&P partnership, whale accumulation, $55 target predictions) Trend & Chart Patterns: Symmetrical Triangle: Forming (October 1–18) Head and Shoulders: Potential bearish reversal on daily Bullish Engulfing: October 15 Trend: Neutral short-term, breakout risk both ways Long-term: $20–$55 (2026) Buy/Sell Signal: Hold (55% confidence) Rationale: Neutral RSI/MACD and funding rates suggest consolidation; whale accumulation and partnerships support upside, but Head and Shoulders risks pullback. Hold or buy on dips: $16.00 or $15.50 Stop-loss: <$15.50 Target: $18.00 short-term, $55 (Q4 2026) Disclaimer: Research before investing. #LINK
HYPE Analysis - September 25, 2025, 06:45 PM EDT

Hey guys, I am going to chart #HYPEUSDT today... Price: $35.04 Down 23.08% (7d) after pullback from $45 ATH. Technical Analysis: Supports: $33, $30 Resistance: $40, $45 RSI: 42 (daily, sell) MACD: Bearish, histogram narrowing EMAs: Below 20-day ($40), above 50-day ($35) Bollinger: Near lower band ($34) HYPE/BTC Chart Analysis: Ratio: 0.0000005 Supports: 0.00000045, 0.0000004 Resistance: 0.00000055, 0.0000006 RSI: 45 (daily, sell) MACD: Bearish, histogram contracting Patterns: Retest of channel support (September 18–25) Bearish Engulfing: September 20 Doji: September 19 On-Chain Analysis: MVRV: Neutral, slight undervaluation Exchange Reserves: Stable, moderate selling Whale Activity: $100M accumulation (weekly) Coin Days Destroyed: Moderate, profit-taking Glassnode Funding Rate: Negative on CEXs (SorooshX/OKX perpetual futures -0.005%, favoring shorts; indicates caution) Fundamental News: Macro: Fed rate cut signals Q4 2025 Regulatory: CFTC comments on DeFi frameworks Institutional: $29B daily volume on Hyperliquid (August 2025) Social Sentiment: 300K+ #HYPE mentions on X 50% bullish (ATH pullback debates, adoption focus) Trend & Chart Patterns: Channel Retest: Support at $33 (September 18–25) Bearish Engulfing: September 20 Doji: September 19 Trend: Bearish short-term, rebound if $33 holds Long-term: $55–$68 - $88 - $100 (2026) Buy/Sell Signal: Hold (50% confidence) Rationale: Bearish RSI/MACD, negative funding rates, and pullback from ATH suggest caution. On-chain accumulation and volume support rebound. Risks: Further dip if $33 breaks. Hold or buy on dips: $33 or $30 Stop-loss: <$30 Target: $40 short-term, $58 - $68 (Q1 2026) Disclaimer: Research before investing. #HYPE
BTC Analysis - August 20, 2025, 09:28 AM EDT

📊 Price: ~$114,016, consolidating after failing $120,000 resistance (24h). Technical Analysis: • Supports: $112,300, $108,000 • Resistance: $116,800, $120,000 • RSI: 46 (daily, neutral), 50 (4-hour) • MACD: Bearish, histogram narrowing • EMAs: Below 20-day ($117,300), above 50/200-day ($115K/$110K) • Bollinger: Near mid-band ($115,400, daily) Patterns: • Ascending Channel: Retest of mid-channel ($114K–$115K, August 15–20) • Bearish Pinbar: August 14 • Doji: August 19 On-Chain: • MVRV Z-score: 2.2, neutral, nearing rally trigger • Active Addresses: Up 3% (30d) • CDD: Low, strong HODLing • LTH Supply: 74% held >155 days • STH Supply: Down 13% (30d), profit-taking Fundamentals: • M2: $107T (Feb 2025), 3.8% growth, 0.94 correlation with BTC • ETFs: $15B inflows (2025), $0.8B weekly (August 15) • Regulatory: GENIUS Act supports crypto (July 2025) BTC Reserve: Exchange reserves down 10% (2025), low selling pressure. Dominance: 61% (BTC.D), neutral, altseason if <63.2%. Social Sentiment: 450K #BTC mentions on X, 55% bullish ( low volatility, dip-buying). Trends: Neutral short-term, possible dip to $112,300. Long-term: $130K–$200K (2026). Signal: Buy (60% confidence) • Buy on dips: $112,300 or $108,000 • Stop-loss: <$108,000 • Target: $116,800 short-term, $130,000 (Q4 2025) Disclaimer: Research before investing. #BTC
Sei (SEI) Market Update – June 2, 2025

📈 Current Price: $0.194424h Change: +0.43%SEI shows modest bullish momentum but still faces resistance.📊 Technical Overview• Range: $0.1892 – $0.1963• Support: $0.19 – $0.20• Resistance: $0.21 – $0.22• Trend: Bearish – testing upside potential- Interesting Entries : 0.19 - 0.17 , 0.1450 - 0.13🔗 On-Chain Metrics• Transactions: 3B+ 📊• Wallets: 24M+ users 👥• ⚠️Unlock: 219.7M SEI (4.12%) in 14 days – watch supply pressure🧭 Fundamentals• High-performance Layer 1 built for DeFi & HFT• SEI used for gas, staking, governance & collateral• Market Cap: ~$1.03B | FDV: ~$1.93B📈 Forecast• Short-Term: $0.19 – $0.21• Mid-Term: $0.21 – $0.25• Long-Term: $0.25 – $0.30 🚀✅ SummarySEI is showing early signs of recovery. Despite overall bearish trend, strong fundamentals and massive on-chain adoption suggest long-term upside. Key level to watch: $0.21.Smart Crypto Exchange and WEB3 SocialFi platform : sorooshx.com
Cardano (ADA) Market Update – May 30, 2025

Current Price: $0.699824h Change: -5.06%ADA shows bearish momentum, testing key support levels.📊 Technical Overview• Range: $0.6985 – $0.7423• Support: $0.64 – $0.70• Resistance: $0.82 – $0.85• Trend: Bearish — downward pressure continues🔗 On-Chain Insights• Whales Bought: 180M ADA recently 📈• Stablecoin Market Cap: $30.1M (+30% in Q1)• Avg. TX Fee: $0.29 (+27%) — network demand rising🧭 Fundamentals• $1.1B treasury & active governance• Ouroboros upgrades incoming 🚀• New ID partnership in Europe for real-world use cases📈 Forecast• Short-Term: $0.64 – $0.70 (support under test)• Mid-Term: $0.82 – $0.85 (possible breakout)• Long-Term: $1.00 – $1.30 (if momentum returns)✅ SummaryADA faces short-term pressure but remains fundamentally strong. Whale activity, DeFi growth, and major protocol upgrades support a long-term bullish outlook. Watch support at $0.70 closely!#SorooshX , Follow automatic signals by creators on SorooshX mobile App
Bitcoin Market Update – May 26, 2025

📅 Bitcoin Market Update – May 26, 2025🚀 BTC Price: $110,157 (+2.95% 24h)Bitcoin continues its upward trend, showing strong momentum and bullish sentiment across the market.📊 Technical Snapshot:• Range: $106,801 – $110,157• Support: $107K – $108K• Resistance: $111K – $112K• Trend: Bullish🔗 On-Chain Metrics:• Short Squeeze Pressure: Rising on Binance• ETF Inflows: $934M → Strong institutional interest• Sentiment: Extreme Greed (Index 78)🧭 Fundamentals:• Major ETF inflows show growing trust from big players.• Market sentiment remains highly optimistic.📈 Forecasts:• Short-Term: $110K – $112K• Mid-Term: $112K – $125K• Long-Term: Up to $140K (depending on macro conditions)Keep an eye on 103k and 97k supporting levels as liquidity zones.✅ Summary:BTC remains bullish with key resistance at $112K.A breakout could open room for further upside. Stay tuned and manage risk wisely.#Bitcoin #BTC #Crypto #SorooshX
Bitcoin (BTC) Market Update – May 19, 2025

📅 Bitcoin (BTC) Market Update – May 19, 2025BTC is trading at $105,488 with a slight +0.0115% 24h uptick.📊 Technical Snapshot:• Price Range: $102,381 – $106,540 (Moderate volatility)• Support: 97K – $98.5K | Resistance: $110K – $115K• Trend: Consolidation Phase – Awaiting breakout🔗 On-Chain Highlights:• 87% of supply in profit = Potential for sell pressure• Accumulation increasing across wallet cohorts• Improved investor sentiment🧭 Fundamentals to Watch:• Sharpe Ratio: 1.72 – High risk-adjusted returns• ETF inflows rising = Institutional demand• Macro Index flashing Buy signal📈 BTC Price Outlook:• Short-Term: $100K – $110K• Mid-Term: $110K – $129K• Long-Term: $174K – $462K 🚀✅ Summary:Bitcoin remains range-bound but shows strength in accumulation and fundamentals. Keep an eye on $110K resistance for a possible breakout.#Bitcoin #BTC #CryptoAnalysis #SorooshX
Technical Analysis: Ethereum (ETH) — April 30, 2025

📊 OutlookEthereum is trading in a tight range with slight upward momentum. Current RSI is neutral, and price remains above the 50-day SMA, hinting at a sustained bullish trend. The Fear & Greed Index supports this positive sentiment. A break above $2,000 could confirm bullish continuation, while a drop below $1,700 may shift sentiment to bearish.📌 Analyst Note: Maintain bullish bias while ETH remains above $1,790.66. Monitor resistance at $2,000 for breakout confirmation.🔍 Indicators RSI (14): 51.60 — Neutral SMA 50: $1,790.66 — Price slightly above → Bullish 30-Day Volatility: 4.97% Fear & Greed Index: 61 (Greed) Technical Sentiment: Bullish📈 Levels Next Resistance: ~$2,000 Next Support: ~$1,700 Short-Term Price Target: $1,804.35 by May 30, 2025
#ETH Update – April 22, 2025

Current Price: $1,700.02 (+7.8%)📊 Technical Snapshot• Trend: Downtrend (last 4 months)• Support: $1,500 & $1,350• Resistance: $1,750 & $2,150• Range: $1,557 – $1,630 → Moderate volatility• ETH has dropped ~65% from its all-time high of $4,107🔗 On-Chain Metrics• Exchange Inflows: Large positive netflow to derivatives in March → Selling pressure• Wallet Profitability: Only 20.94% of wallets in profit → Weak sentiment• Active Addresses: Down to 400K from 650K → Lower usage• Staked ETH: Over 25.6M ETH → Long-term confidence remains strong🧭 Fundamentals• SEC Approved ETH ETFs (no staking allowed) → Institutional inflow potential• Galaxy Digital moved $100M from ETH to SOL → Institutional rotation📈 Forecasts• Short-Term (by Apr 27): ~$1,635.87 (−0.51%)• Mid-Term (by May 22): ~$1,725.30 (+4.93%)✅ Summary:ETH is still in a downtrend, but fundamentals like staking and ETF approval show long-term strength. Short-term movement may be choppy. Watch $1,500 support and $1,750 resistance.
Disclaimer
Any content and materials included in Sahmeto's website and official communication channels are a compilation of personal opinions and analyses and are not binding. They do not constitute any recommendation for buying, selling, entering or exiting the stock market and cryptocurrency market. Also, all news and analyses included in the website and channels are merely republished information from official and unofficial domestic and foreign sources, and it is obvious that users of the said content are responsible for following up and ensuring the authenticity and accuracy of the materials. Therefore, while disclaiming responsibility, it is declared that the responsibility for any decision-making, action, and potential profit and loss in the capital market and cryptocurrency market lies with the trader.