
shakhitami
@t_shakhitami

What symbols does the trader recommend buying?
Purchase History
پیام های تریدر
Filter
Signal Type
shakhitami
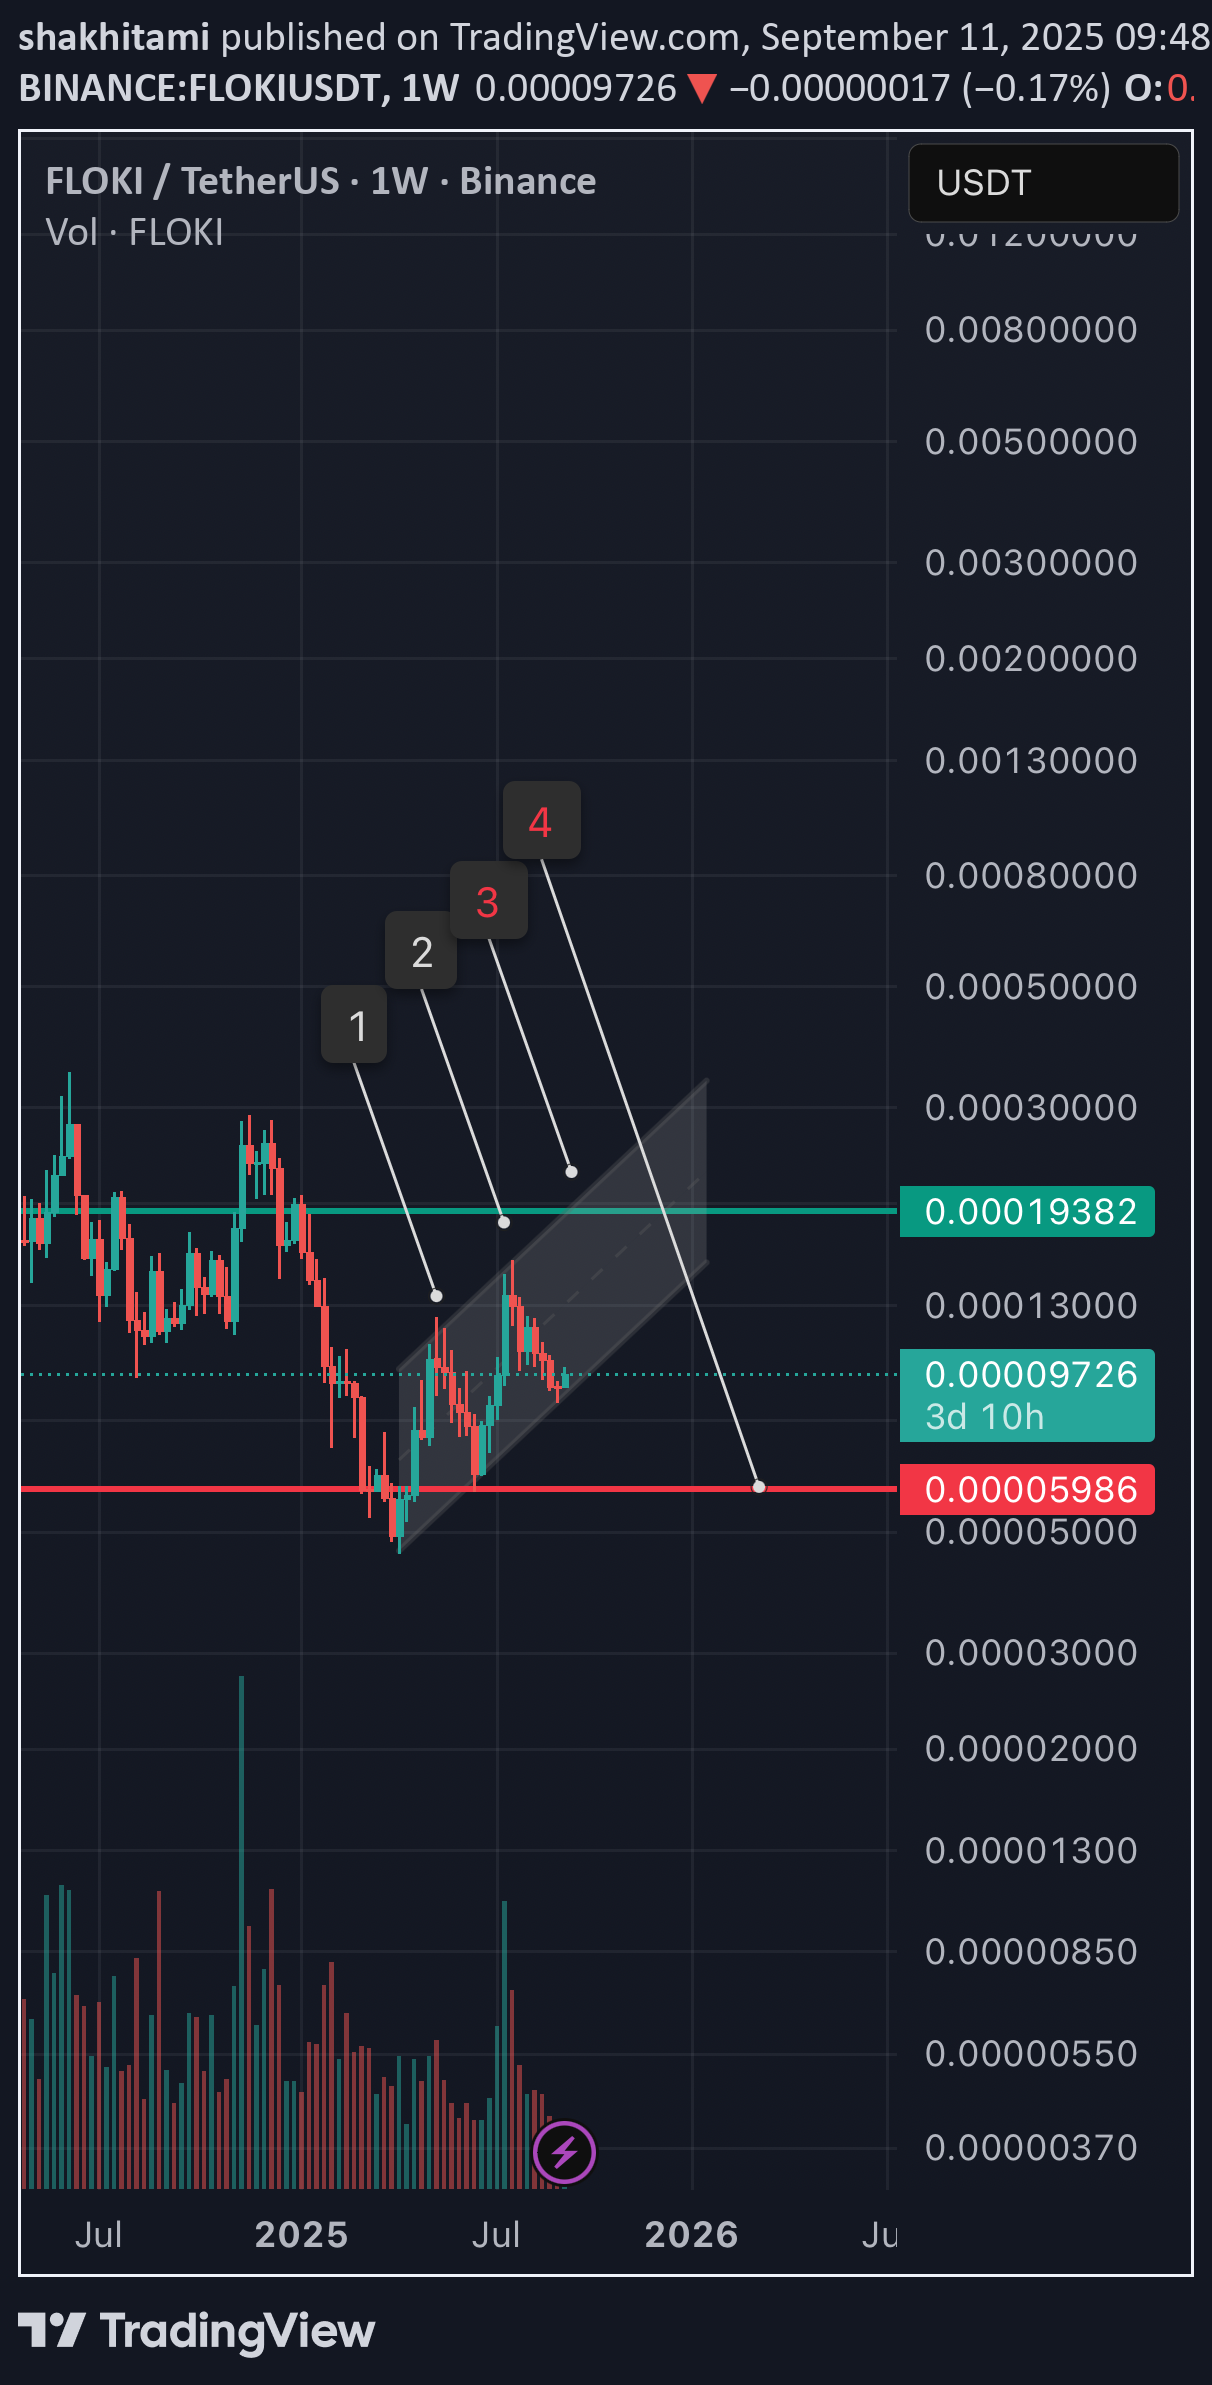
🔹 Current Price: 0.00009710 USDT FLOKI is trading inside a short-term ascending channel. However, price has already tested the channel’s upper boundary three times without a successful breakout, which increases the probability of a breakdown to the downside. 📊 Key Supports: •0.00008000 USDT – first major support inside the channel •0.00005986 USDT – critical support (losing this level could trigger a deeper sell-off) 📊 Key Resistances: •0.00013882 USDT – first resistance •0.00023000 USDT •0.00035000 USDT 📈 Bullish Scenario: If price holds above 0.00008000, buyers may push FLOKI toward 0.00013882. A breakout above this resistance could confirm strength and open the way to higher levels (0.00023000 – 0.00035000). 📉 Bearish Scenario (more likely at this stage): Multiple rejections from the channel top suggest weakness. If 0.00008000 breaks, price could retest 0.00005986. Losing this level would expose FLOKI to further downside, potentially toward 0.00004000 – 0.00003000. ⸻ ✍️ Conclusion: FLOKI is at a decisive zone. •Holding above 0.00008000 keeps the bullish scenario alive. •Breaking below 0.00008000 increases the risk of a strong bearish move. ⸻ 📌 #FLOKI #Crypto #Altcoins #TradingView #TechnicalAnalysis #CryptoTrading
shakhitami
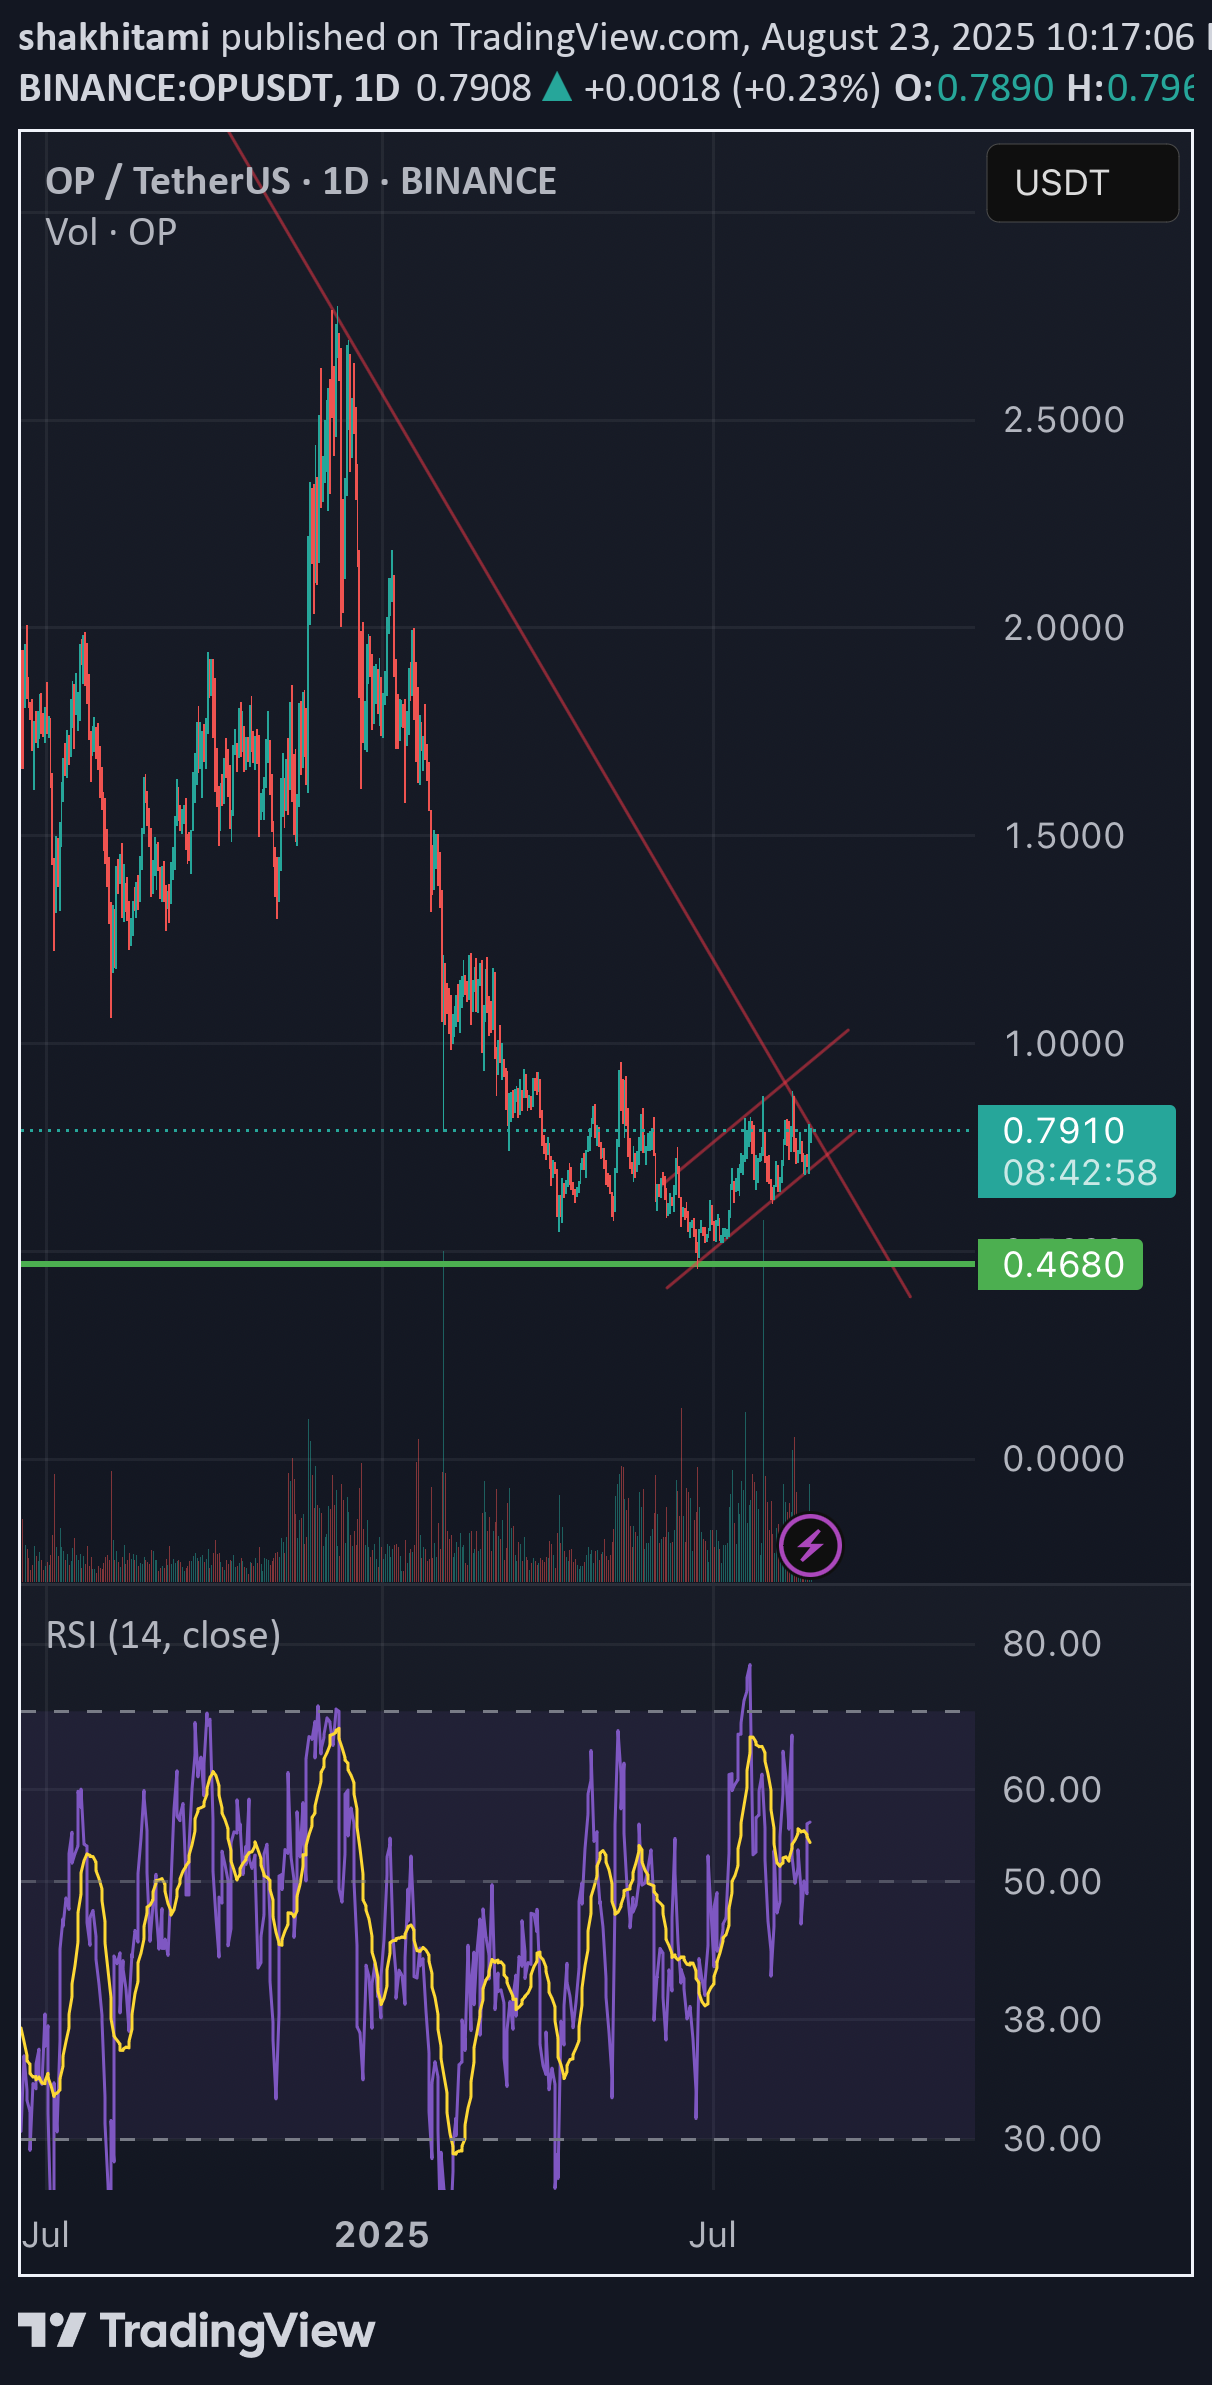
⸻ OP is consolidating inside a symmetrical triangle after a long downtrend from the $2.5 zone. •Support levels: •Key support: $0.75 – $0.80 •Major support: $0.468 (if lost, deeper correction possible) •Resistance levels: •Immediate resistance: $0.90 – $1.00 •Strong resistance: $1.25 •RSI (14D): Currently neutral around 50–55. •Break above 60 → bullish momentum confirmation •Drop below 40 → bearish continuation 📌 Scenarios: •Bullish: Break and close above $0.90 – $1.00 could target $1.25. •Bearish: Losing $0.75 may push price toward $0.468. ⸻ ⚠️ Not financial advice. DYOR. ⸻ میخوای برات یک نسخهی خیلی کوتاه و جمعوجور هم آماده کنم که بیشتر شبیه ایدههای منتشر شده در TradingView باشه؟
shakhitami
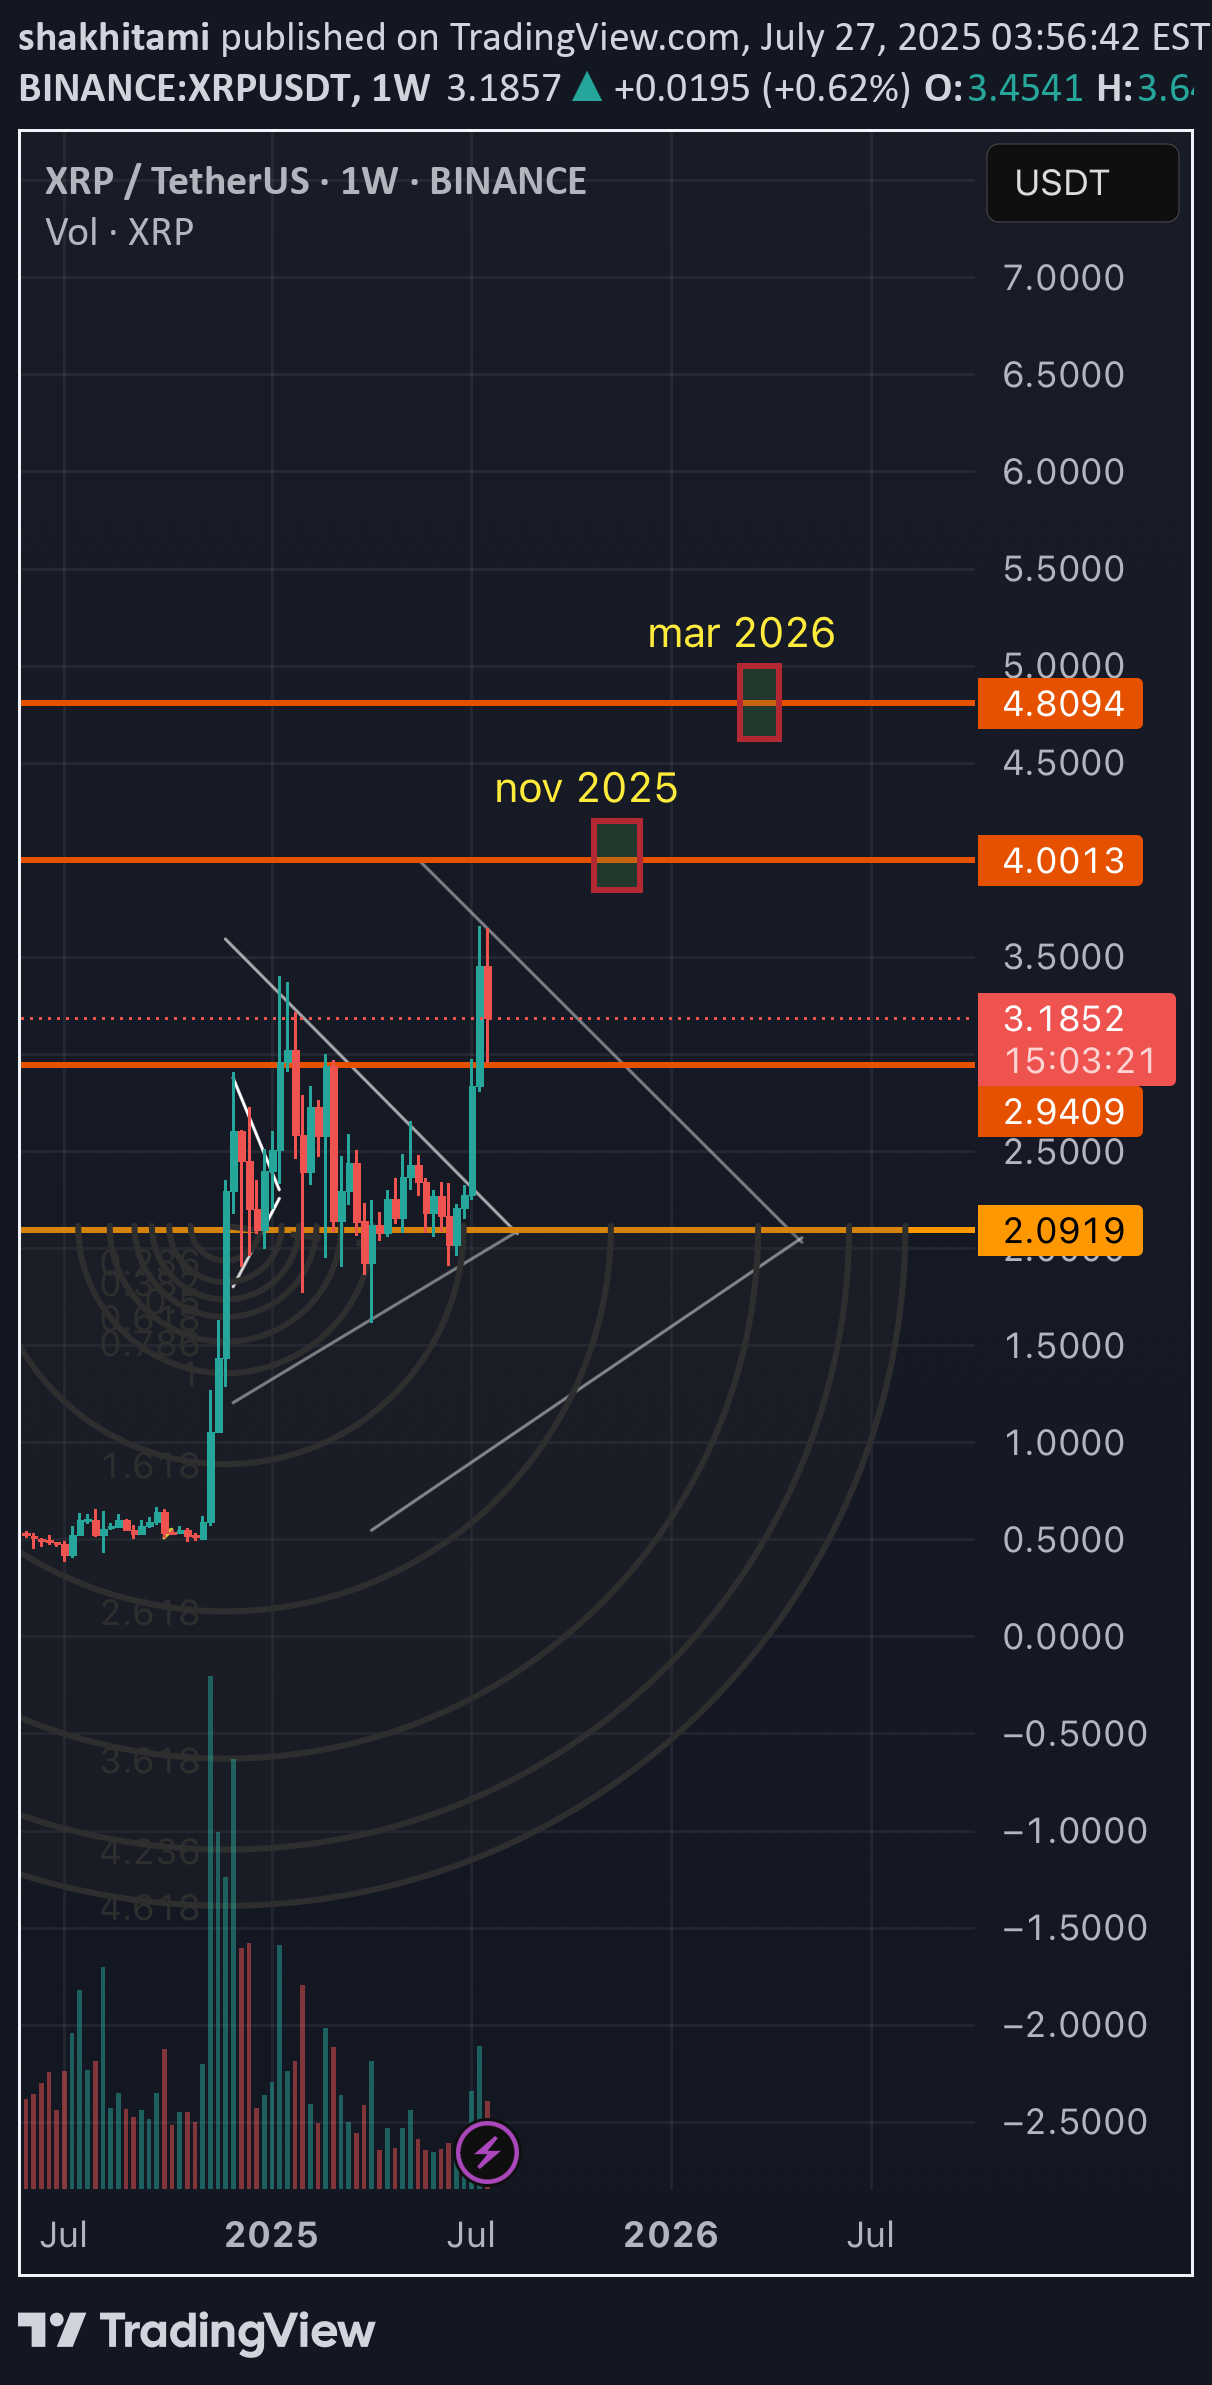
🔍 XRP/USDT Weekly Analysis 📊 Technical Overview: •XRP recently broke out of a long-term descending trendline with strong bullish momentum. •Key support zone now rests around $2.09 – previous resistance turned support. •Price is currently consolidating around $3.18 after a strong impulse move. 🎯 Targets: •First target: 🔸 $4.00 expected around November 2025 •Second target: 🔸 $4.80 expected around March 2026 These targets align with Fibonacci arc projections and historical resistance levels. 📈 Trend Strength: •Breakout backed by strong volume suggests momentum is sustainable. •If price holds above $2.94, bullish continuation is likely. ⚠️ Risk Levels: •Losing support at $2.09 could invalidate the bullish setup and push price back to the lower range.
shakhitami
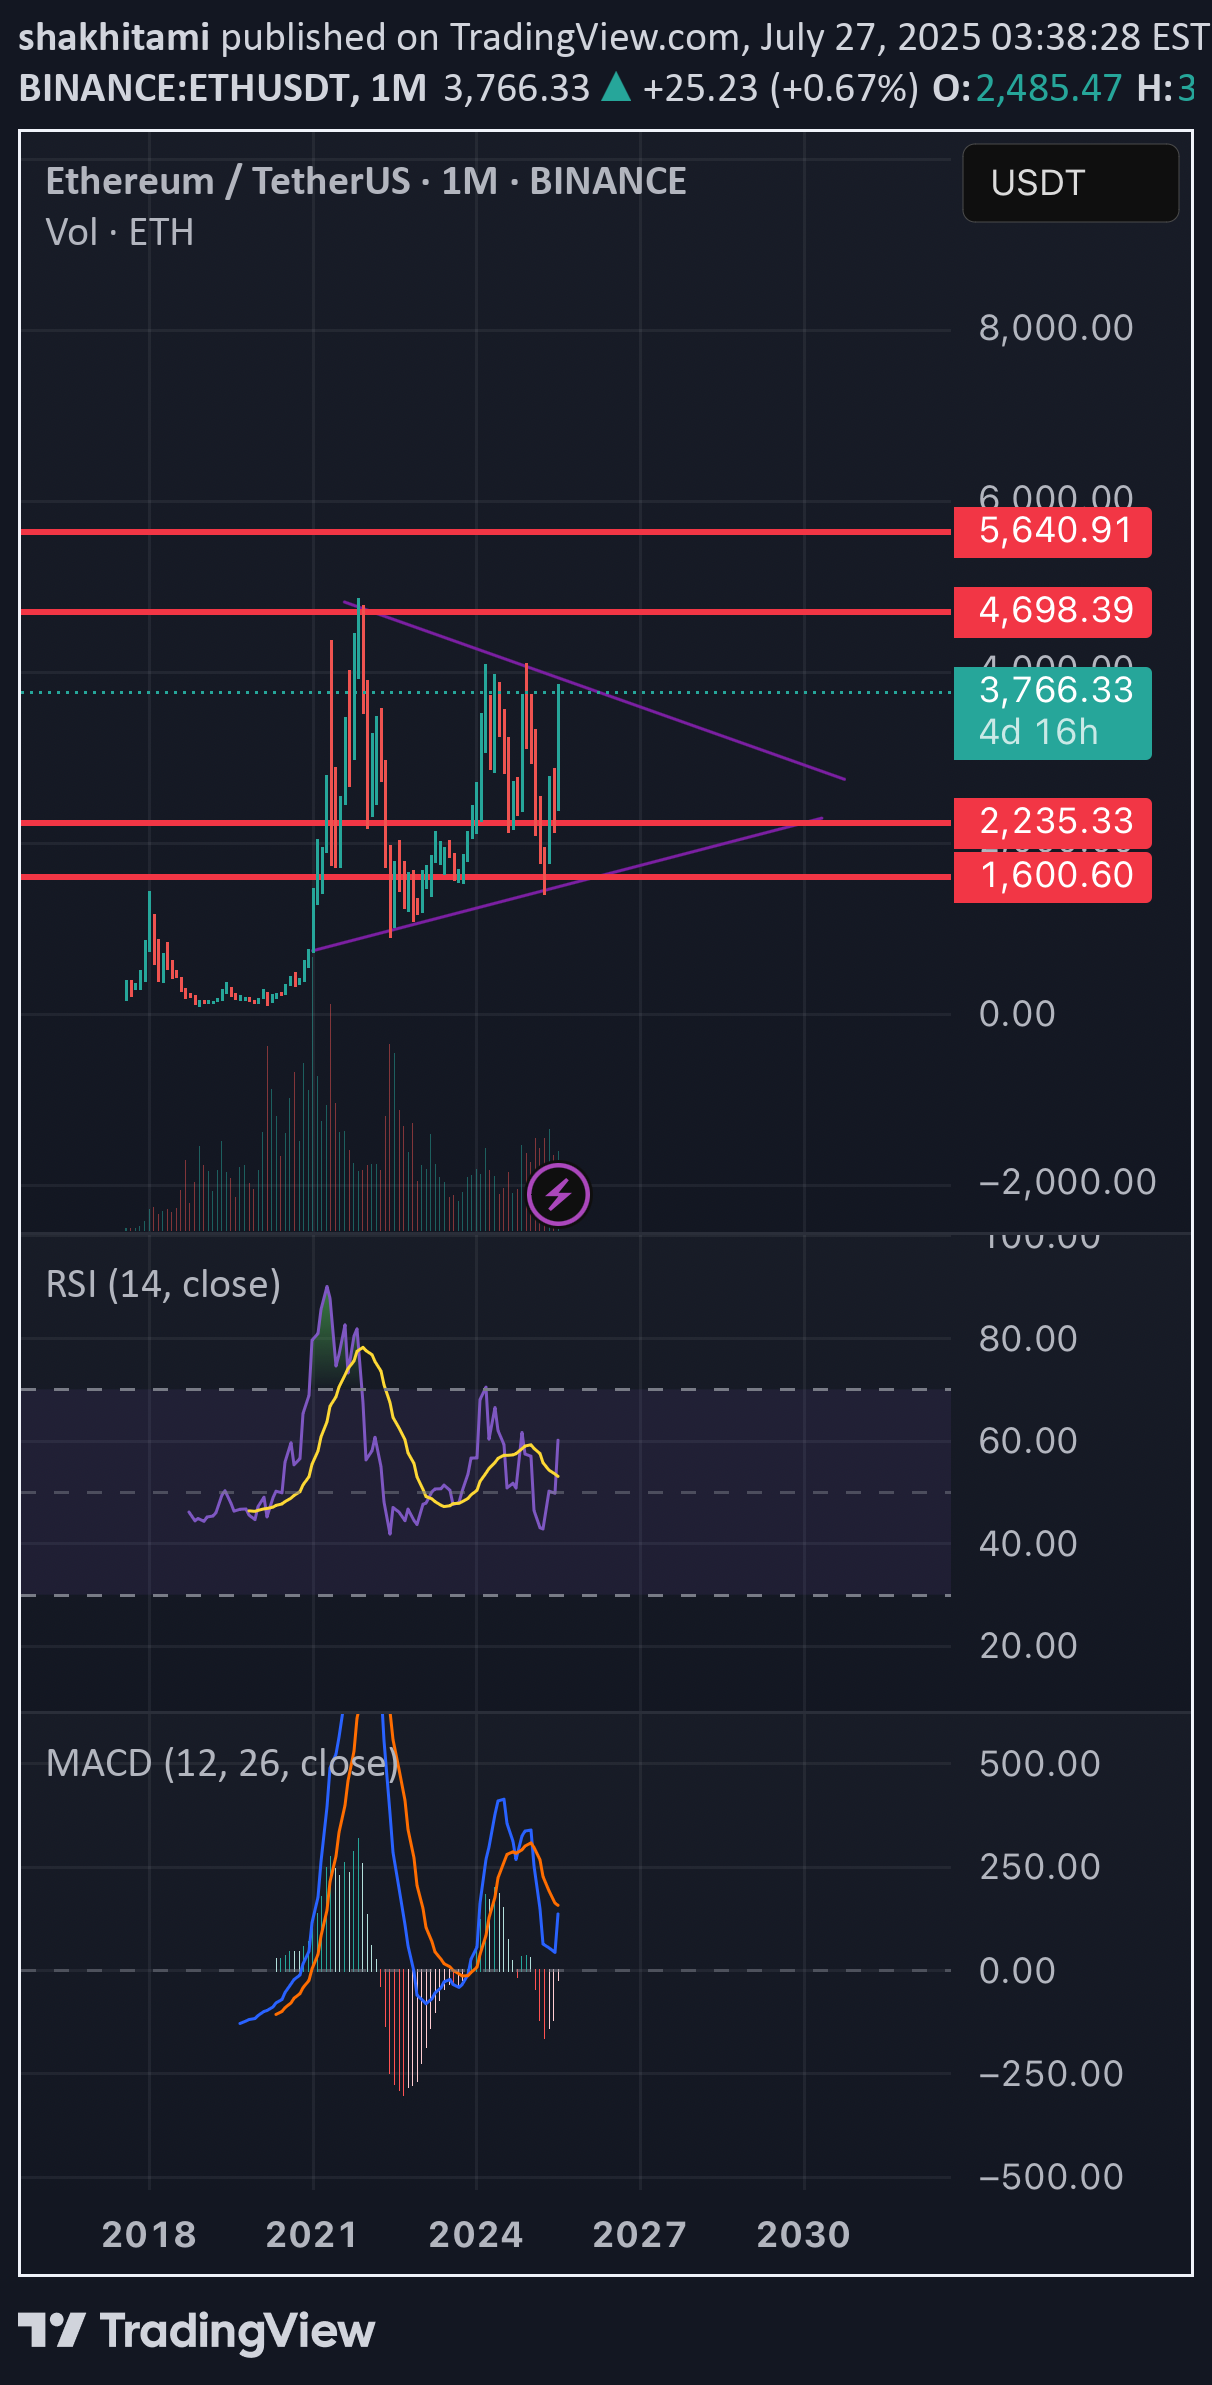
Price Action & Structure: •Ethereum is forming a symmetrical triangle, indicating a potential breakout or breakdown in the coming months. •Key resistance levels: •$4,698 (mid-term resistance) •$5,640 (all-time high area) •Key support levels: •$2,235 •$1,600 Indicators: •RSI (14): Currently around 50, showing neutral momentum but slightly recovering. No overbought or oversold condition. •MACD (12,26): The blue line is attempting to cross above the orange line, a possible early bullish crossover. Histogram shows weakening bearish momentum. •Volume: Decreasing volume inside the triangle pattern, typical before a breakout. Outlook: •A breakout above $4,698 with volume could target the $5,640 zone. •A breakdown below $2,235 would open the door toward $1,600 or lower. •Wait for a confirmed breakout from the triangle before major entries.
shakhitami
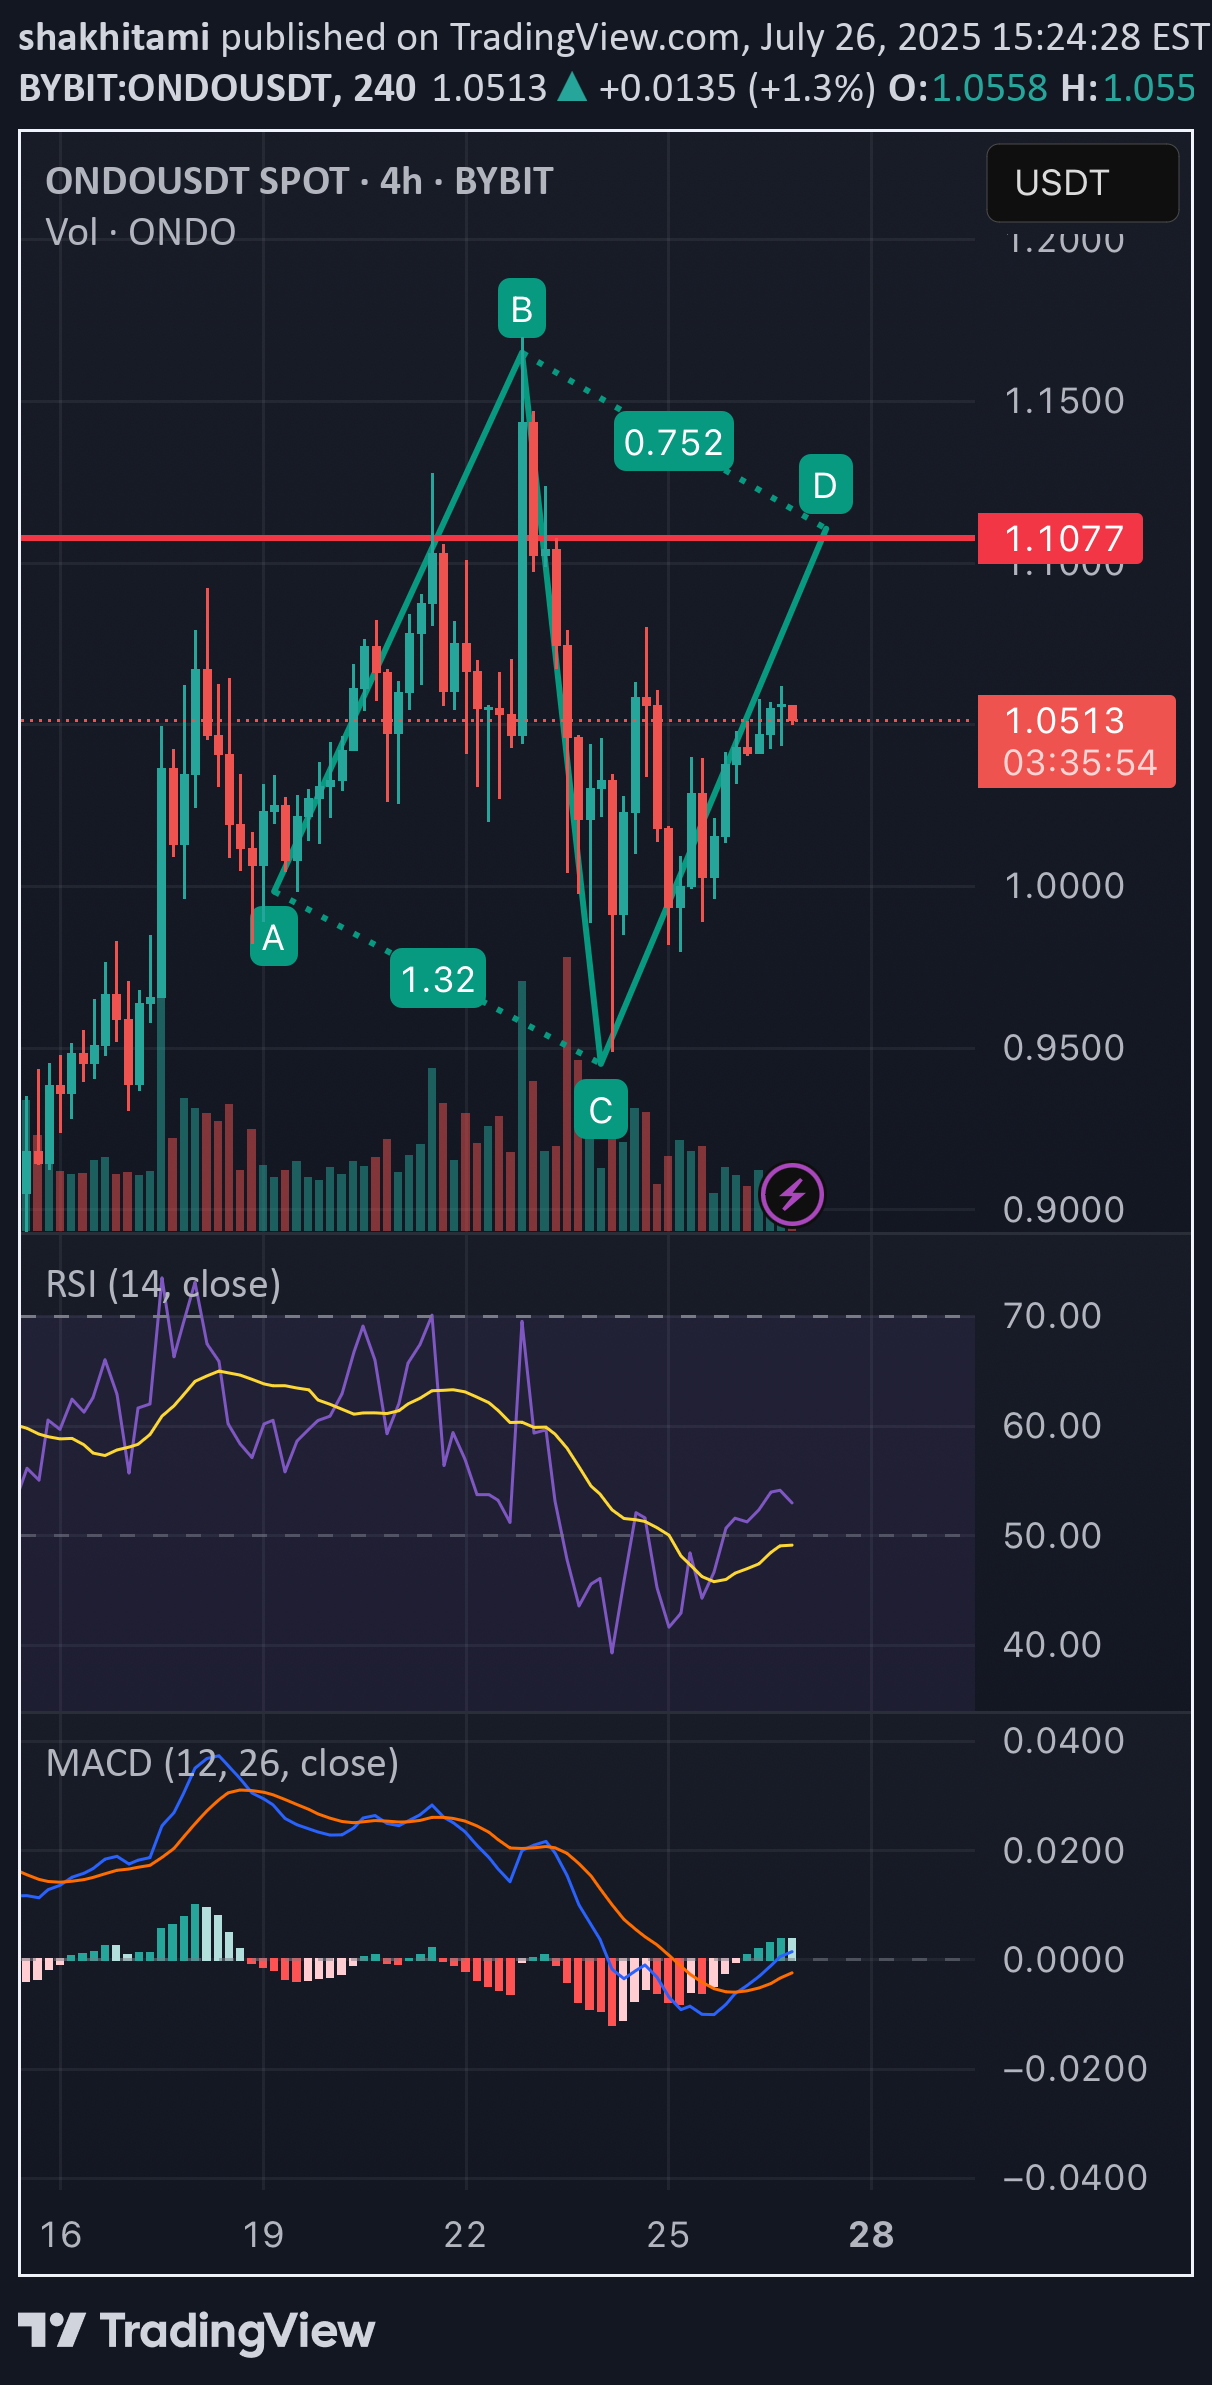
🔹 Harmonic Pattern (Possibly a Gartley or Bat) The chart shows a clear ABCD pattern, suggesting a potential reversal zone around point D. •A → B → C → D structure is visible. •Based on Fibonacci ratios: •AB ≈ 0.75 retracement (close to Bat or Gartley pattern) •BC ≈ 1.32 extension, which also fits harmonic rules 📌 Point D is around 1.1077, which is likely a resistance/reversal area. ⸻ 🔹 RSI (Relative Strength Index) •RSI is around 50, indicating neutral momentum (not overbought or oversold). •It’s starting to curve upward, which could signal a build-up in buying strength. ⸻ 🔹 MACD •A bullish crossover is visible (MACD line crossing above the signal line). •Histogram turning positive = early bullish signal. ⸻ 🔹 Summary & Trade Scenarios ✅ Bullish Scenario: •If price breaks above 1.1077 with strong volume, it may target 1.15 or higher. •Confirmation needed: candle close above D zone (1.1077) with volume support. ❌ Bearish Scenario: •If price retests 1.1077 and fails, it might reverse toward support around 1.00 or even 0.95. •Watch for bearish divergence or rejection candles near D. ⸻ 🎯 Suggested Strategy: •Long setup: If price breaks and holds above 1.108, target 1.15, stop-loss below 1.05 •Short setup (more conservative): If price rejects from 1.1077, consider short with target 1.00
shakhitami
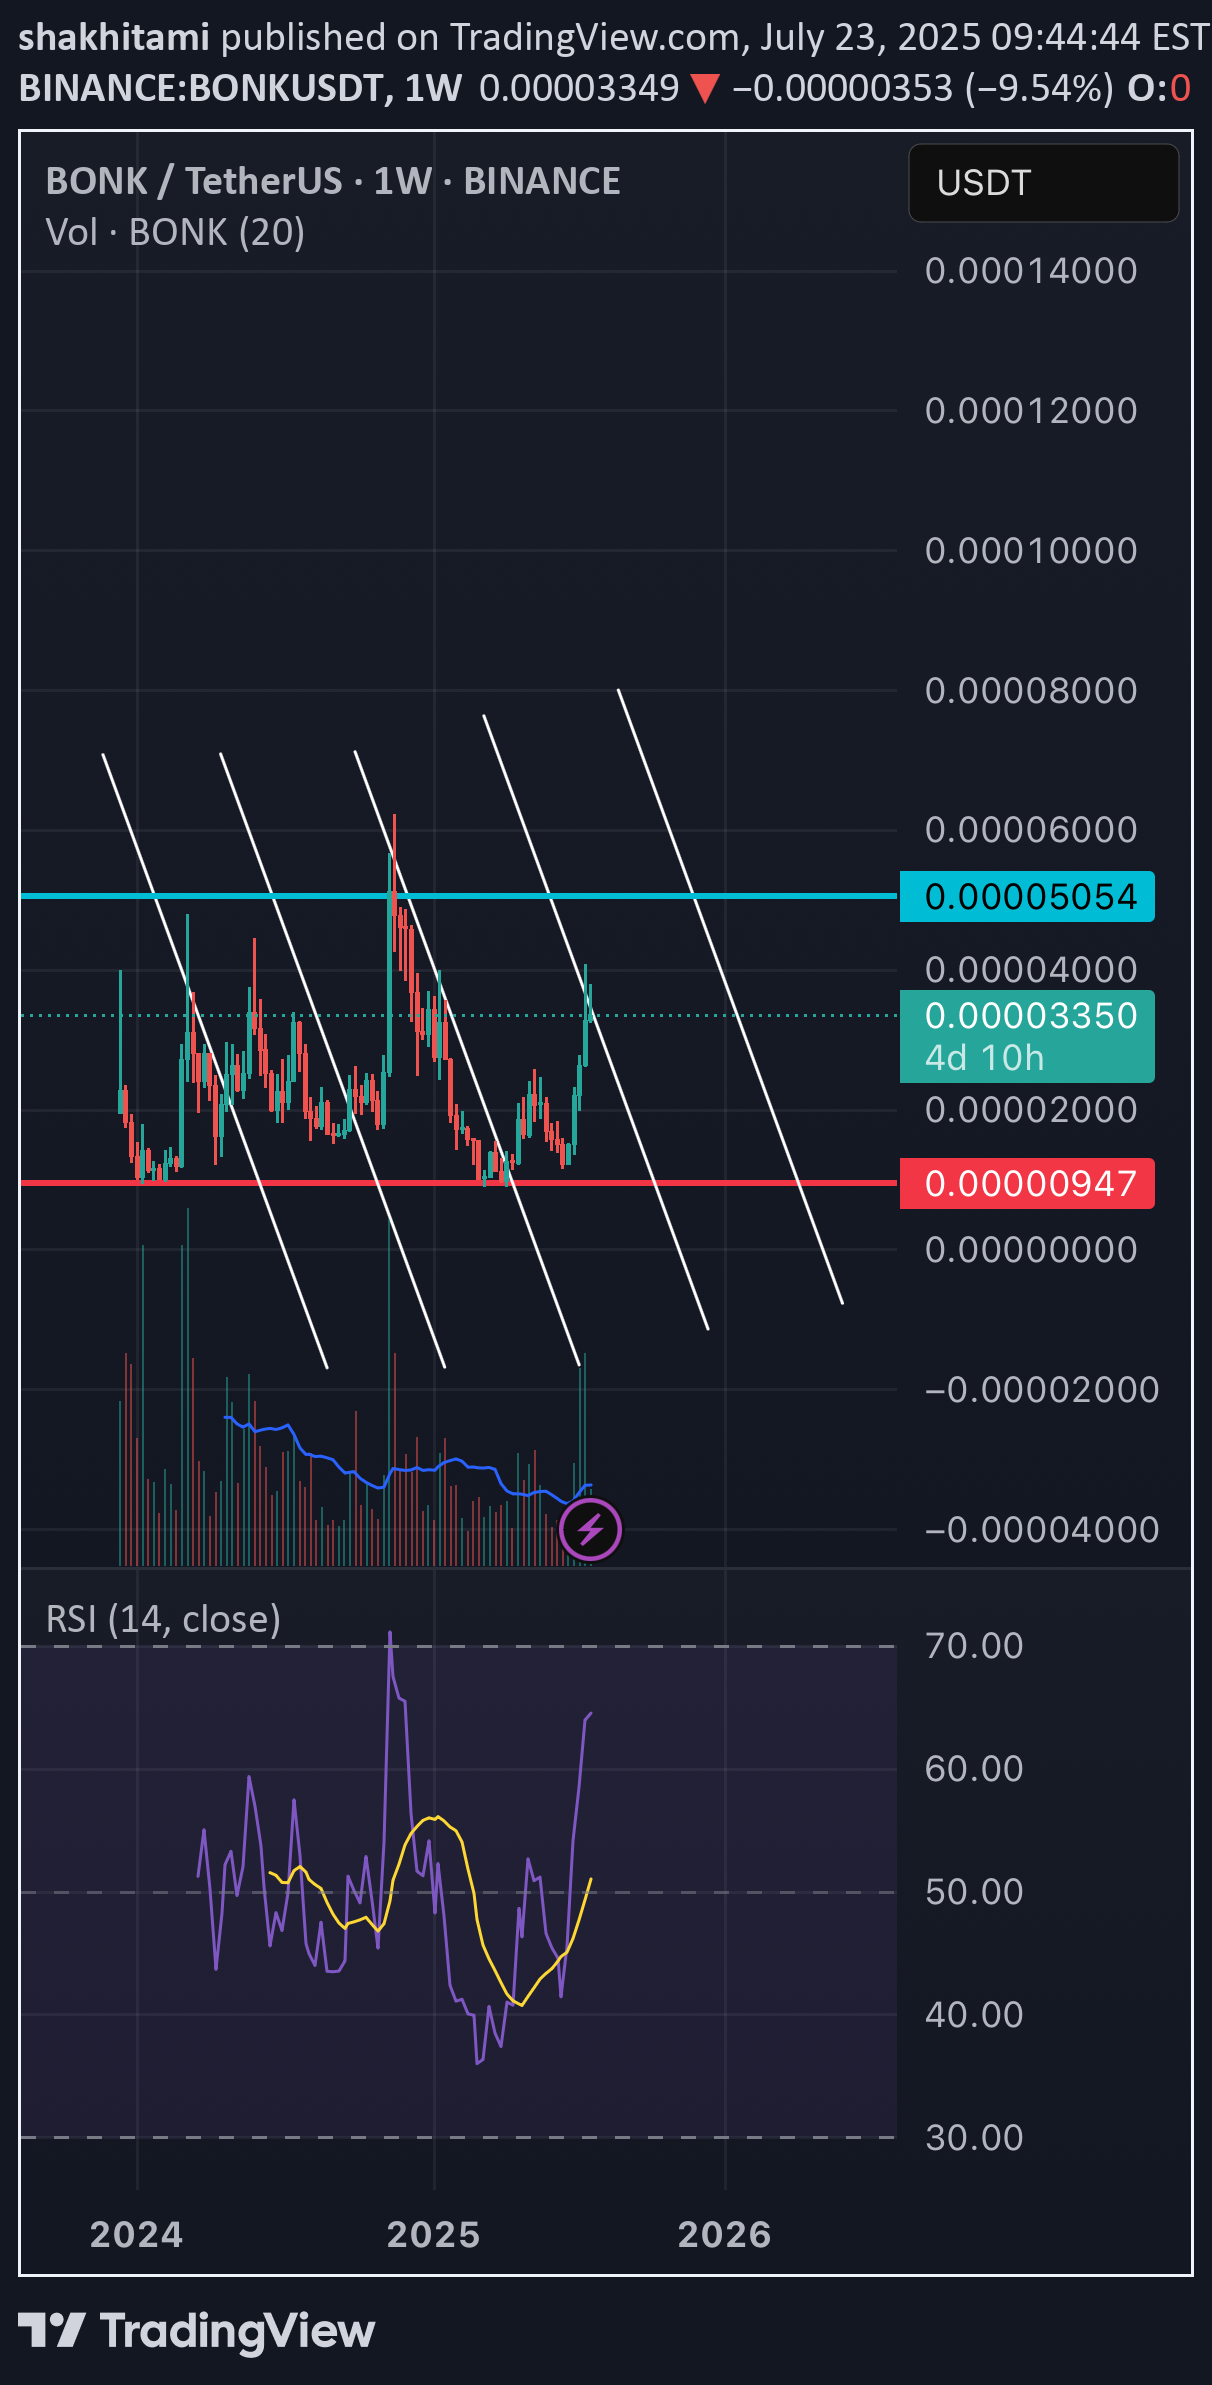
BONK/USDT (1W) BONK is showing a strong bounce from long-term support! 🚀 After touching the strong weekly support zone around 0.00000947, BONK surged with significant volume, breaking out of the descending mini-channel. The price is now approaching the 0.00005054 resistance level, which previously acted as a rejection point. 📊 Key Points: •Support: 🔻 0.00000947 – major long-term support •Resistance: 🔺 0.00005054 – key resistance and potential breakout target •RSI (14): RSI is sharply rising and crossing above its moving average, suggesting bullish momentum building up. •Volume: A strong volume spike confirms increased buying interest from the bottom. ⸻ 🔍 Outlook: As long as BONK holds above 0.00002, bulls have a good chance to push toward 0.00005. A breakout above this level could lead to a strong rally. Watch for RSI overbought conditions in the coming weeks. ⸻ #BONK #BONKUSDT #Crypto #Altcoins #TradingView #TechnicalAnalysis #MemeCoins #Bullish
shakhitami
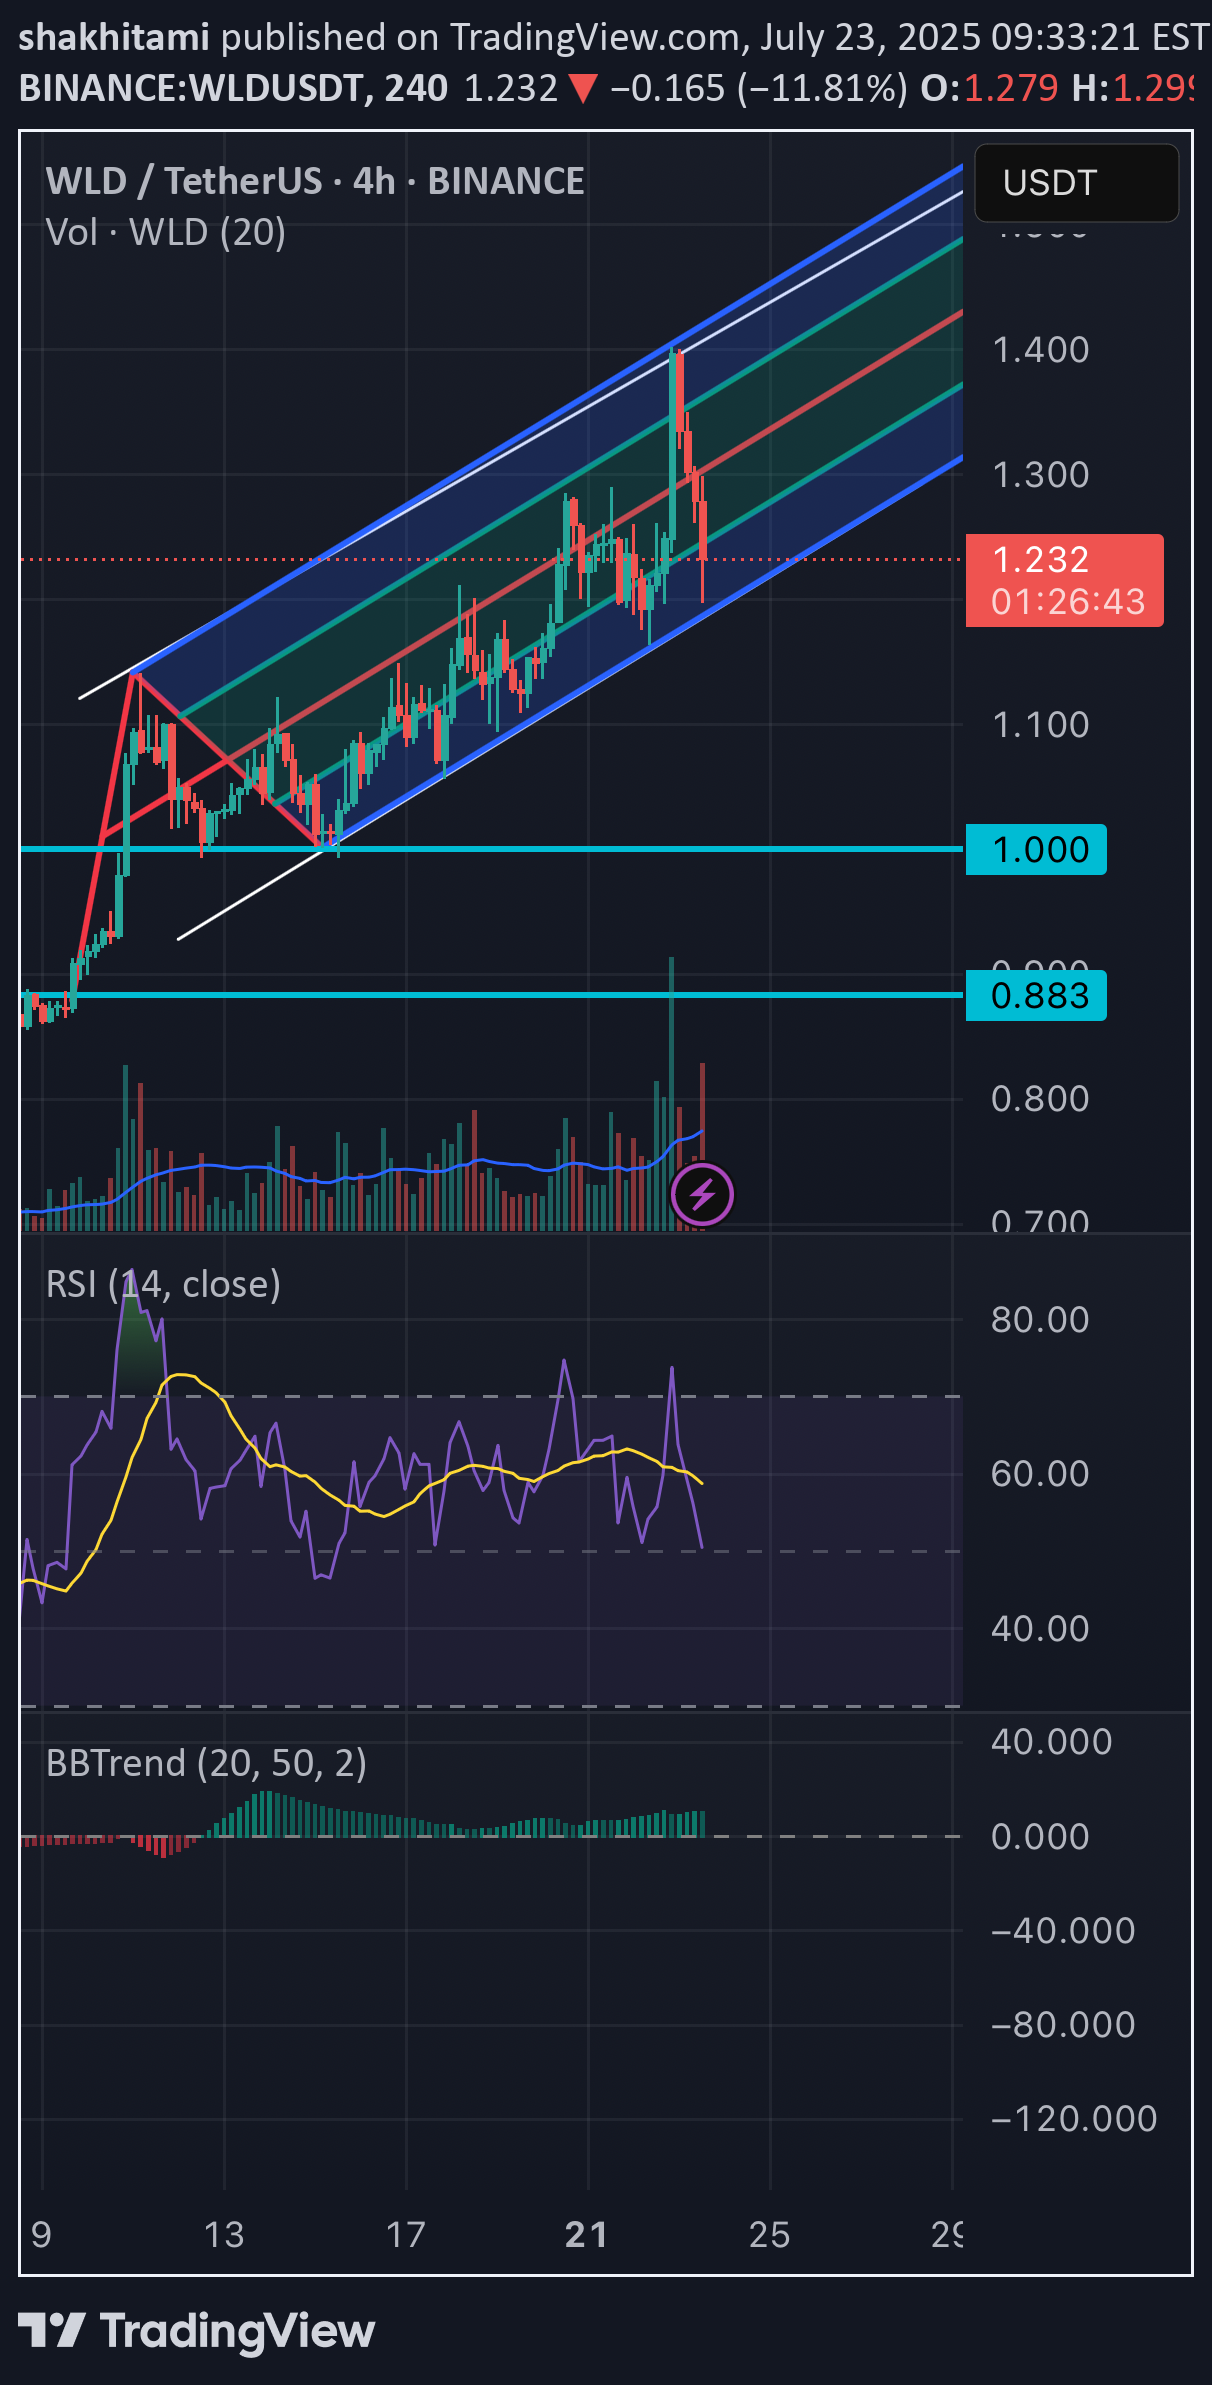
🚨 WLD/USDT – 4H Technical Analysis 🚨 WLD is currently trading within a well-defined ascending channel 📈. After touching the upper boundary, the price sharply dropped by over 11%, signaling a strong rejection from resistance. 🔻 🔍 Key Insights: 🔹 Support Levels: 🟦 $1.000 – major psychological and technical support 🟦 $0.883 – previous breakout zone 🔹 Resistance: 🔺 $1.30–$1.32 zone acted as strong resistance recently 🔹 RSI (14): 📉 Dropping below 50, showing bearish momentum ⚠️ Bearish crossover with its moving average 🔹 Volume: 📊 Big red candle with strong volume = heavy selling pressure 🔹 BBTrend: 📉 Bullish momentum is fading ⸻ 📌 What to Watch: If price breaks below the midline of the channel, we could see a test of the $1.00 or even $0.88 support. However, a bounce from here with volume confirmation could signal continuation toward the top of the channel 📈. ⚠️ Stay cautious – trend is bullish but clearly under pressure. ⸻ #WLD #Crypto #Altcoins #TradingView #TA #TechnicalAnalysis #USDT #CryptoTraders #PriceAction
shakhitami
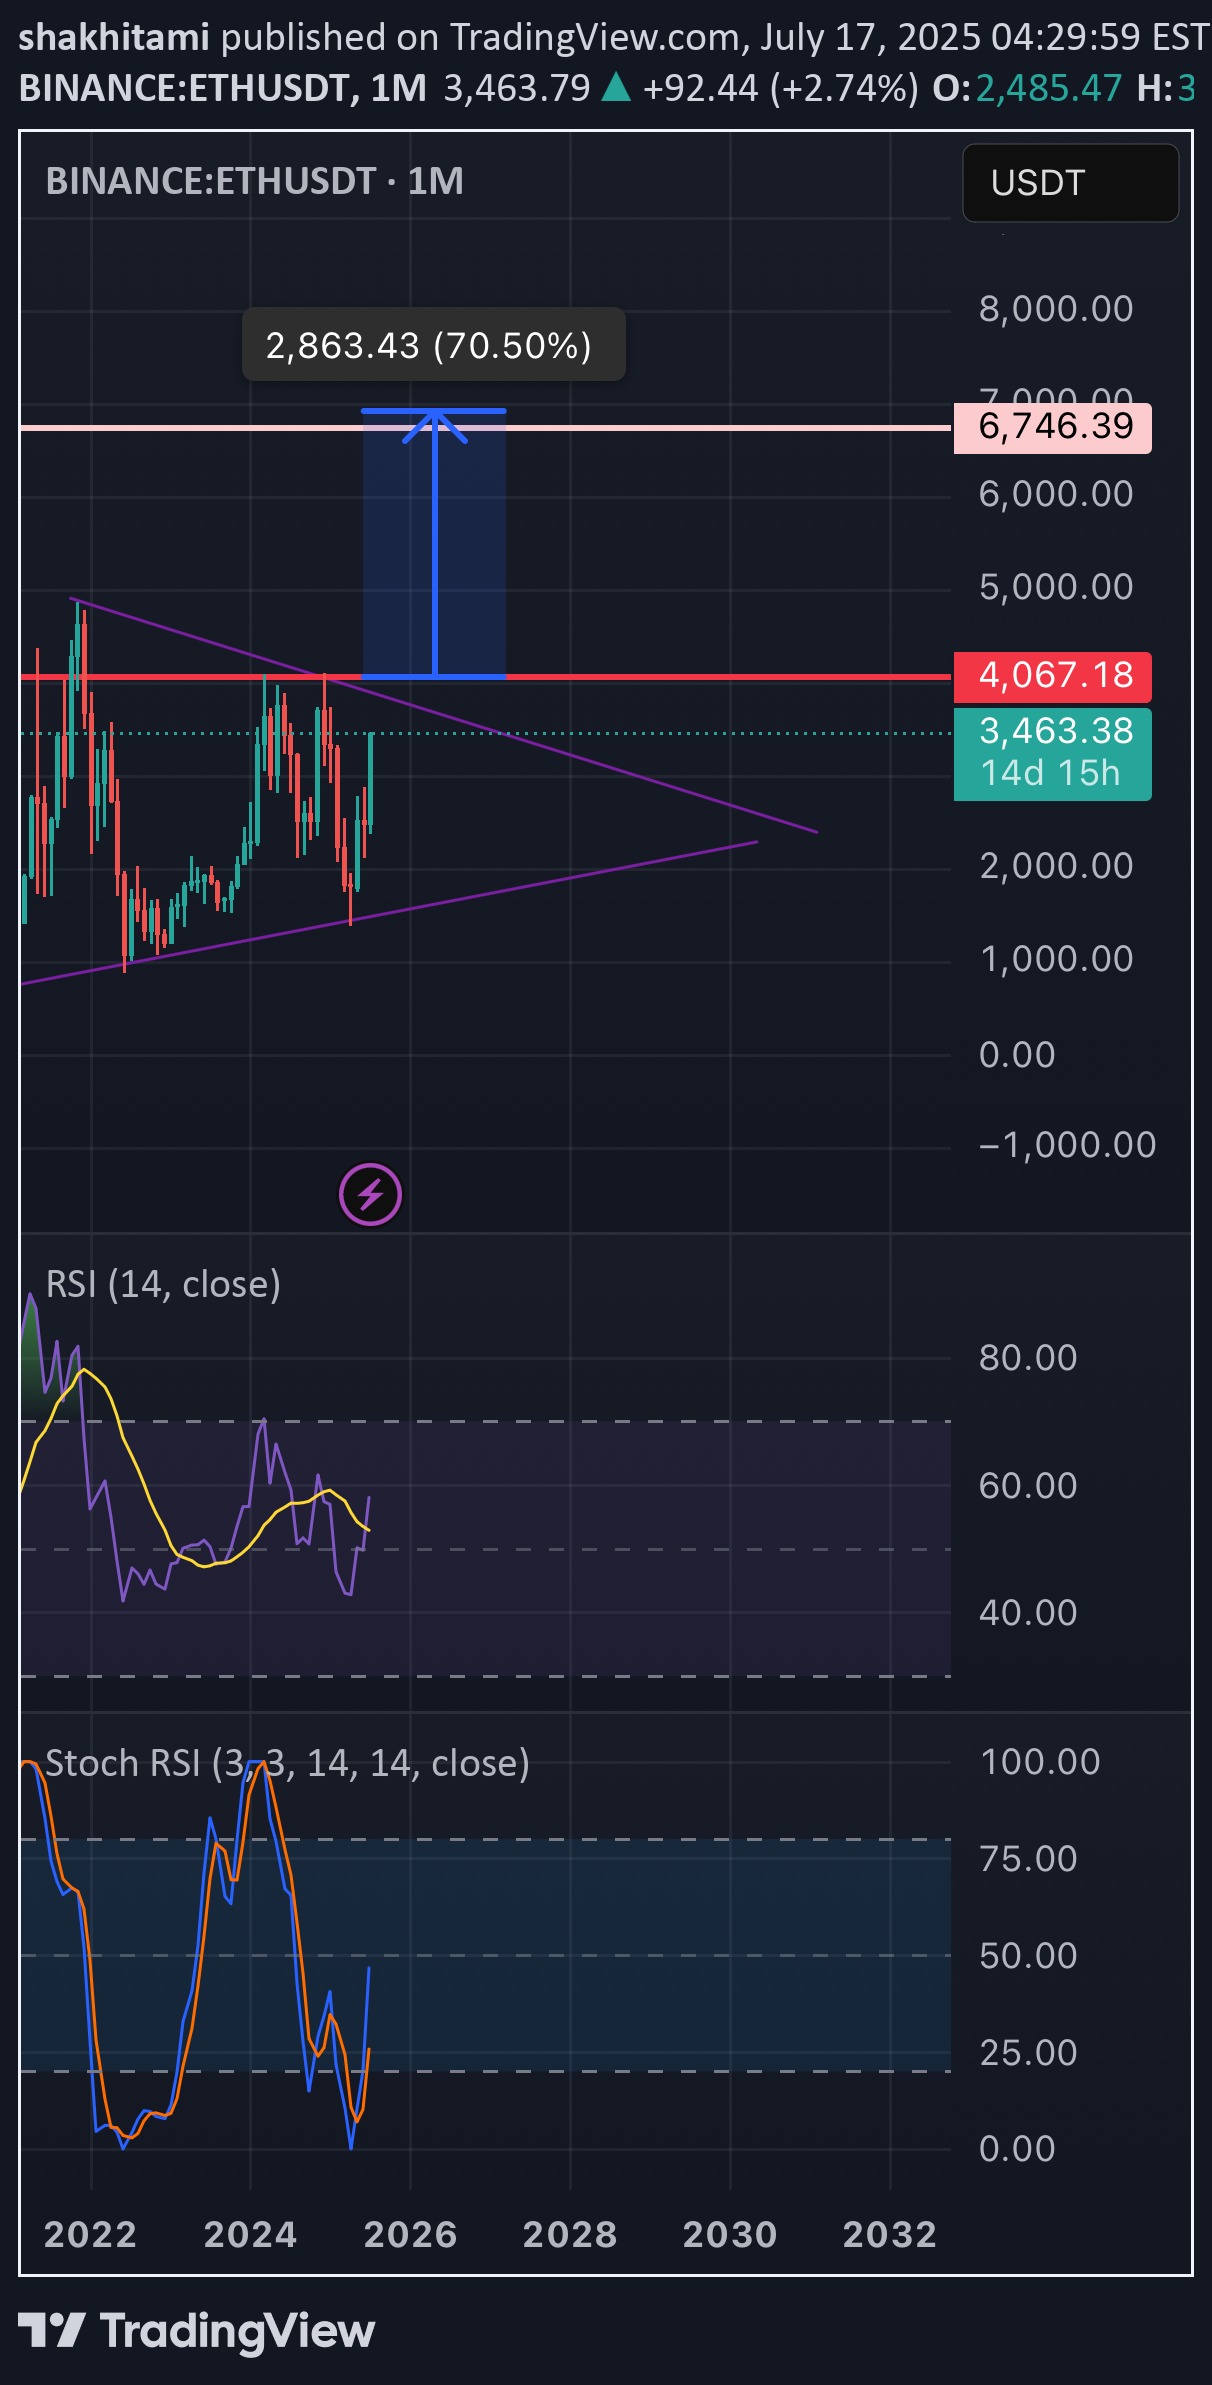
🟣 Ethereum Monthly Timeframe Analysis – Large Symmetrical Triangle 📌 Current Situation: •On the monthly chart (1M), Ethereum (ETH) has formed a large symmetrical triangle pattern. •This pattern typically signals a major price consolidation before a significant move. •The descending resistance line connects the 2021 all-time high to recent lower highs. •The ascending support line is drawn from the 2018 low through the 2022 bottom. •Price is nearing the apex of the triangle, indicating a breakout is likely soon. ⸻ 🔼 Bullish Scenario (Breakout to the Upside): If ETH breaks above the triangle resistance and confirms the move: ✅ Signs of a Bullish Continuation: •Strong breakout above the $4,000–$4,500 zone •Increased volume confirming breakout •Price holds above resistance-turned-support 🎯 Potential Price Targets by 2027 (based on triangle height & Fibonacci projections): 1.Target 1: $6,800 – $7,500 2.Target 2: $9,000 – $10,000 3.Long-term Target: $12,000 – $15,000 (if macro bull market continues) ⸻ 🔽 Bearish Scenario (Fakeout or Breakdown): If the breakout fails or price breaks down: •ETH could revisit lower supports around $2,000 or even $1,400 •Bullish momentum delayed until another strong base forms ⸻ 🔍 Conclusion: •This triangle could mark the beginning of a major rally into 2027, especially if supported by fundamentals (e.g., ETF approval, DeFi growth). •Wait for a confirmed breakout with volume and retest before entering a long-term position.
shakhitami
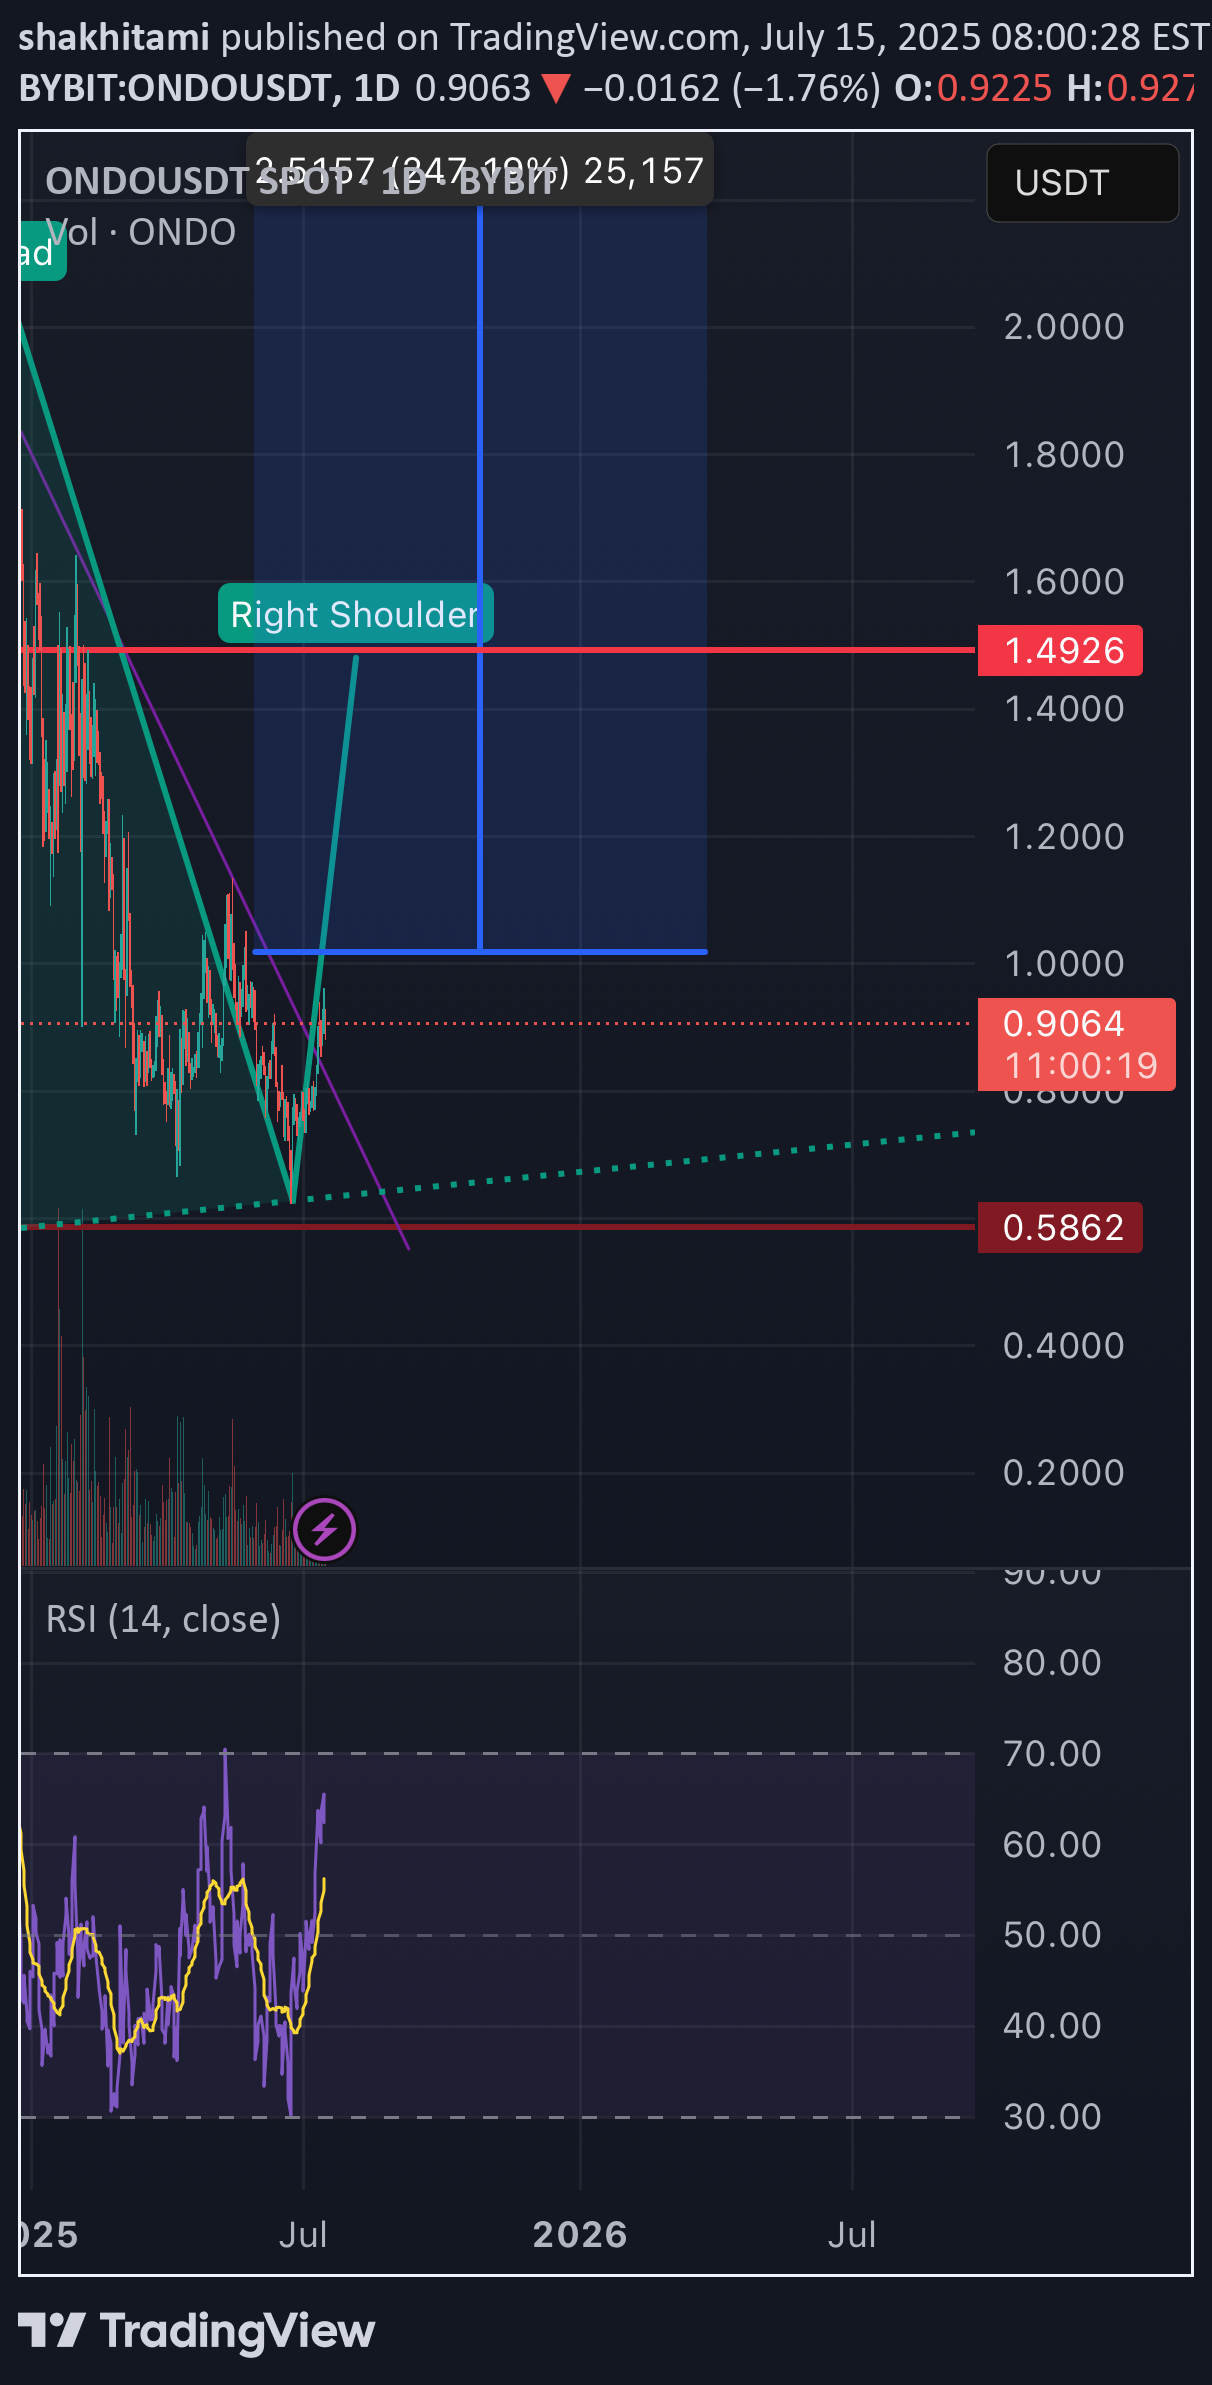
Bullish Reversal in Play – ONDO/USDT Weekly Chart A clear Inverse Head and Shoulders pattern is forming on the weekly timeframe. Price is currently breaking out of the neckline with strong momentum. 🔹 Left Shoulder: Formed with consistent volume support 🔹 Head: Deep correction followed by strong recovery 🔹 Right Shoulder: Higher low formation with bullish pressure 📈 Potential Target: $2.51 (+247%) 🛡️ Support Zone: ~$0.58 If this breakout confirms with weekly close above the neckline (~$0.90–$1.00), we could be seeing the start of a major bull wave. #ONDO #CryptoAnalysis #InverseHeadAndShoulders #Altseason #Breakout
shakhitami
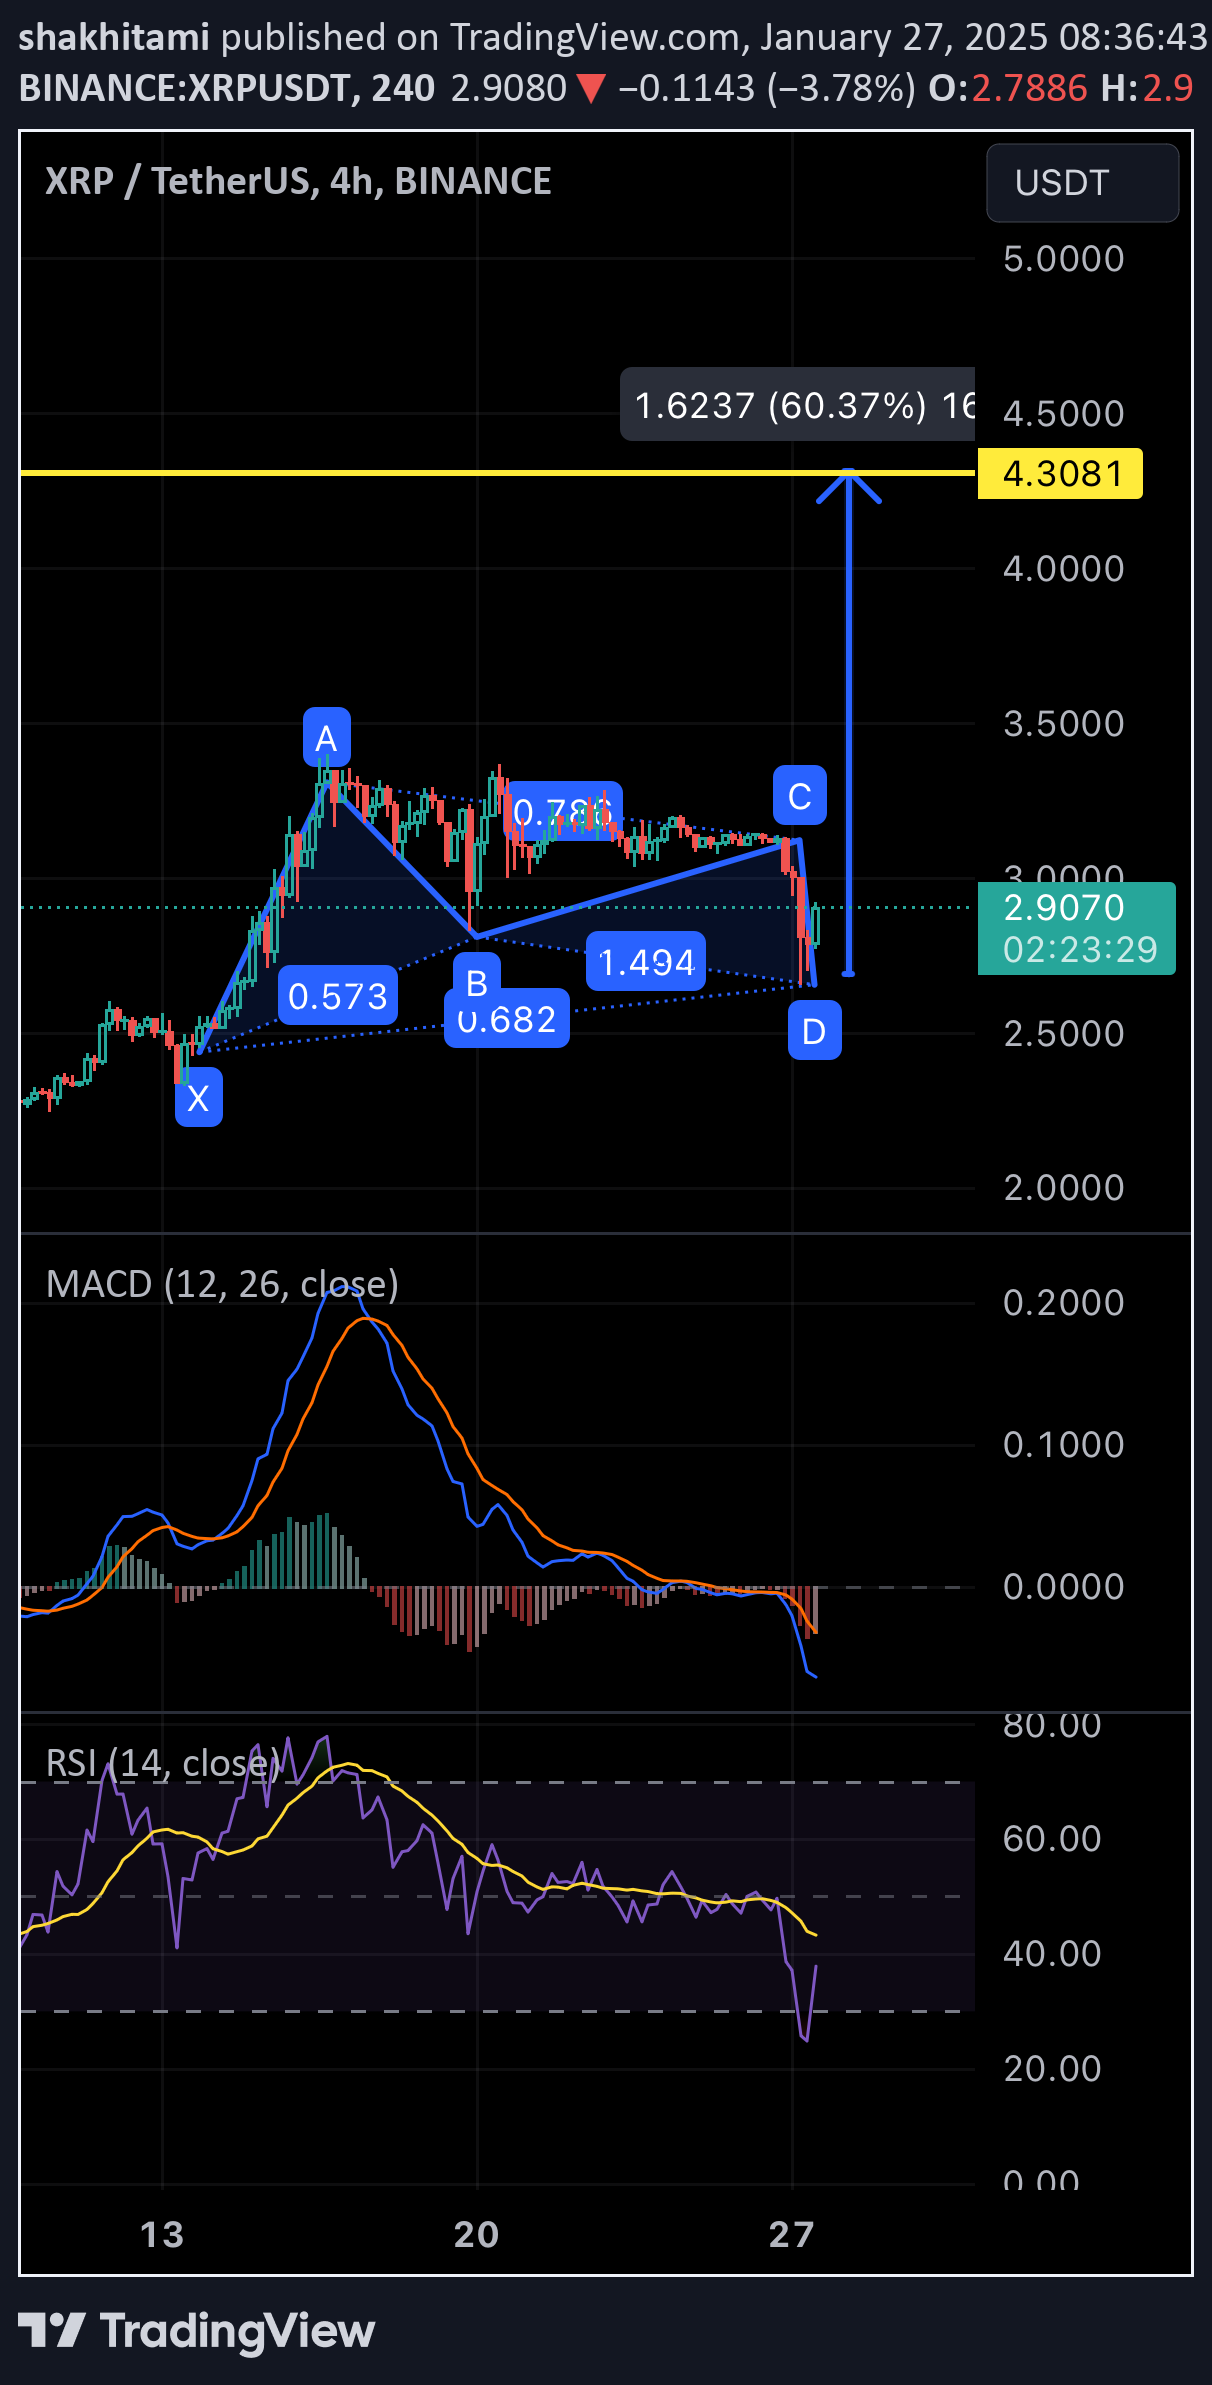
In this chart, a harmonic pattern called the “Butterfly Pattern” is visible, with key points labeled as X, A, B, C, and D. Here’s a brief explanation of the components:1.Harmonic Pattern:•The pattern is based on specific Fibonacci ratios. The levels indicate that the price may potentially reverse upward from point D.•Point D is typically where the price is expected to react.2.MACD:•The MACD indicator at the bottom shows momentum changes. The blue and orange lines moving downward indicate decreasing buying power.3.RSI:•The RSI indicator is in oversold territory (below 30), suggesting a potential reversal in the price.4.Price Target:•The blue arrow and the yellow line at the top indicate a potential price target (4.3081). This target is based on technical analysis and might represent a future resistance level.
Disclaimer
Any content and materials included in Sahmeto's website and official communication channels are a compilation of personal opinions and analyses and are not binding. They do not constitute any recommendation for buying, selling, entering or exiting the stock market and cryptocurrency market. Also, all news and analyses included in the website and channels are merely republished information from official and unofficial domestic and foreign sources, and it is obvious that users of the said content are responsible for following up and ensuring the authenticity and accuracy of the materials. Therefore, while disclaiming responsibility, it is declared that the responsibility for any decision-making, action, and potential profit and loss in the capital market and cryptocurrency market lies with the trader.