Technical analysis by shakhitami about Symbol XRP: Buy recommendation (1/27/2025)

shakhitami
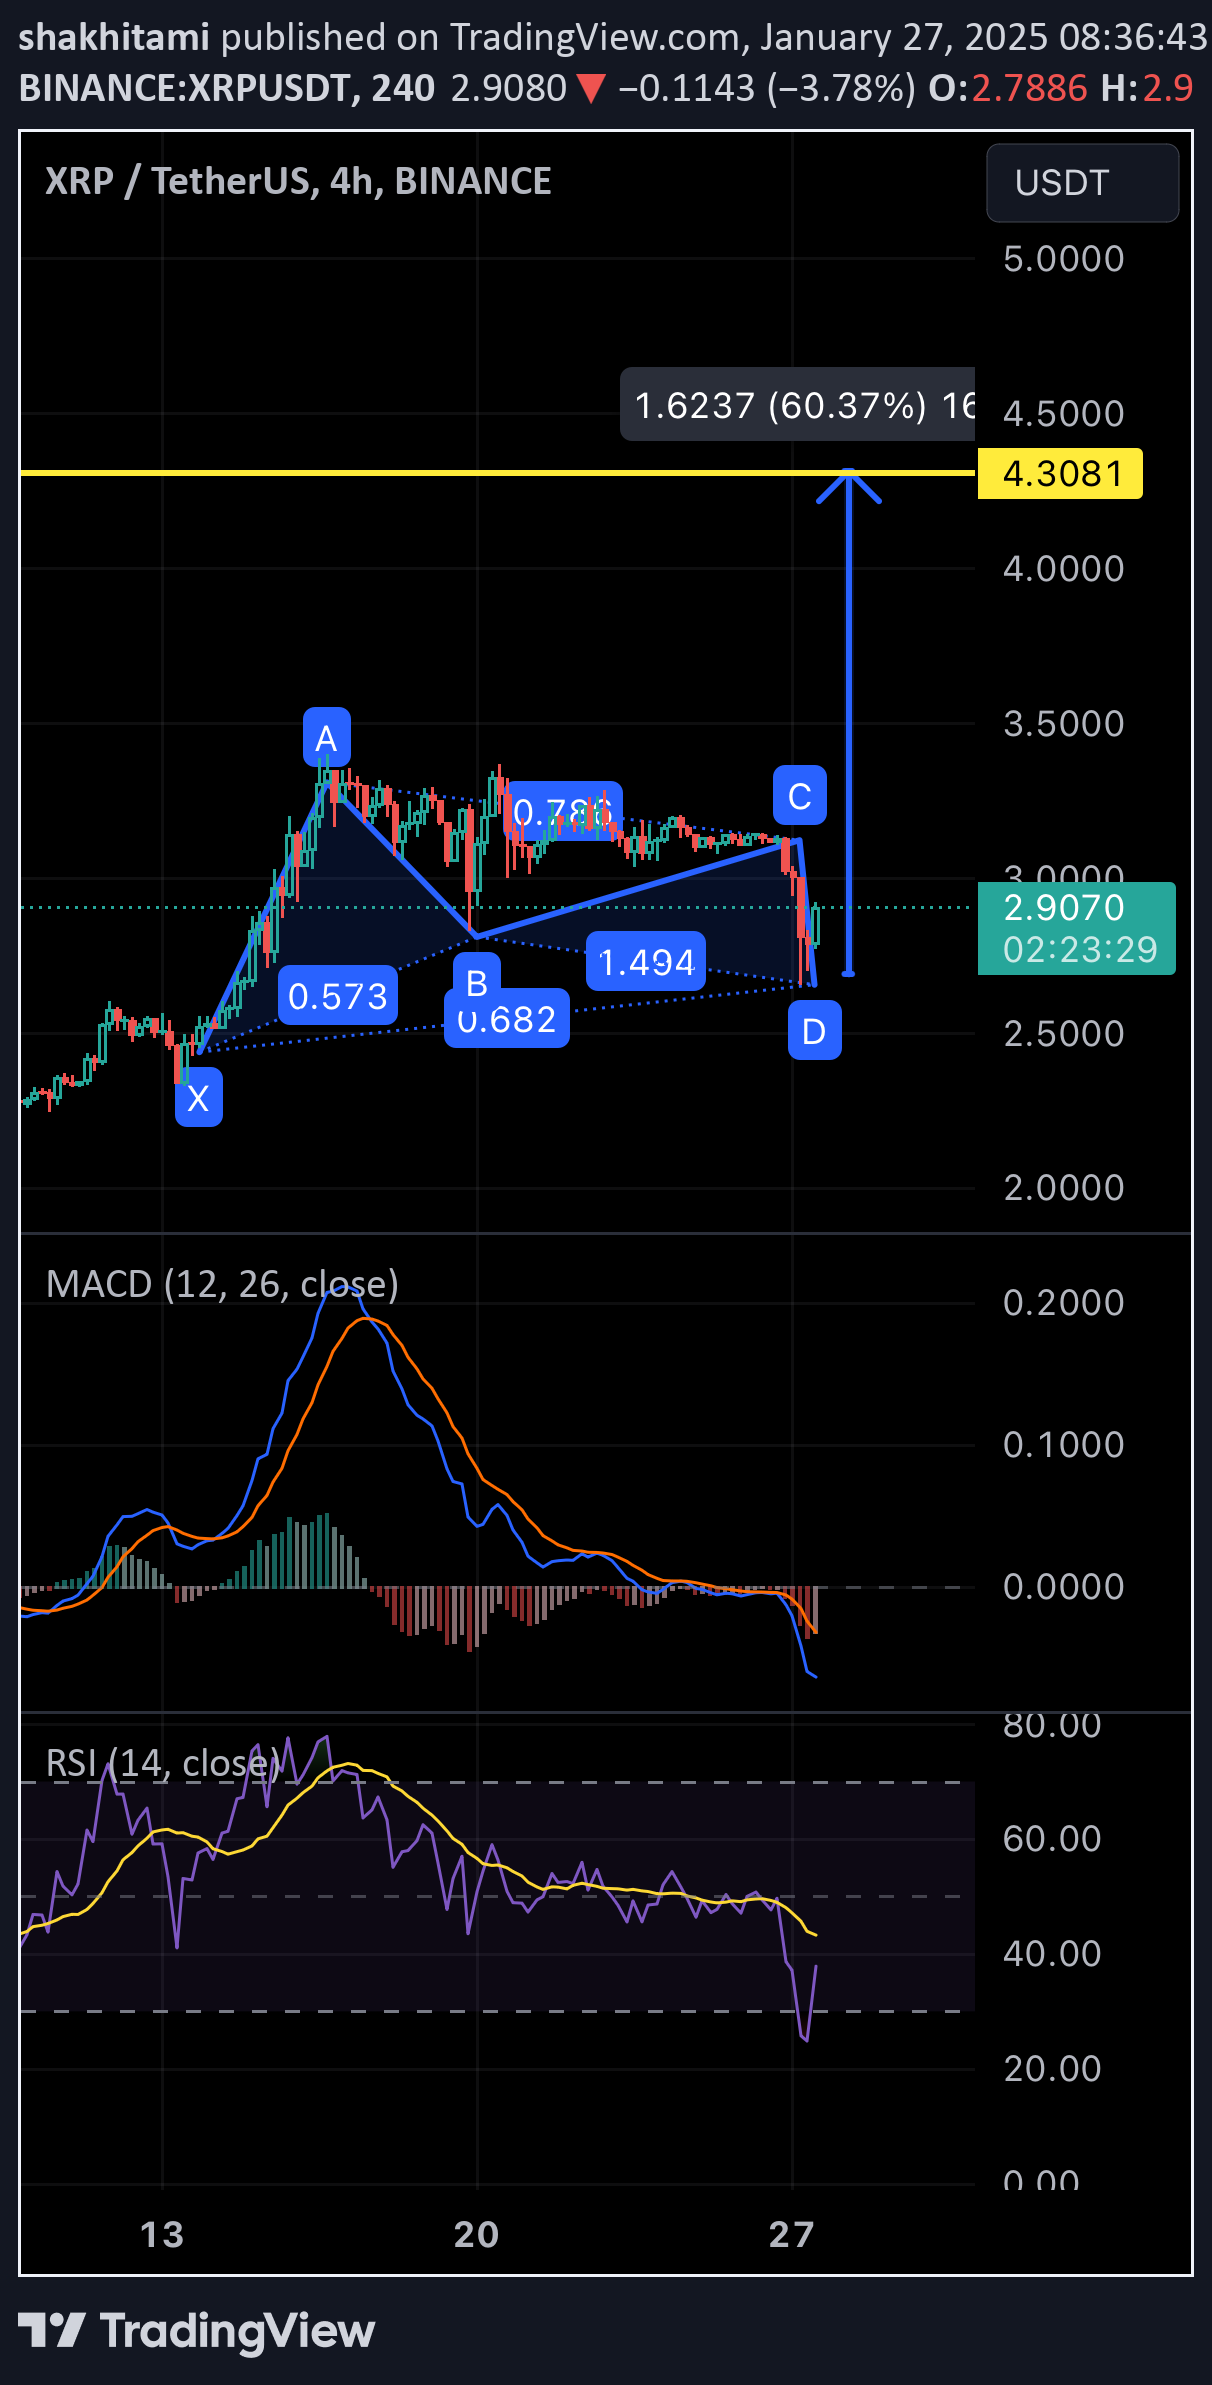
In this chart, a harmonic pattern called the “Butterfly Pattern” is visible, with key points labeled as X, A, B, C, and D. Here’s a brief explanation of the components:1.Harmonic Pattern:•The pattern is based on specific Fibonacci ratios. The levels indicate that the price may potentially reverse upward from point D.•Point D is typically where the price is expected to react.2.MACD:•The MACD indicator at the bottom shows momentum changes. The blue and orange lines moving downward indicate decreasing buying power.3.RSI:•The RSI indicator is in oversold territory (below 30), suggesting a potential reversal in the price.4.Price Target:•The blue arrow and the yellow line at the top indicate a potential price target (4.3081). This target is based on technical analysis and might represent a future resistance level.
