Technical analysis by shakhitami about Symbol ETH on 7/17/2025

shakhitami
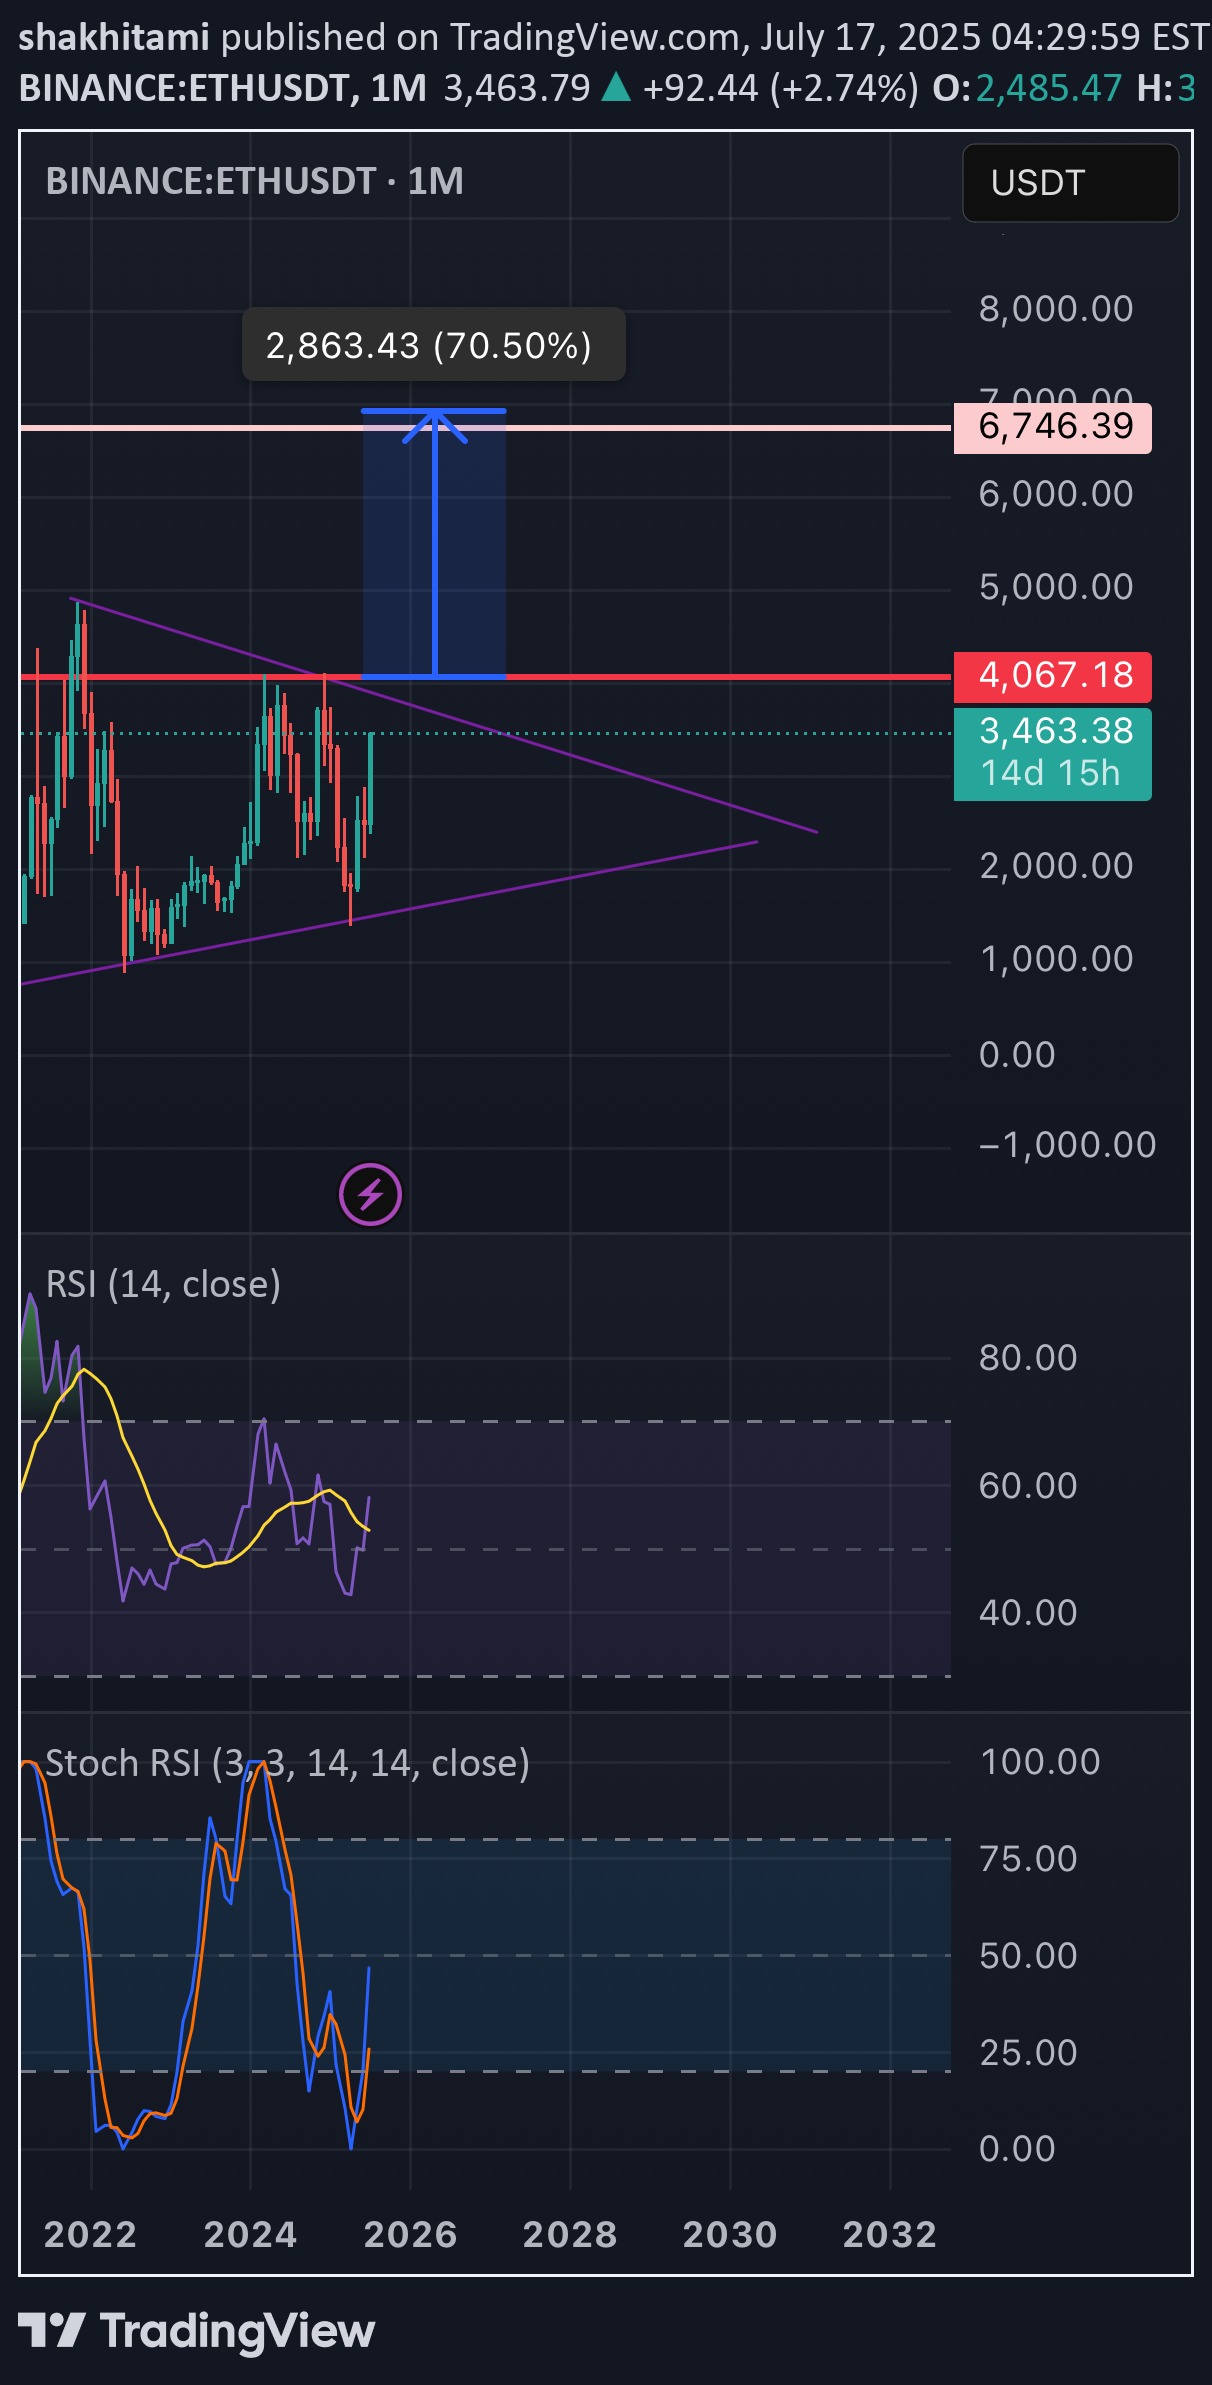
🟣 Ethereum Monthly Timeframe Analysis – Large Symmetrical Triangle 📌 Current Situation: •On the monthly chart (1M), Ethereum (ETH) has formed a large symmetrical triangle pattern. •This pattern typically signals a major price consolidation before a significant move. •The descending resistance line connects the 2021 all-time high to recent lower highs. •The ascending support line is drawn from the 2018 low through the 2022 bottom. •Price is nearing the apex of the triangle, indicating a breakout is likely soon. ⸻ 🔼 Bullish Scenario (Breakout to the Upside): If ETH breaks above the triangle resistance and confirms the move: ✅ Signs of a Bullish Continuation: •Strong breakout above the $4,000–$4,500 zone •Increased volume confirming breakout •Price holds above resistance-turned-support 🎯 Potential Price Targets by 2027 (based on triangle height & Fibonacci projections): 1.Target 1: $6,800 – $7,500 2.Target 2: $9,000 – $10,000 3.Long-term Target: $12,000 – $15,000 (if macro bull market continues) ⸻ 🔽 Bearish Scenario (Fakeout or Breakdown): If the breakout fails or price breaks down: •ETH could revisit lower supports around $2,000 or even $1,400 •Bullish momentum delayed until another strong base forms ⸻ 🔍 Conclusion: •This triangle could mark the beginning of a major rally into 2027, especially if supported by fundamentals (e.g., ETF approval, DeFi growth). •Wait for a confirmed breakout with volume and retest before entering a long-term position.
