
pollux3000
@t_pollux3000

What symbols does the trader recommend buying?
Purchase History
پیام های تریدر
Filter
pollux3000
XRP rally starting ?

Long term analysis - Monthly time frame XRPUSDT witnessed a completely stunning bullish explosion between March 2017 and January 2018. Since then XRP has been evolving in a multi-years triangle pattern coming to an end. The extremely flat and narrow Bollinger Bands hint at a potential explosive move. First part of this explosive move actually already happened during the last days and price is now encountering the triangle resistance line. This is a strong confirmation of market participant interests, let’s monitor the potential entry point on the lower time frame.Strategy - Short term analysisAll elements for a potential explosive move are gathered. It gives us a nice trade setup with a very good risk reward ratio.Buy on the break of the triangle resistance at 1.20$.Objective 1: back to the next resistance at 1.70$ (+40%)Objective 2: Following resistance at 3.25$ (+170%)Objective 3: ATH at 18$ (+1400%)Invalidation Mental Stop: below the last low of 1.05$ If prices retrace to this level we will wait for the daily close price then set a Stop loss ¼ or Risk below the weekly close price.Buy signal was given, let's monitor this trade closely 🚀
pollux3000
JUP entry set up

Long term analysis JUPUSDT is a relatively new project which witnessed a powerful bullish wave in the first quarter of 2024. Since then a 8 month consolidation followed which is attempting a breakout move. On the weekly timeframe we have a golden cross, flat and narrow Bollinger band and a potential breakout to watch closely in order to take a good trade entry setupPost Breakout StrategyBuy on the break out of the 1.25$ resistance to play the potential explosive move upward corresponding to the Vth Elliot wave:Objective 1: back to ATH at 1.70$ (+35%)Objective 2: Vth wave extension around 4.50$ zone (+250%)Objective 3: Trend following strategyInvalidation Mental Stop: below the last low of 1.03$ If prices retrace to this level we will wait for the daily close price then set a Stop loss ¼ or Risk below the weekly close price.Our invalidation scenario was triggered and trade closed around 1$ We took a loss of 20% of this trade. Let's move on and focus on our next opportunities.
pollux3000
WLD trade setup

Long term analysis WLDUSDT witnessed a powerful bullish wave between July 2023 and March 2024. A corrective wave (around -90%) followed and formed a consolidation range on the weekly time fram. This range has formed an inverted Head and Shoulder pattern. The narrow Bollinger bands and the recent golden cross hint at a potential explosive move. StrategyBuy on the break of the H&S pattern neck line at 2.50$ or wait for a daily close above the weekly Bollinger Bands:Objective 1: back to the next resistance at 4.25$ (+70%)Objective 2: Following resistance at 6.5$ (+160%)Objective 3: ATH at 12$ (+380%)Invalidation Mental Stop: below the last low of 2.12$ If prices retrace to this level we will wait for the daily close price then set a Stop loss ¼ or Risk below the daily close price.Buy signal just flashed, let's monitor the tradeWLD was very close (1% short) to our first objective. The price then retrace and triggered our protective stop at 3.45$. Market exit around 35% for this trade. Let's move on and focus on our next opportunities.
pollux3000
WLD trade entry

Weekly timeframe WLDUSDT witnessed a powerful bullish wave between November 2023 and March 2024. Then a corrective wave (around -70%) followed and formed a multi-month consolidation range. Check out how this range has formed an inverted "Head & Shoulder" pattern just above the overlap level. The flat and narrow bollinger bands hint at a potential explosive move. All ingredient are there for an interesting trade setup.StrategyBuy on the break of the resistance line at 43,10$Objective 1: back to the next resistance at 60$ (+40%)Objective 2: ATH region at 90$ (+110%)Objective 3: Trend following strategyInvalidation Mental Stop: below the last low of 39,30$ If prices retrace to this level we will wait for the daily close price then set a Stop loss ¼ or Risk below the weekly close price. This would invalidate the breakout scenario.
pollux3000
STX trade idea

Long term analysisThis analysis is based on last year's trade entry analysis that you can read here. STXUSDT is currently in the corrective wave IV of the last powerful bullish leg started around the beginning of 2023. It is also one of the rare coins which broke it ATH sooner this year, showing a very strong momentum.The IV wave is finishing its stabilization within a clear triangle pattern (abcde) potentially coming to an end soon. The golden cross and flat bollinger bands replay a very similar situation than last year (see link above) offering us a new potential trade set up. StrategyBuy on the break of the resistance line at 2$Objective 1: back to the next resistance at 2,40$ (+20%)Objective 2: ATH at 4$ (+100%)Objective 3: Fifth wave extension region around 8-10$ (+300-400%)Invalidation Mental Stop: below the last low of 1,60$ If prices retrace to this level we will wait for the weekly closing price then set a Stop loss ¼ or Risk below the weekly close price.
pollux3000
LINK trade setup

Weekly analysis LINKUSDT was one of the winner of 2021 bull run.After a 90% decrease since the last ATH, LINK built a strong and clear horizontal range which was broken in Octobre 2023 with a strong 300% upward movement. This proves the coin is still under investors' radars.Current situationSince this last Octobre surge, LINK has been consolidating and is now forming a reversal pattern just above the previous range resistance. This pattern seems to be coming to an end (ABCDE waves) with the current attempt to break out.StrategyBuy signal on the clear breakout and daily close above the 12,40$ horizontal resistance line.Objective 1: Next resistance 15$ (+15%) Objective 2: Last swing high at 22$ (+70%) Objective 3: ATH area at 35$ (+170%) Invalidation Mental Stop: just below the latest move upward at 12$ which would invalidate the breakout attempt.This setup proposes a nice Risk Reward ratio.If prices retrace to this stop level we will wait for the weekly closing price then set a Stop loss ¼ or Risk below the weekly close price.Risk = Distance between Mental stop and entry point.The expected buy signal was given on the 8th at around 13$ Now let's follow the trade closely.
pollux3000
SOL Trade set up

Weekly: long term analysisSOLUSDT was one of the top gainers of the last altcoin bull run. After more than 95% deep correction during the bear market, SOL has almost regained its ATH in a strong impulsive upward movement from last October to last March. Since then SOL is consolidating within a perfectly defined range [120$ - 190$]. On a weekly time frame we can see the volatility decreasing and bollinger bands are now narrowed and totally flat. This is a perfect setup for a trade entry.StrategyBuy signal will be given from a daily close above the resistance line (neckline of the inverted H&S) around the 10$ mark.Objective 1: ATH at 250$ ( +25%)Objective 2: Small Flag pole target at 500$ zone (+150%)Objective 3: Big flag pole extension and under Cup & Handle target around 1600$ (+700%)Invalidation Mental Stop: just below the last weekly swing low. This setup proposes a nice Risk RewardIf prices retrace to this stop level we will wait for the weekly closing price then set a Stop loss ¼ or Risk below the weekly close price.Risk = Distance between Mental stop and entry point.Correction of the buy signal Buy signal will be given from a daily close above the resistance line around the 200$ mark (removing the extra words after that which are copy/paste error)Buy signal was given yesterday. Let's follow the trade closely.
pollux3000
ENJ trade setup
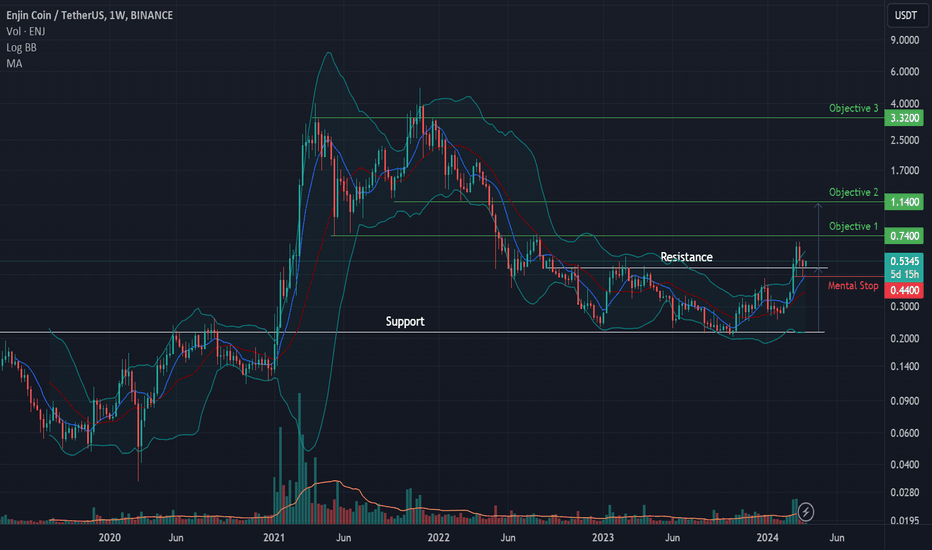
Weekly: long term analysisAfter more than 95% deep correction during the bear market, ENJUSDT is confirming a reversal attempt on a weekly time frame. Volumes are increasing and hinting a reversal completion.Short term analysisThe breakout of the resistance line happened at the beginning of March. Then we witnessed a nice pullback which confirmed the resistance is now acting as a support line. This offers us a good risk/reward setup to enter.StrategyBuy signal has been given from the bounce at the resistance line, entry is taken at this level around the 0.535$ markObjective 1: Next resistance line (with Risk/Reward >2) at 0.74$ ( +38%)Objective 2: Next resistance around corresponding to the reversal pattern swing move target at the 1.14$ zone (+110%)Objective 3: Near the weekly ATH at 3.32$ ( +500%)Invalidation Mental Stop: just below the recent daily swing low. This setup proposes a nice Risk RewardIf prices retrace to this stop level we will wait for the weekly closing price then set a Stop loss ¼ or Risk below the weekly close price.Risk = Distance between Mental stop and entry point.Our mental stop was quickly touch then real stop was executed at 0.40$ on the 8th of April. We are out of this trade with a controlled loss of 25%. Let's move on and focus on our next opportunities.
pollux3000
GLMR trade setup
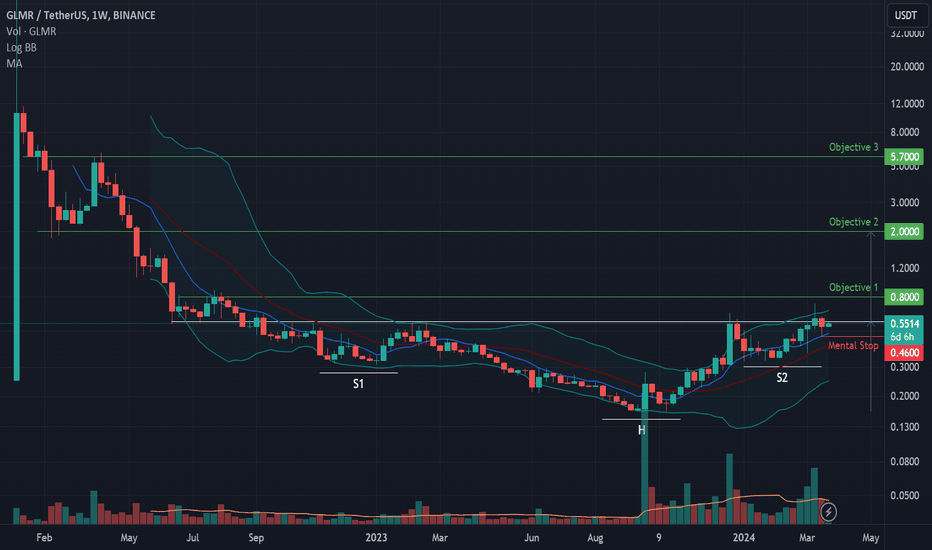
Weekly: long term analysisAfter more than 95% deep correction during the bear market, GLMRUSDT is building a reversal Head&Shoulder on a weekly time frame. Volumes are increasing since the All Time Low corresponding to the Head of the pattern and is following perfectly the H&S psychological structure. Short term analysisThe inverted H&S pattern is attempting a breakout upward. If this breakout is confirmed, prices can start a strong upward move based on previous price action of GLMR. The latest higher low contracted the price’s volatility and offer us a good risk/reward setup.StrategyBuy signal will be given from a daily weekly close above the resistance line (neckline of the inverted H&S) around the 0.56$ mark.Objective 1: Next resistance line (with Risk/Reward =3) at 0.8$ ( +45%)Objective 2: Next resistance around corresponding to the H&S swing move target at the 2$ zone (+260%)Objective 3: Next resistance line at 5.7$ ( +900%)Invalidation Mental Stop: just below the recent daily swing low. This setup proposes a nice Risk RewardIf prices retrace to this stop level we will wait for the daily closing price then set a Stop loss ¼ or Risk below the weekly close price.Risk = Distance between Mental stop and entry point.Our mental stop was quickly touch then real stop was executed at 0.44$ on the 2nd of April. We are out of this trade with a controlled loss of 20%. Let's move on and focus on our next opportunities.
pollux3000
SUSHI trade setup

Weekly: long term analysisAfter around 95% deep correction during the bear market, SUSHIUSDT has revisited its lower point from which we can identify a reverse H&S pattern. This pattern is characteristic of a trend reversal when formed on a strong support. Let's have a closer look on shorter timeframeDaily: short term analysisIncreasing volumes on the upward movements and decreasing ones when prices decrease are also very characteristic of such a pattern and reveal the psychology of the market participants.StrategyBuy signal has been given on the weekly close above the horizontal resistance line around 1,8$.Objective 1: Nearest resistance line at 2,80$ (+50%)Objective 2: H&S target + next resistance at 4,98$ (+170%)Objective 3: Next resistance at 10,56$ (+480%)Invalidation Mental Stop: just below the last consolidation low at 1,33$. This setup proposes a nice Risk RewardIf prices retrace to this stop level we will wait for the weekly closing price then set a Stop loss ¼ or Risk below the weekly close price.Risk = Distance between Mental stop and entry point.Our mental stop was quickly touch then real stop was executed at 1.33$ on the 8th of April. We are out of this trade with a controlled loss of 25%. Let's move on and focus on our next opportunities.
Disclaimer
Any content and materials included in Sahmeto's website and official communication channels are a compilation of personal opinions and analyses and are not binding. They do not constitute any recommendation for buying, selling, entering or exiting the stock market and cryptocurrency market. Also, all news and analyses included in the website and channels are merely republished information from official and unofficial domestic and foreign sources, and it is obvious that users of the said content are responsible for following up and ensuring the authenticity and accuracy of the materials. Therefore, while disclaiming responsibility, it is declared that the responsibility for any decision-making, action, and potential profit and loss in the capital market and cryptocurrency market lies with the trader.