
pakoumal
@t_pakoumal

What symbols does the trader recommend buying?
Purchase History
پیام های تریدر
Filter
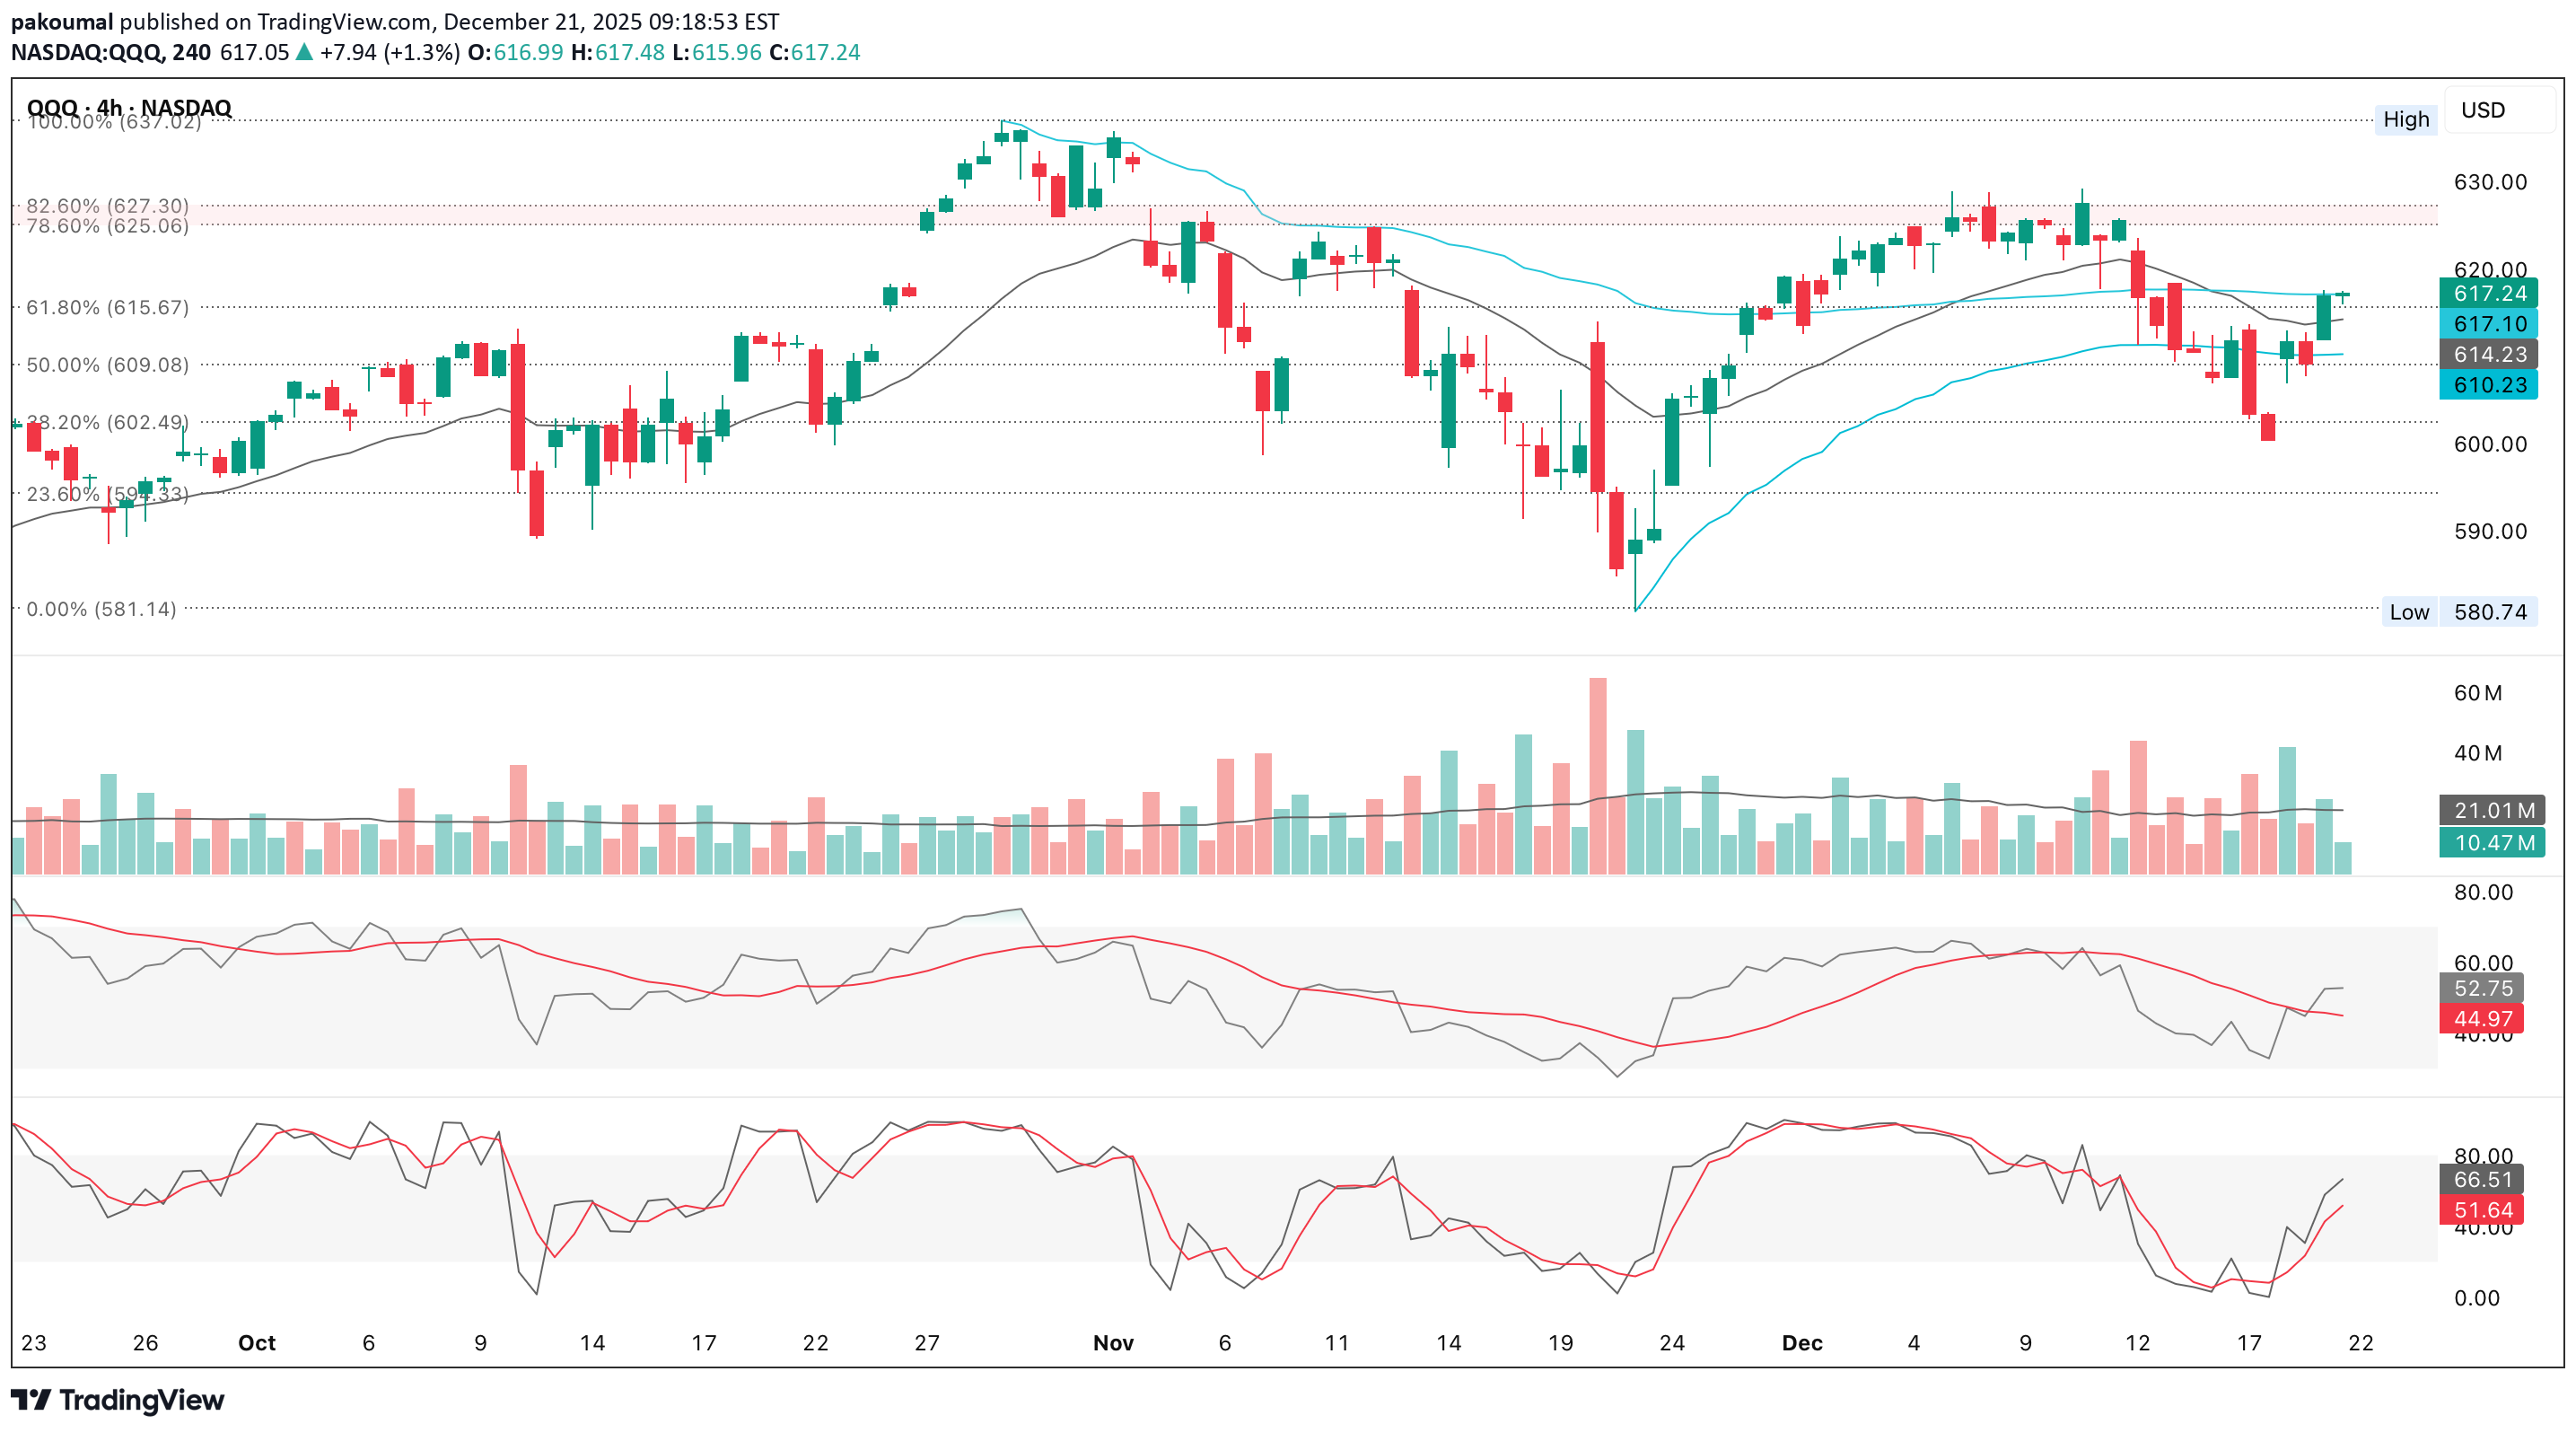
تحلیل هفتگی بازار: چرا QQQ شما را کلافه خواهد کرد؟ (پیشبینی 5 ژانویه)

Right now, QQQ is doing exactly what strong markets do before a decision, frustrate Price is making higher lows, but lower highs since that peak which is a classic trend continuation A sustained closes below the 50d, especially with volume opens path to 100d (~$602) Trend is still up, momentum is cooling & volatility is contracting & will likely resolve with a range expansion — determined by which side breaks first & without expansion, any move is suspect Current price (~$613) is just above value between ~$608–$612 Low volume above makes upside easier if buyers step in If price dips into $608–$612, buyers are statistically likely to defend Acceptance below ~$608 would flip the profile bearish short-term Acceptance above ~$620 favors a push back to range highs This supports a range-bound week, unless a catalyst appears The upside is capped without expansion & the downside is contained unless trend breaks The SMH/QQQ ratio is making new highs & accelerating above its rising MA Semiconductors are outperforming QQQ decisively Leadership is narrow, but powerful This is not what a market looks like before a broad rollover Key nuance is the the slope is steep → short-term stretched, but the trend is intact, not diverging As long as SMH/QQQ stays above its rising MA & does not break structure, QQQ pullbacks are statistically buyable, not trend-ending & this directly lowers the probability of a deep QQQ breakdown this week AAPL is dead weight, but not breaking down so it’s a drag, not a threat MSFT is actively subtracting from QQQ & this explains why QQQ hasn’t followed semis higher since MSFT weakness alone does not break QQQ unless others follow NVDA is supportive, not explosive & that aligns perfectly with SMH strength/QQQ compression instead of breakout so NVDA is acting as a stabilizer, which again argues against downside acceleration META shows not indication of trend failure PLTR supports risk appetite, even with volatility TSLA is a headwind, but it has been one for months — nothing new here Sideways-to-up within range (≈60–65%) QQQ holds ~$608–$612 Rotates between $610–$625 Fails to break down despite weak MSFT Any dip bought quickly This is exactly what strong SMH/QQQ ratios usually produce Bullish Expansion (≈25%) Break above ~$625 → $632–$637 Would require MSFT stabilizing (not even rallying), NVDA pushing toward range highs & SMH/QQQ staying bid If this triggers, QQQ likely tags ATH liquidity fast Bearish Breakdown (≈10–15%) Loss of ~$608 → test ~$602 Requires SMH/QQQ rolling over (not happening yet), NVDA losing $180 decisively & MSFT accelerating lower Without those, downside probably stays contained & corrective Risk is SMH/QQQ below its MA ( reassess everything ), NVDA < ~$180 (QQQ downside risk increases) & MSFT < ~&470 (pressure, but still not fatal alone) Semis are carrying the tape QQQ is more likely to frustrate both bulls & bears this week than trend hard AAPL META MSFT NVDA PLTR TSLA SPY QQQ
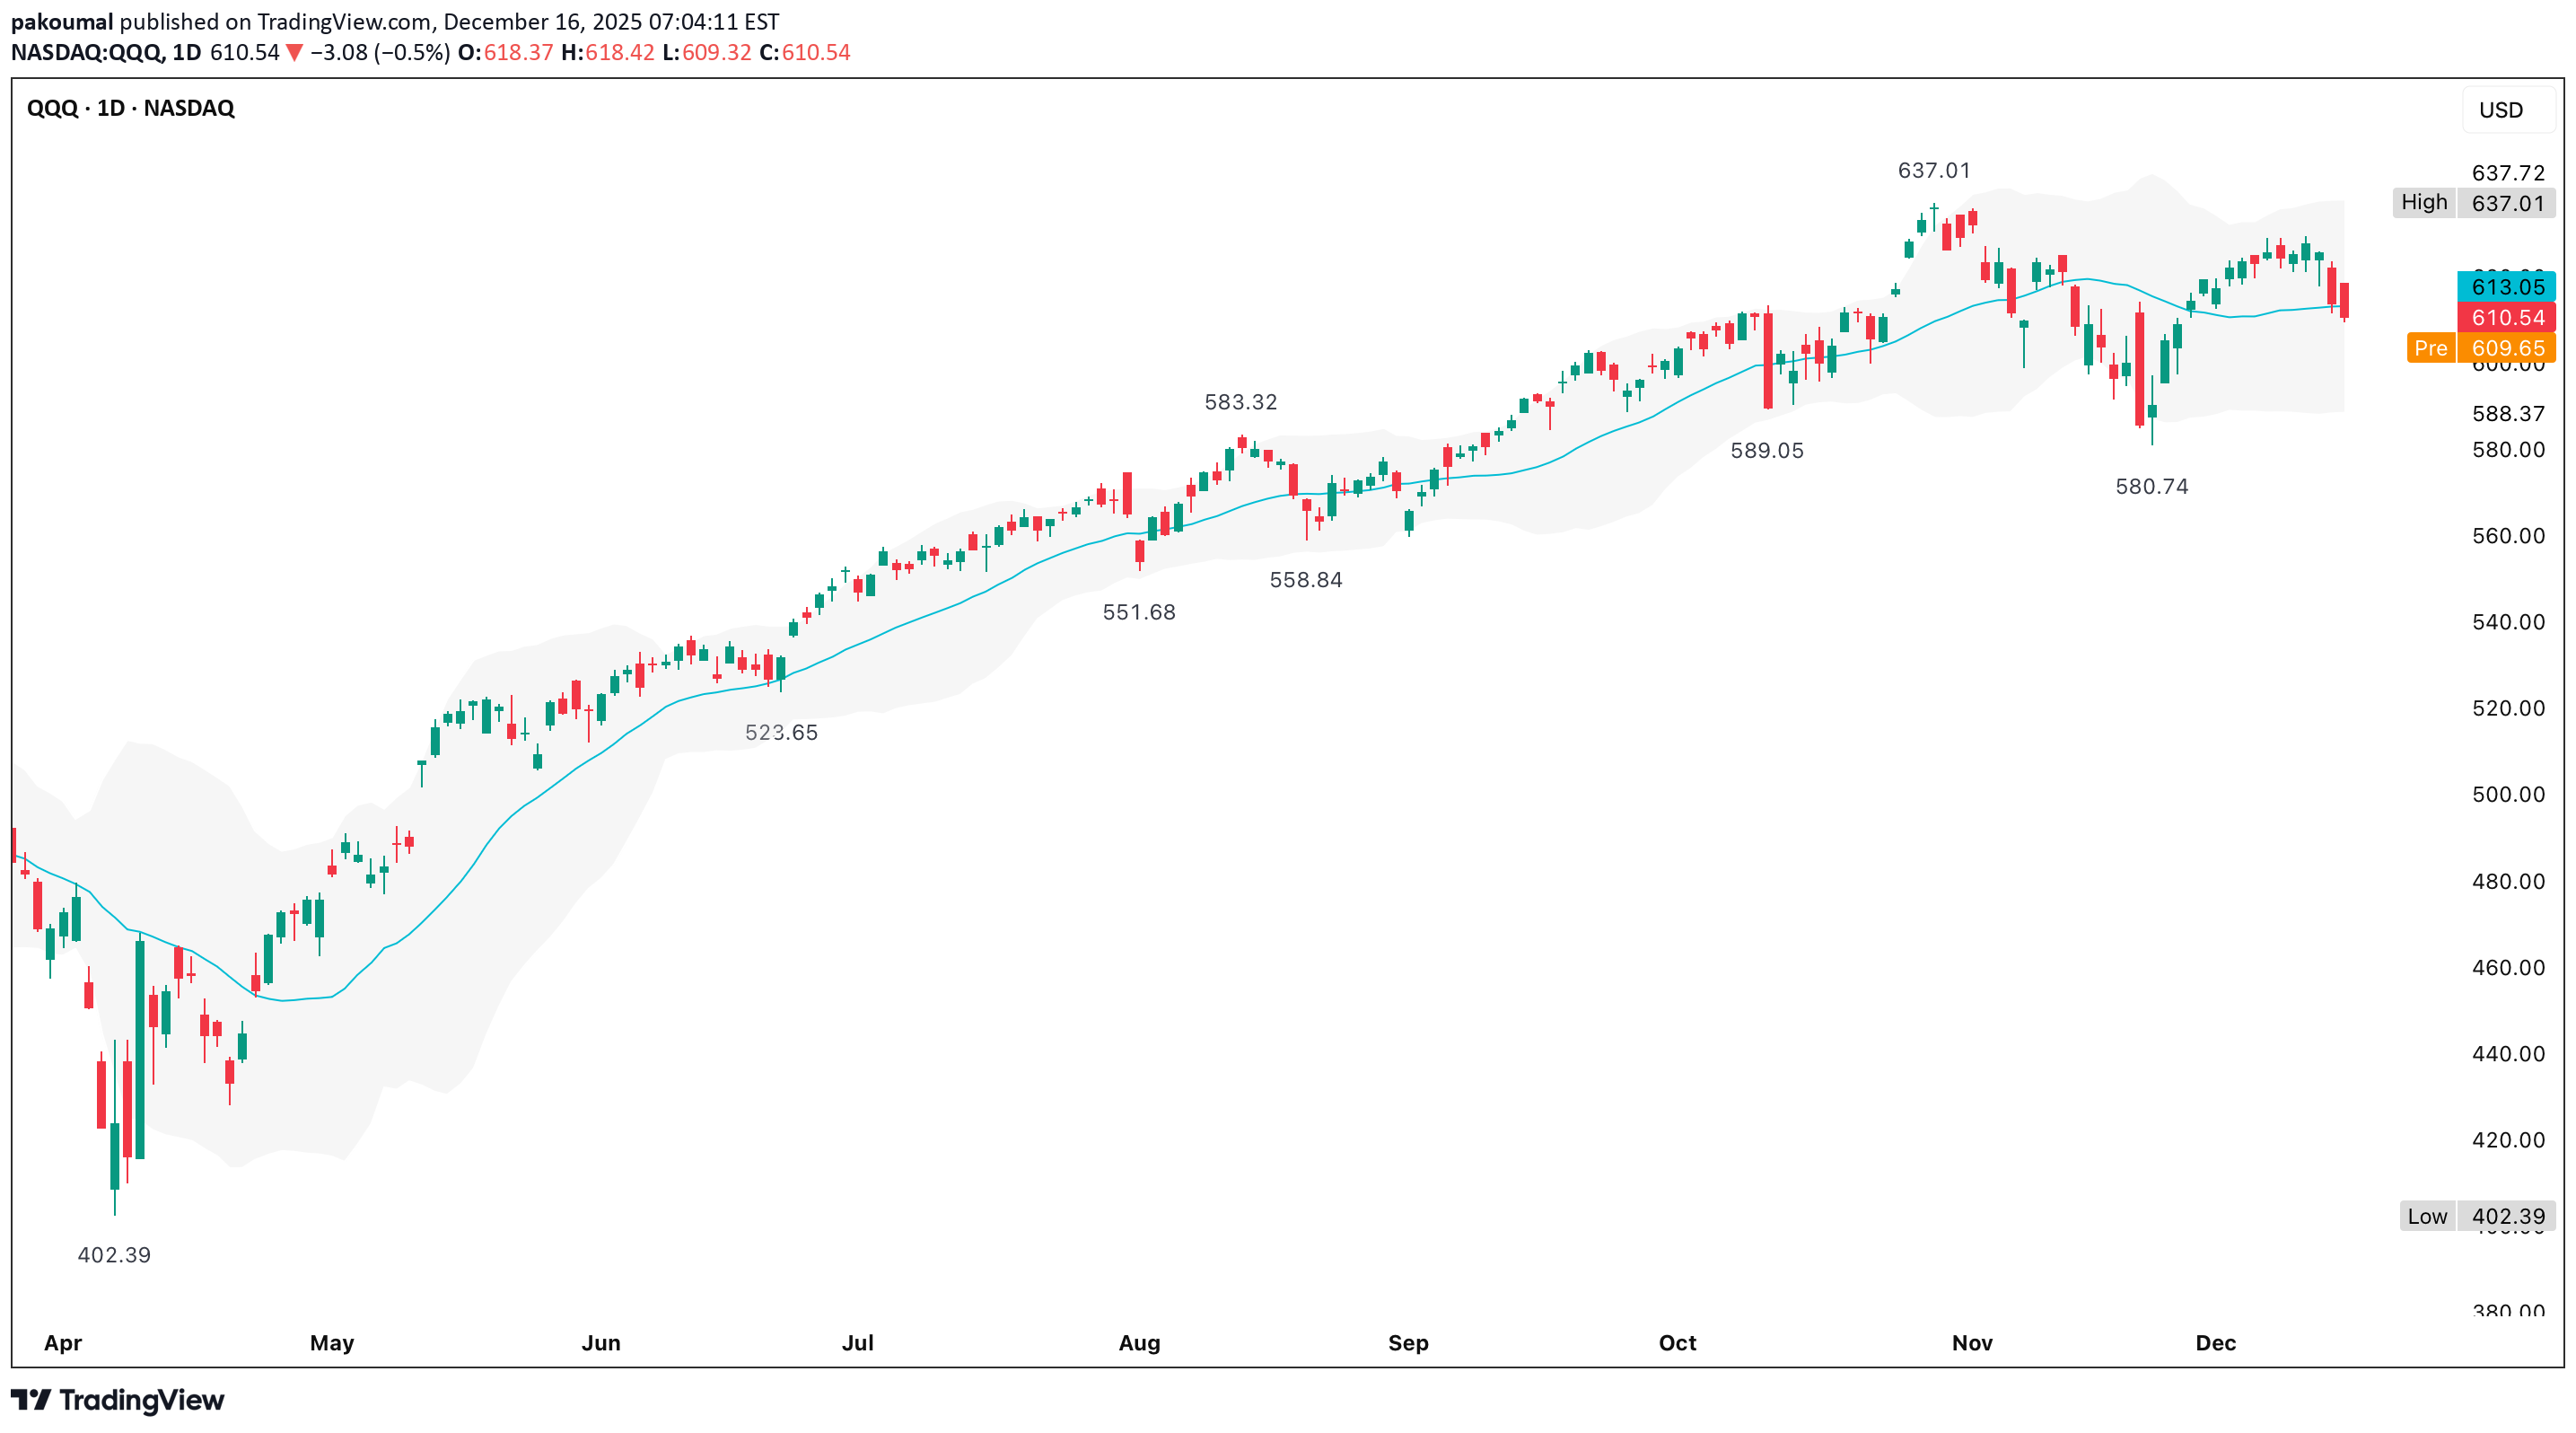
QQQ (26 December)

The primary trend is up (clear series of higher highs/higher lows since the April low ~$402) Consolidation near highs, not rejection Roughly $600-$637 over the last ~6 weeks Price remains above the rising 20d MA with a positive slope Pullbacks are being absorbed above prior swing lows, not slicing through them Bands have narrowed materially versus October-November Compression at highs statistically favors expansion This is a trend pause, not a topping pattern; unless, structure breaks As long as $600 holds, bearish narratives are premature (your default bias should not be bearish) 1. If price closes above $637 Treat it as trend continuation Expect expansion, not grind Favor breakout participation, not fading 2. If price stays between $600-$637 Market is neutral/range-bound Favor premium-selling or reduced sizing Avoid directional conviction 3. If price closes below $600 Bull trend is structurally damaged Long exposure becomes tactical, not core Expect a deeper reset toward $580 to $550 There is no valid bearish thesis above $600 Breakout Play ($637+) Entry on daily close >$637 with an optional add-on first pullback holding $630-$632 Invalidation occurs with a daily close back below $630 This is a volatility expansion trade, not a slow trend add Pullback Buy ($600-$615) Entry on a red day into $600-$615 Followed by a bullish daily candle (not intraday noise) Stop on a daily close <$600 = exit, no debate It aligns with prior breakout, rising MAs & prior demand response ($580.74) Defensive Shift (<$600) Reduce net delta Add downside hedge or short-term short exposure Expect an increase in volatility & mean-reversion fails 1. Above $637 → directional Call debit spreads (30-60 DTE) Avoid naked calls (IV expansion risk cuts both ways) 2. Inside $600-$637 → income Iron condors Put credit spreads only above $600 3. Near $600 → asymmetric long Cash-secured puts ($600 or $610) Assigned at structural support as a worst-case 4. Below $600 → insurance/hedge Put debit spreads Avoid selling downside premium Ask yourself at the end of each week, Did QQQ close above or below $600? Did it make a higher high or higher low? Is the daily MA still rising? Did volatility expand or contract? Your edge comes from waiting for the level to decide, not trying to anticipate it
QQQ (19 December)
As long as QQQ holds $612, downside risk is fading & acceptance above $618 turns this from a bounce into a base Higher lows are forming from ~$600 to ~$612-$615 Price is holding above reclaimed value ($612-$615) across time frames This invalidates the immediate bearish breakdown scenario RSI is bullish continuation momentum, not mean-reversion Stoch is overbought on lower time frames, but it's not a sell signal unless price breaks support Momentum is supporting price, not diverging against it Volume expansion on the push through $612 No heavy sell-volume on pauses This is controlled buying, not short covering only which boosts the strength of the bounce 1. $615 is now critical support & must hold on pullbacks If price holds $615, the market is building a base 2. Expect chop at $618-$620 Rejection only matters if price falls back below $615 3. $625 If $620 breaks with acceptance, price likely moves here quickly This would strongly favor a bullish continuation 4. Loss of $615, then loss of $612 would put price back into balance/chop - not yet trend failure, but bad for short-dated calls As long as $615 holds, staying bullish is justified The market has shifted from risk of a bounce failure to building a base Bears lost control at $612 Bulls need $620+ to fully take it back Now it’s about whether momentum follows through quickly enough
QQQ Market Open Playbook
The dominant structure from October-November is still up, but momentum has clearly rolled Price is now below the anchored VWAP from the November high & hovering just above the VWAP from the November low This is no longer trend-following territory It’s range/distribution behavior unless reclaimed quickly RSI ~mid-50s rolling down; stochastic deeply oversold & still pointing lower so downside pressure not yet exhausted Failure to hold ~$608-$610 opens a measured move toward the $580-$585, which lines up with prior demand Bias (4H) is neutral to bearish unless VWAP(high) is reclaimed & held Rising wedge breakdown is clean & confirmed The post-break retest failed near $615-$618 Price is below both anchored VWAPs & the VWAP(high) is now acting as resistance Selling pressure increased on the breakdown, but follow-through has been orderly, not panicked, which suggests controlled distribution, not capitulation RSI mid-30s & trending lower; stochastic pinned low so no bullish divergence Bias (1H) is bearish continuation unless price reclaims ~$613-$615 with volume Important nuance is that falling wedges only resolve bullish if they break with expansion & right now, volume is not expanding meaningfully Double bottom attempt is structurally weak & 2nd low lacks momentum divergence confirmation Price is chopping under VWAP(high), which caps upside attempts 1. Bullish (lower probability right now) Hold $608-$610 Break & hold >$612 Target $615-$618 (VWAP(high) + prior supply) 2. Bearish (base case) Lose $608 Quick acceptance below $602, then $595, with $580-$585 as the larger 4H objective I’d reassess bearish bias if any 2 of the following occur, Reclaim & hold anchored VWAP from November high 1H RSI reclaims >50 & 15m breakout with clear volume expansion Until then, rallies look sell-able, not chase-able Premarket at ~$608.50 is sitting on a decision level, not a support you can trust blindly 1. Bearish continuation (base case) Short setup (preferred) Price below both anchored VWAPs, post–rising-wedge breakdown, weak momentum Entry $612-$615 VWAP(high) + prior breakdown shelf Ideal entry is rejection, not strength Stop (invalidation) >$618.50 (15m close) Above VWAP(high) + structure Anything above here negates bearish structure Targets $608 - range low $602-$600 - intraday liquidity $585-$580 - 4H objective, anchored VWAP(low) + prior demand What must be true Rallies are overlapping and low-volume VWAP(high) continues to reject RSI fails to reclaim 50 on 1H 2. Countertrend Long (only if conditions trigger) Long setup (reaction trade, not trend) Entry on a hold of $608-$610 after confirmation 15m >$612 Volume expansion on breakout No long if these 3 things don’t happen Stop <$607.80 Hard stop; no tolerance Targets $615.80-$618.00 (VWAP(high)/supply) $620-$622 only if acceptance above VWAP(high) This long is mean-reversion only so don't assume trend continuation unless price accepts above $618 3. High-timeframe (most important) $608.00 Holding above = range still alive Losing & accepting below = downside acceleration If you see fast move below $608, failed reclaim within 1-2 candles (15m), then that’s continuation, not a fakeout 1. Bearish alignment 1H RSI <45 VWAP(high) overhead 15m bounces on declining volume 2. Bullish shift (requires confirmation) 1H RSI >50 VWAP(high) reclaimed and held 15m breakout with volume > prior average No divergence = no guessing
QQQ Santa Rotation?
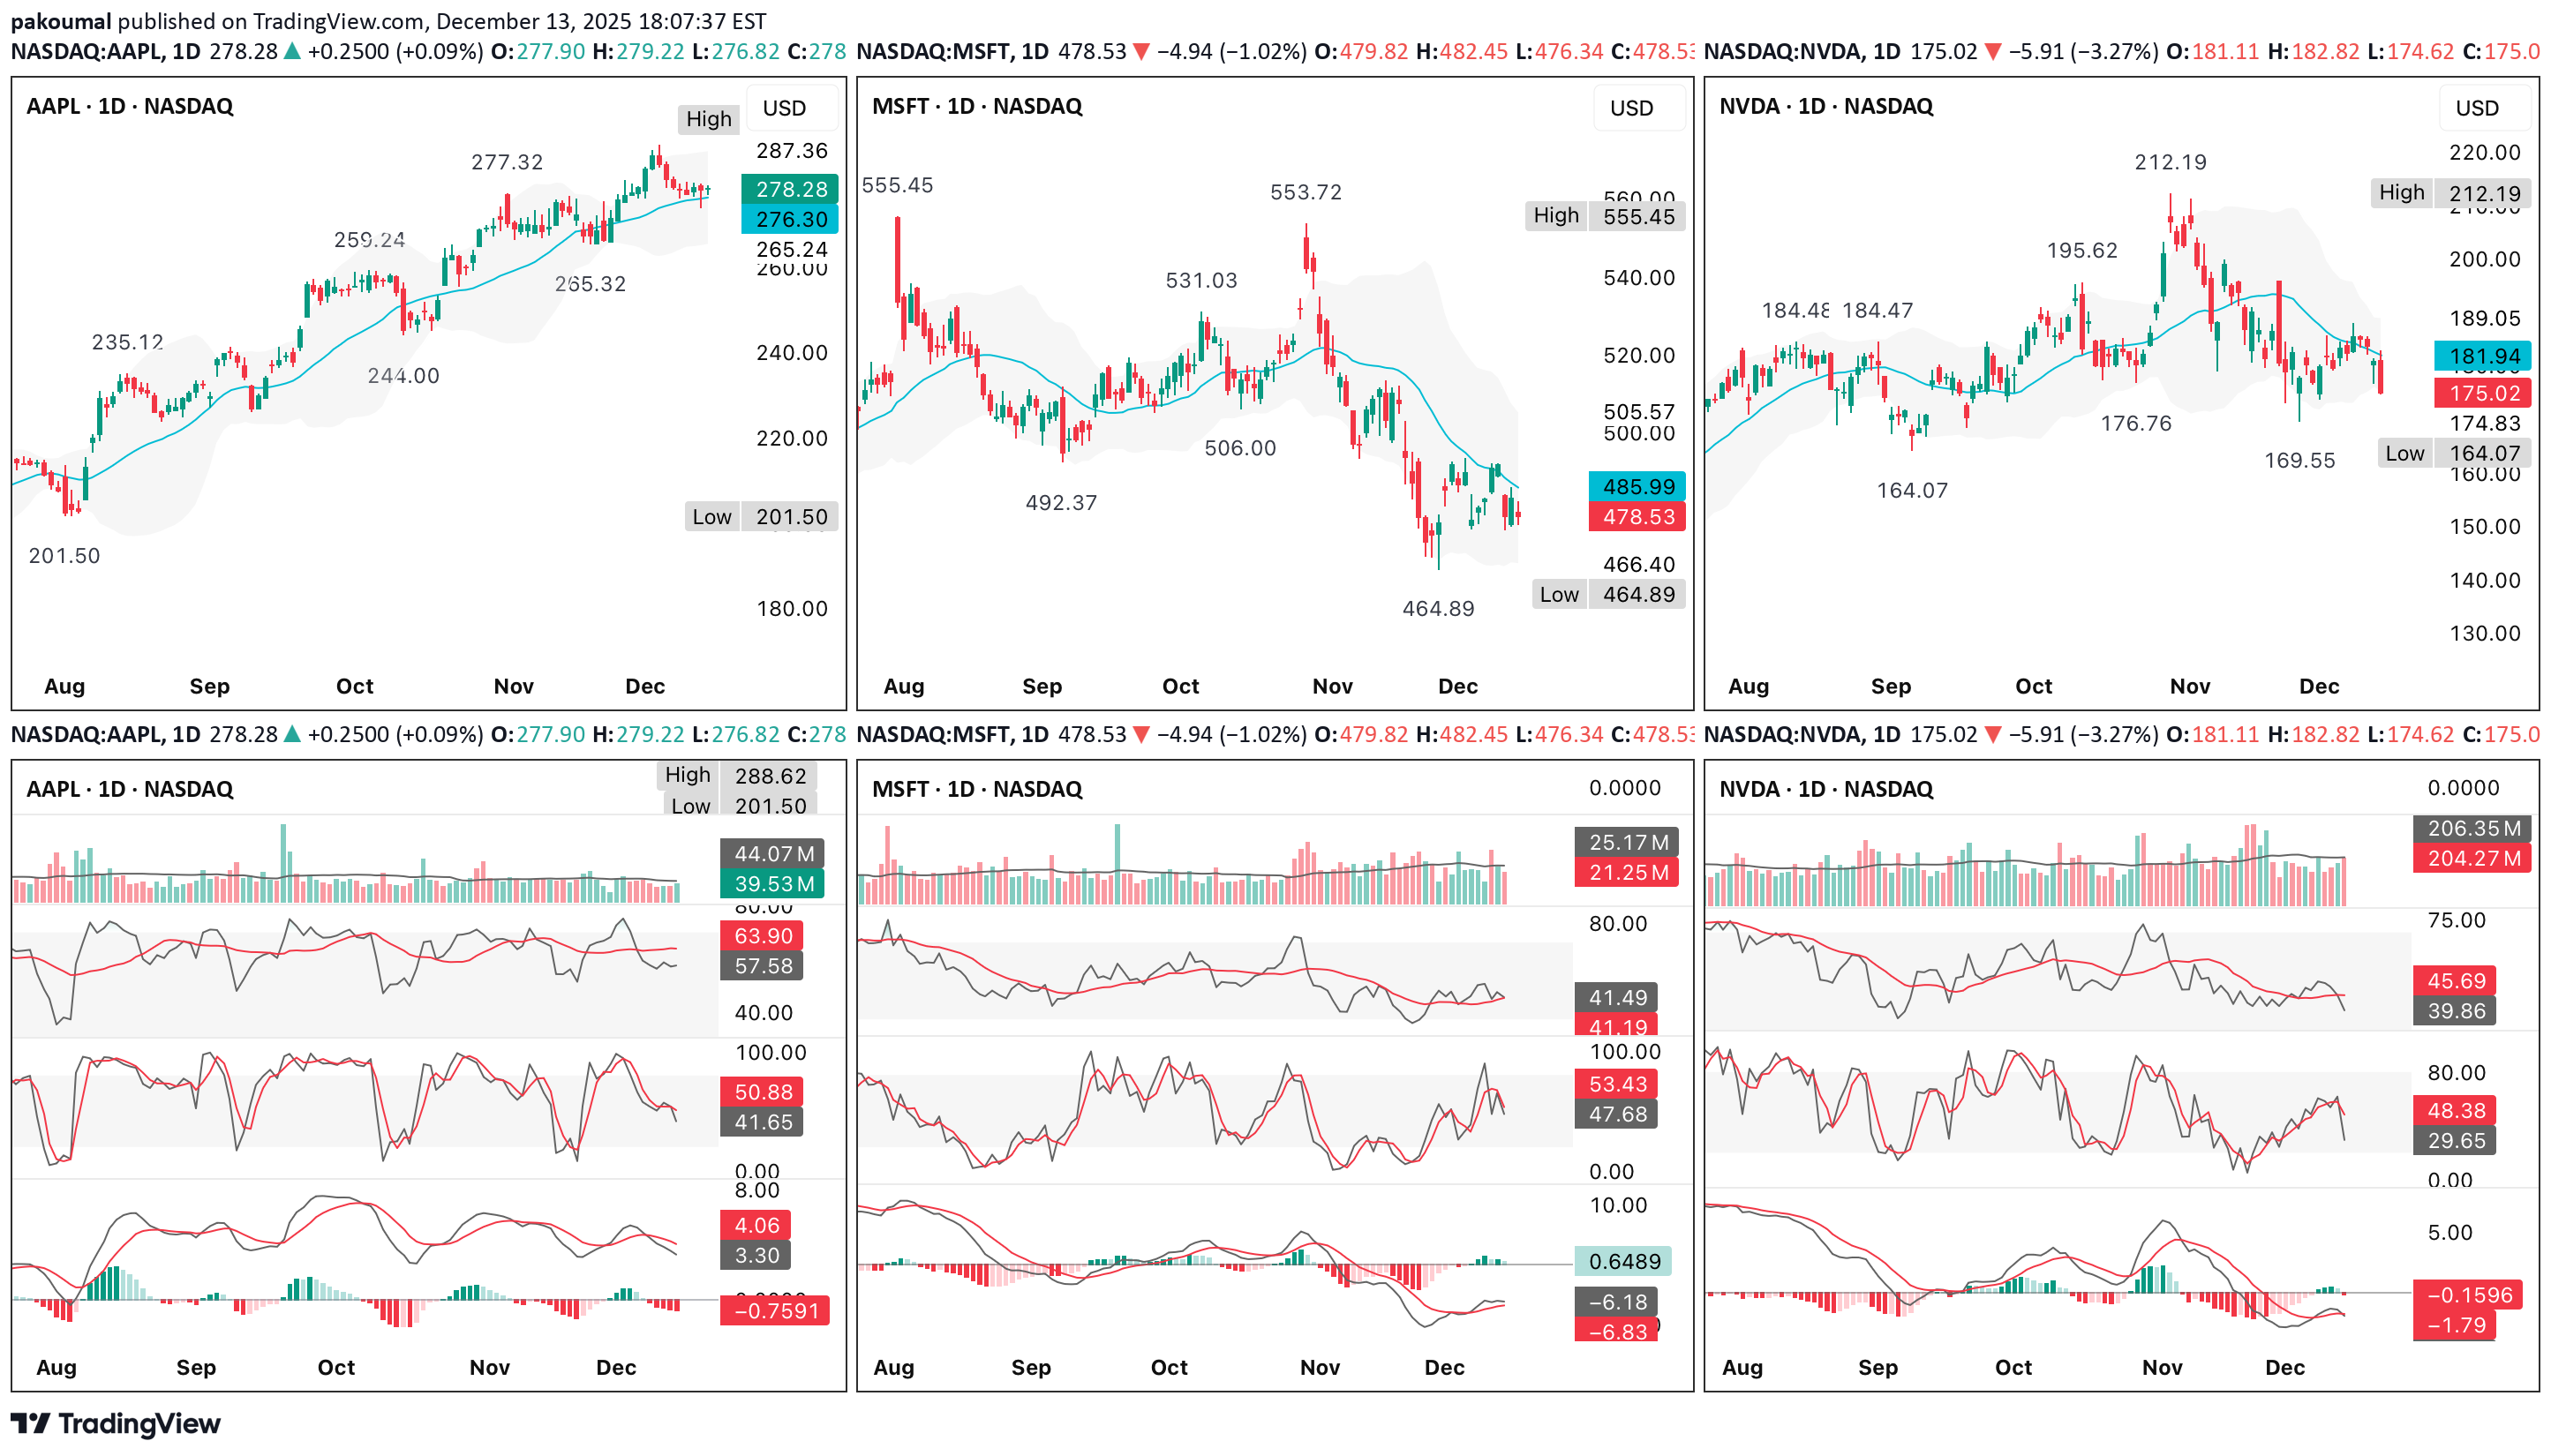
A look at the component charts lines up very cleanly with the broader QQQ direction into 2026 I am deliberately skeptical & weighting what usually leads, not what feels bullish/bearish emotionally 1. Clear leadership split or still acting well/potential leaders AAPL Above rising short-term MA, shallow pullback, no real momentum damage RSI mid–upper range, MACD only mildly negative This is not distribution behavior GOOGL Trend intact, pullback to rising MA, RSI still elevated Looks like digestion, not a trend break TSLA Relative strength standout Higher lows, bullish stochastic reset, MACD turning up This is classic “risk appetite not gone” behavior These names usually don’t hold up if a real index leg down is imminent 2. Neutral/repair mode AMZN Choppy range, sitting near mid-range support Momentum soft, but not breaking down META Sharp correction already occurred Now basing above recent lows; momentum trying to stabilize Damage done, but selling pressure clearly slowing These look more like already paid the price, not just starting to fall 3. Clear weak links NVDA Lower highs, weak bounce attempts, RSI sub-50 This is the most important chart psychologically MSFT Clean breakdown from November high Momentum still negative, rallies sold AVGO Earnings gap down with volume This is real distribution, not noise NFLX Continued downtrend, no strong reclaim yet These are dragging QQQ, but note that most of this damage is already visible, not hidden Breadth signals suggest that this is not a panic tape Across almost all charts RSI mostly 40-55, not 30s, stochastics cycling, not pinned & MACD negative but flattening, not accelerating, so this is controlled rotation, not liquidation If this were setting up a fast move to QQQ ~$590 immediately, you’d expect more RSIs < 35, more impulsive downside candles, & failed bounces across all mega-cap leaders This implies for QQQ that the most probable path (highest odds) is a bounce first, then decision Weak semis + MSFT = cap on upside AAPL/GOOGL/TSLA = downside protection That argues for a reflex rally (likely into $620-$625 area on QQQ) Followed by stall/compression, not instant ATHs Then a test of either higher low → Santa continuation or rollover to the $590s later A lower-probability, but valid alternative is if NVDA loses its recent lows decisively & AAPL breaks its rising MA Then the market probably hasn’t finished the reset That’s when the $590s become much more likely Right now, that confirmation is not present Forget narratives - these are the objective tells 1. Does NVDA fail another bounce under its 20-50d MA? If yes → drag continues 2. Does AAPL hold its rising MA on any dip? If yes → index downside limited 3. Does TSLA continue to make higher lows? Risk appetite intact if it does 4. Does AVGO stabilize instead of cascading? Big for semis sentiment If 2 of those 4 fail simultaneously, odds shift toward deeper downside If 3 of 4 hold, Santa odds rise materially This looks like a rotation-driven reset, not a market that’s done yet, but also not one about to collapse A bounce into mid/late December is the statistically cleaner path from these charts The real question is whether that bounce builds structure or fails quickly Market wants to rally, but breadth is questionable & that regime typically resolves 1 of 2 ways “Rotation Santa” (index grinds up even as laggards stay laggards) “Breadth rug pull” (leaders finally roll & index drops fast) If you get 3+ of these, odds tilt toward Santa succeeding even with semis weak & QQQ holds the prior swing low on the daily (no lower-low close) AAPL/GOOGL remain above their rising short-term trend (20ish day look) VIX is not making higher highs during down days (complacency returning) Down days are smaller-range than the earlier selloff (volatility compression) New lows list is not expanding while price chops (internal stabilization) If instead you get QQQ makes a lower-low close, AAPL breaks trend & fails the reclaim within 1-2 sessions & semis keep making fresh lows, then the “bounce to ~$620-$625 fade” becomes the base case & $590s stays in play You’re looking for structure + absorption, not fireworks into 23-27 December Higher low(s) on the 1H/4H while daily holds support Inside-day or breakout (tight range resolves up) Closes near the high of day on at least 2 of those sessions Up days on average/low volume is fine (holiday), but down days must be low volume too (no distribution) Leadership breadth improves slightly & you don’t need semis to lead, you just need fewer new breakdowns RSI on QQQ stabilizes above ~45-50 & slopes up MACD histogram stops getting more negative (flattening is enough) If you see that, the “Santa can start” signal is basically reset done = volatility compresses + leaders stop breaking + QQQ holds the low 23-27 December tells of what a failed Santa attempt looks like - this is the “looks fine… until it doesn’t” pattern Gap up/early strength gets sold & closes mid-to-low range (2+ times) Failure at a key reclaim level (prior breakdown level or VWAP zone) within 24-48 hours One big trend day down that breaks the range (holiday weeks hate that & if it happens, it’s meaningful) Semis continue to make new lows & it starts pulling down the “strong ones” (AAPL breaks trend, GOOGL loses MA, etc) Breadth worsens while index is flat/up (classic divergence) If that happens, the most common path is quick rejection from the bounce zone (~$620-$625 area), then a liquidation leg toward the next major support (~$590) The 3 “reset is done” triggers that I actually use QQQ higher low + reclaim of the prior day’s VWAP/anchored VWAP AAPL doesn't lose its rising trend on a closing basis (or loses/reclaims within 1 day) NVDA stops making lower lows (it can stay weak, but it just can’t keep accelerating down) QQQ AAPL AMZN AVGO GOOGL META MSFT NFLX NVDA TSLA
QQQ (12 December)
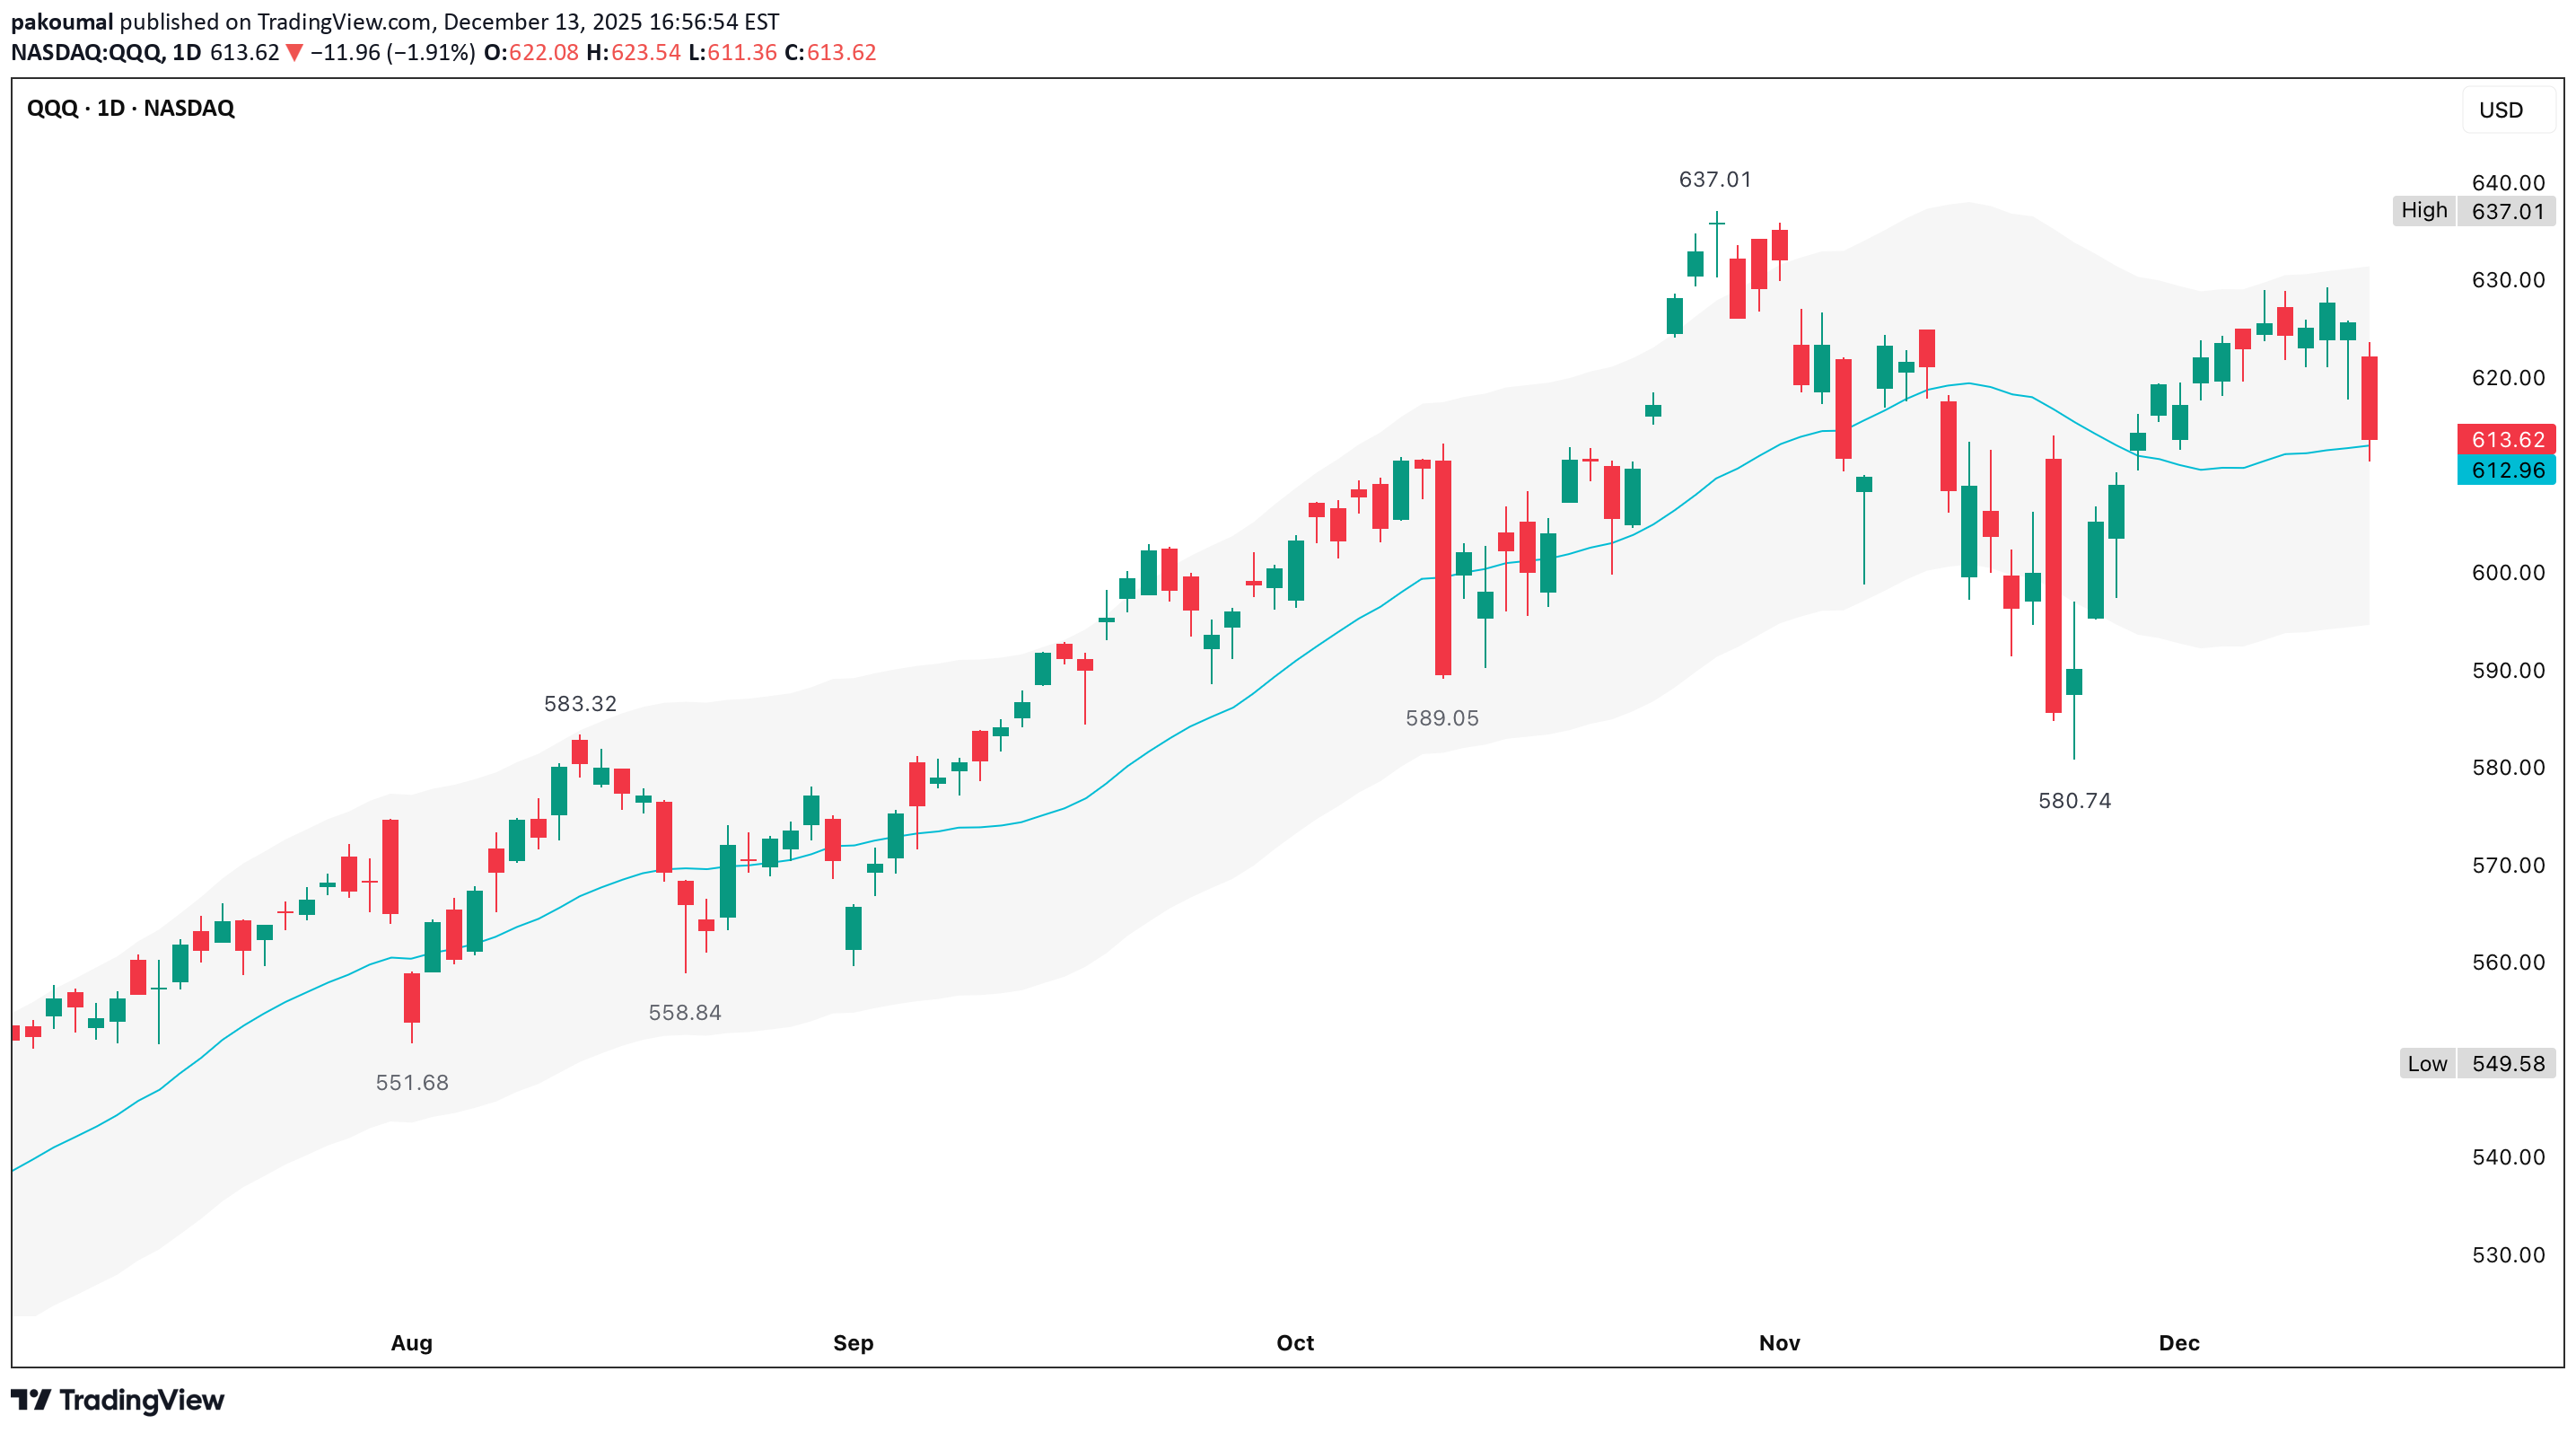
A ±3% envelope around the 20d MA does 3 important things 1. Upper band Marks short-term trend extension Rallies that fail from here often lead to multi-week digestion 2. 20d MA Control line for short-term trend Chop around it = balance, not resolution 3. Lower band (~-3%) Where momentum resets actually complete Where successful Santa rallies most often launch Price is slightly below the 20d MA & still well above the −3% band Recent selloffs have tagged the 20d MA, but not the lower band & that tells us that the reset is in progress, but not finished When Santa rallies succeed, price either 1) touches or briefly pierces the −3% band, then reclaims the 20d MA OR 2) spends enough time between midline & lower band that volatility collapses The key is whether sellers are forced to exhaust themselves & that exhaustion point lines up with ~$590-$600 The cleanest sequence for a high-quality Santa set-up is that price drifts/flushes into the −3% band & we see long lower wicks, smaller red bodies, failed follow-through on down days & price reclaims the 20d MA since Santa rally starts from inside value, not above it This leads to grind higher quietly, carry into early January & avoid sharp January reversals A weak or fake Santa rally happens when price never touches the −3% band Rallies start from above the 20d MA, upper band is hit quickly & momentum rolls again in early January The chart still argues for at least one push toward the lower band (~$590s) before a durable Santa rally - not because Santa can’t happen without it, but because momentum has not been fully neutralized & the market hasn’t forced capitulation from late longs Santa-ready = price has touched the −3% band & reclaimed the 20d MA Not Santa-ready = price still oscillating above the lower band This ±3% / 20d MA view confirms everything from the weekly MACD It visually explains why $590-$600 keeps showing up Santa rallies that start after a lower-band test are stronger & last longer Santa rallies that start before it are more fragile The weekly MACD is saying that momentum is rolling, not reversing & in strong bull markets, this exact MACD behavior typically resolves via price moving sideways-to-down until momentum resets & the trend continues - not how a major top appears The MACD is not deeply negative which argues against panic-style selling, but it does demand time or price, or both The weekly MACD does not resolve with a quick bounce to $625, or a shallow 2-3% dip It usually resolves with a 5-8% pullback, or several weeks of chop From the ~$637 high 5% ≈ $605 6-7% ≈ $595 to 590 Which lines up exactly with weekly 20 MA & prior breakout structure Structure strongly favors price visiting ~$590 since that actually resets momentum The weekly trend is bullish & weekly momentum is resetting Daily structure is corrective, 4H AVWAPs suggest balance & the 1H wedge pattern is a short-term pressure When all of those align, the most common resolution is drift/chop to a test of $590-$600, consolidate a base & rally A $620-$625 bounce can still happen inside that process, but it’s secondary, not required Test $590s, then base ~55% (base case) Chop $600-$620, no resolution ~25% ATHs without touching $590 ~15% Sharp breakdown below $580 ~5% The weekly MACD confirms a reset is underway & that reset most cleanly completes near $590-$600 A $620-$625 bounce is optional, not necessary Any move into $590-$600 that holds weekly structure is bullish, not bearish The higher-probability outcome is a test of the $590s before any Santa-rally-style push to new highs Historically, QQQ does not print new ATHs while weekly momentum is actively resetting since that reset almost always completes before the seasonal tailwind expresses itself So if there is a Santa rally, it’s far more likely to start from lower prices, not launch from mid-reset levels A move into the $590s completes a 5-7% pullback, resets weekly momentum cleanly, flushes late longs & sets up positioning for a late-December/early-January run This sequence aligns perfectly with typical late-year behavior Santa rallies that actually stick, not fail Markets prefer to rally from fear, not from complacency The one thing that would flip this quickly is if & only if price closes on the daily above $625, followed by strong acceptance Seasonality is subordinate to structure The market is resetting, not breaking Santa rally odds improve after a dip, not before $590s before ATHs is the cleaner, more durable path Any dip into the $590s that holds weekly structure is bullish fuel, not danger This SMH/QQQ ratio chart is the missing piece & it materially tilts the odds toward the base case The ratio is still in a clear uptrend, it's above its rising MA, so long-term structure is higher highs, higher lows, which means semiconductors are still outperforming QQQ on a medium-term basis, so despite the AVGO-driven selloff, leadership has not broken & that matters a lot The pullback is a mean-reversion, not a regime change In strong markets, relative strength pulls back to the MA, then either consolidates & resumes higher, or rolls over decisively (which has not happened) Semis are ~40% of QQQ’s momentum contribution QQQ rarely makes a sustained leg lower without semis underperforming The ratio holding implies any QQQ downside is corrective & not the start of a broader drawdown That supports bounce attempts, shallow-to-moderate retraces & defense of higher MAs (50d & 100d MA) This slightly changes the probability weights in my opinion vs a $590 test as highest single outcome Bounce to $620-$625, stall ~45% Bounce & range $615-$630 (no immediate $590) ~25% Breakdown to $590 test ~20% Breakout & reclaim $632+ ~10% So $590 is still very much in play, but it is less inevitable than it looked without the ratio & this is exactly why relative strength matters The $590 test would be much more likely if SMH/QQQ closes below its MA & then fails to reclaim it within ~3-5 sessions If that happens semis stop leading & QQQ likely seeks the 100d MA (~$590-$596) If ratio stabilizes and turns up, QQQ holds above $610, then the $625 test becomes constructive, not corrective I believe this ratio shows that the cause (profit-taking) is validated, the damage is contained & that the sequence still favors bounce, consolidation/decision & either delayed ATHs or a shallow reset What it argues against is an immediate waterfall to $590 The SMH/QQQ ratio says leadership is intact That reduces (does not eliminate) the odds of an immediate $590 flush A bounce toward $620-$625 is now even more likely The next decision happens at $625, not $590; unless, semis lose relative strength CPI & NFP next week are much more likely to affect intraday volatility than weekly direction since they are unlikely to invalidate the $590-$600 reset thesis unless the data meaningfully re-prices the rate path, which Powell explicitly tried to prevent so treat CPI/NFP days as liquidity events & not trend confirmation days Powell effectively said Don’t overreact to individual prints - policy is about the trend Watch where price closes, not the spike If the market uses data to explore lower value & then fails to continue, that’s bullish If it uses data to bounce, but cannot reclaim key levels, the reset continues The data does not replace the technical process - it only colors it
QQQ Implied Move Range
QQQ's implied expected move is calculated using the current option chain to find the ATM straddle (cost of ATM call + ATM put for nearest expiry) Expected Move (≈ 1σ) ≈ $0.85 × (ATM Straddle Premium) The result gives a one-standard-deviation range (≈ 68% probability) for the underlying’s move over the option’s life For a short horizon (“by tomorrow”), pick the front-month (or nearest-term) options that expire soon & use their straddle; alternatively, use annualized implied volatility (IV) converted to daily/weekly via the standard volatility-scaling formula Move = S × IV × SQRTΔ t /365 Where S = underlying price & Δ t = number of days to expiry This yields a symmetric “+/-” band, but it does not forecast direction - only the magnitude (volatility expectation) The front-month or nearest options typically price in a short-term move of roughly +/-1% to +/-1.5% around the current price, ~$625, which suggests a likely trading range for tomorrow of roughly $618 to $634 (-1% to +1.5%) The implied move is derived from option-markets’ aggregated expectations - it doesn’t tell you direction Actual price can & often does, break outside the straddle-implied band; especially, if there's a surprise (Fed tone, macro data, headlines) The implied move reflects volatility pricing If implied volatility collapses (after the event), realized moves may be smaller If IV remains elevated or rises, moves may exceed the band The “+/-1%-1.5%” range is a typical result for front-month options under normal volatility In a “event week” (like FOMC), implied volatility can be distorted, meaning the real move could be larger, or the band may understate risk Use the $618-$634 band as a “probability envelope” Markets seem to expect QQQ to stay somewhere in that range under “normal” conditions If you expect a dovish surprise - the upper half (near $629-$634) is reasonable If you expect a hawkish or cautious tone - then the lower half (near $620–$618) is better If you expect a major surprise or risk-off - plan for possible breakouts beyond that band (to either side) 1. FOMC 27 July 2022 QQQ closed @ $306.81 the day before FOMC 1 day close was $309.81 3 day close was $315.27 Actual 1 day move was +0.98% Actual 3 day move was +2.76% The 1 day move stayed within the typical implied move (~+/-1-1.5%) The 3 day move exceeded the common expected-move envelope (~+/-2-3%), driven by a surprise dovish tone 2. FOMC 14 December 2022 QQQ closed @ $297.50 the day before FOMC day close was $285.94 3 day close was $268.60 Actual 1 day move was -3.9% Actual 3 day move was -9.7% This massively exceeded the typical implied move band Implied range around that meeting was ~+/-1.5-2% & the realized move was far greater Powell pushed back on easing conditions 3. FOMC 22 March 2023 QQQ closed @ $305.00 the day before FOMC 1 day close was $309.42 3 day close was $315.57 Actual 1 day move was +1.45% Actual 3 day move was +3.47% The 1 day move landed right inside the expected band The 3 day move pushed to the upper edge or slightly beyond the common ~+/-3% implied envelope A mild dovish shift + banking-crisis risk-off reversal supported tech 1. QQQ usually stays within the implied move on Day 1 Roughly +/-1–1.5% is historically typical Breaks above +/-2% tend to occur only on strong surprises 2. QQQ frequently breaks the implied move by Day 3-5 The 3-5 day window often includes volatility expansion, trend continuation if the Fed surprises & mean-reversion if the first move was emotional 3. Surprises create the largest deviations Hawkish surprises are the biggest downside breaches (December 2022) Dovish surprises are sizable upside breaches (July 2022) 4. Base-case FOMC outcomes generally stay within the implied band Typical outcomes settle into the +/-1-1.5% Day 1 move, but still tend to fade over 3-5 days Around 70-80% of the time, QQQ stays within a “1σ” band after FOMC 20-30% of the time, it breaks out with a big move (usually driven by a surprise) The 3 day window is actually slightly more prone to exceed the band than 1 day or 5 day This suggests that 3-5 sessions after FOMC is where the real repricing happens 🕊️ Dovish Day 1 +0.5% to +1.5% Day 3 +1% to +3% if the narrative sticks Day 5 some giveback is common = net +0.5% to +2% 🧸 Base Case (“hawkish cut”/cautious) Day 1 –0.5% to +0.5% (within 1σ band) Day 3 drift –0.5% to –1.5% Day 5 further mild weakness = total -1% to -2.5% 🦅 Hawkish Day 1 -1% to -2.5% (near or beyond 1σ band) Day 3 -2% to -4% total Day 5 is either stabilization or a small overshoot lower = –3% to –5% total in a stronger shock Something like the base-case band happens ~70-80% of the time A true “shock” move (outside band, +/-3–5%) occurs roughly 1 in 4 to 1 in 5 meetings Directionally, given current positioning yield re-steepening + QQQ’s extension, I’d assign higher odds of a base or mildly hawkish outcome, so statistically, the 3-5 day fade is still my default The 3-5 session window is where the bigger, more directional, macro-driven moves happen In the current macro setup, the bias is toward the base/mildly hawkish path, which historically lines up with a contained Day 1 move, then a drift lower over the following 3-5 sessions +/-1.5% (1 day) Upside $625 × 1.015 ≈ $634 Downside $625 × 0.985 ≈ $616 +/-3% (bigger, 3-5 day) Upside $625 × 1.03 ≈ $644 Downside $625 × 0.97 ≈ $606 +/-5% (shock/tail scenario) Upside $625 × 1.05 ≈ $656 Downside $625 × 0.95 ≈ $594 1. If we close >$634, it nudges into “strong dovish” territory & day 3-5, holding above $625-$630 keeps the “wave 5 extension” idea alive; even then, a later retest of $620-$625 is typical behavior 2. A drift toward $608-$615 lines up with historical negative median returns & if QQQ breaks below ~$615 & closes there on Day 3-5, odds increase that we’re in bigger corrective territory, not just a quick shakeout
QQQ End of a Corrective Bounce?
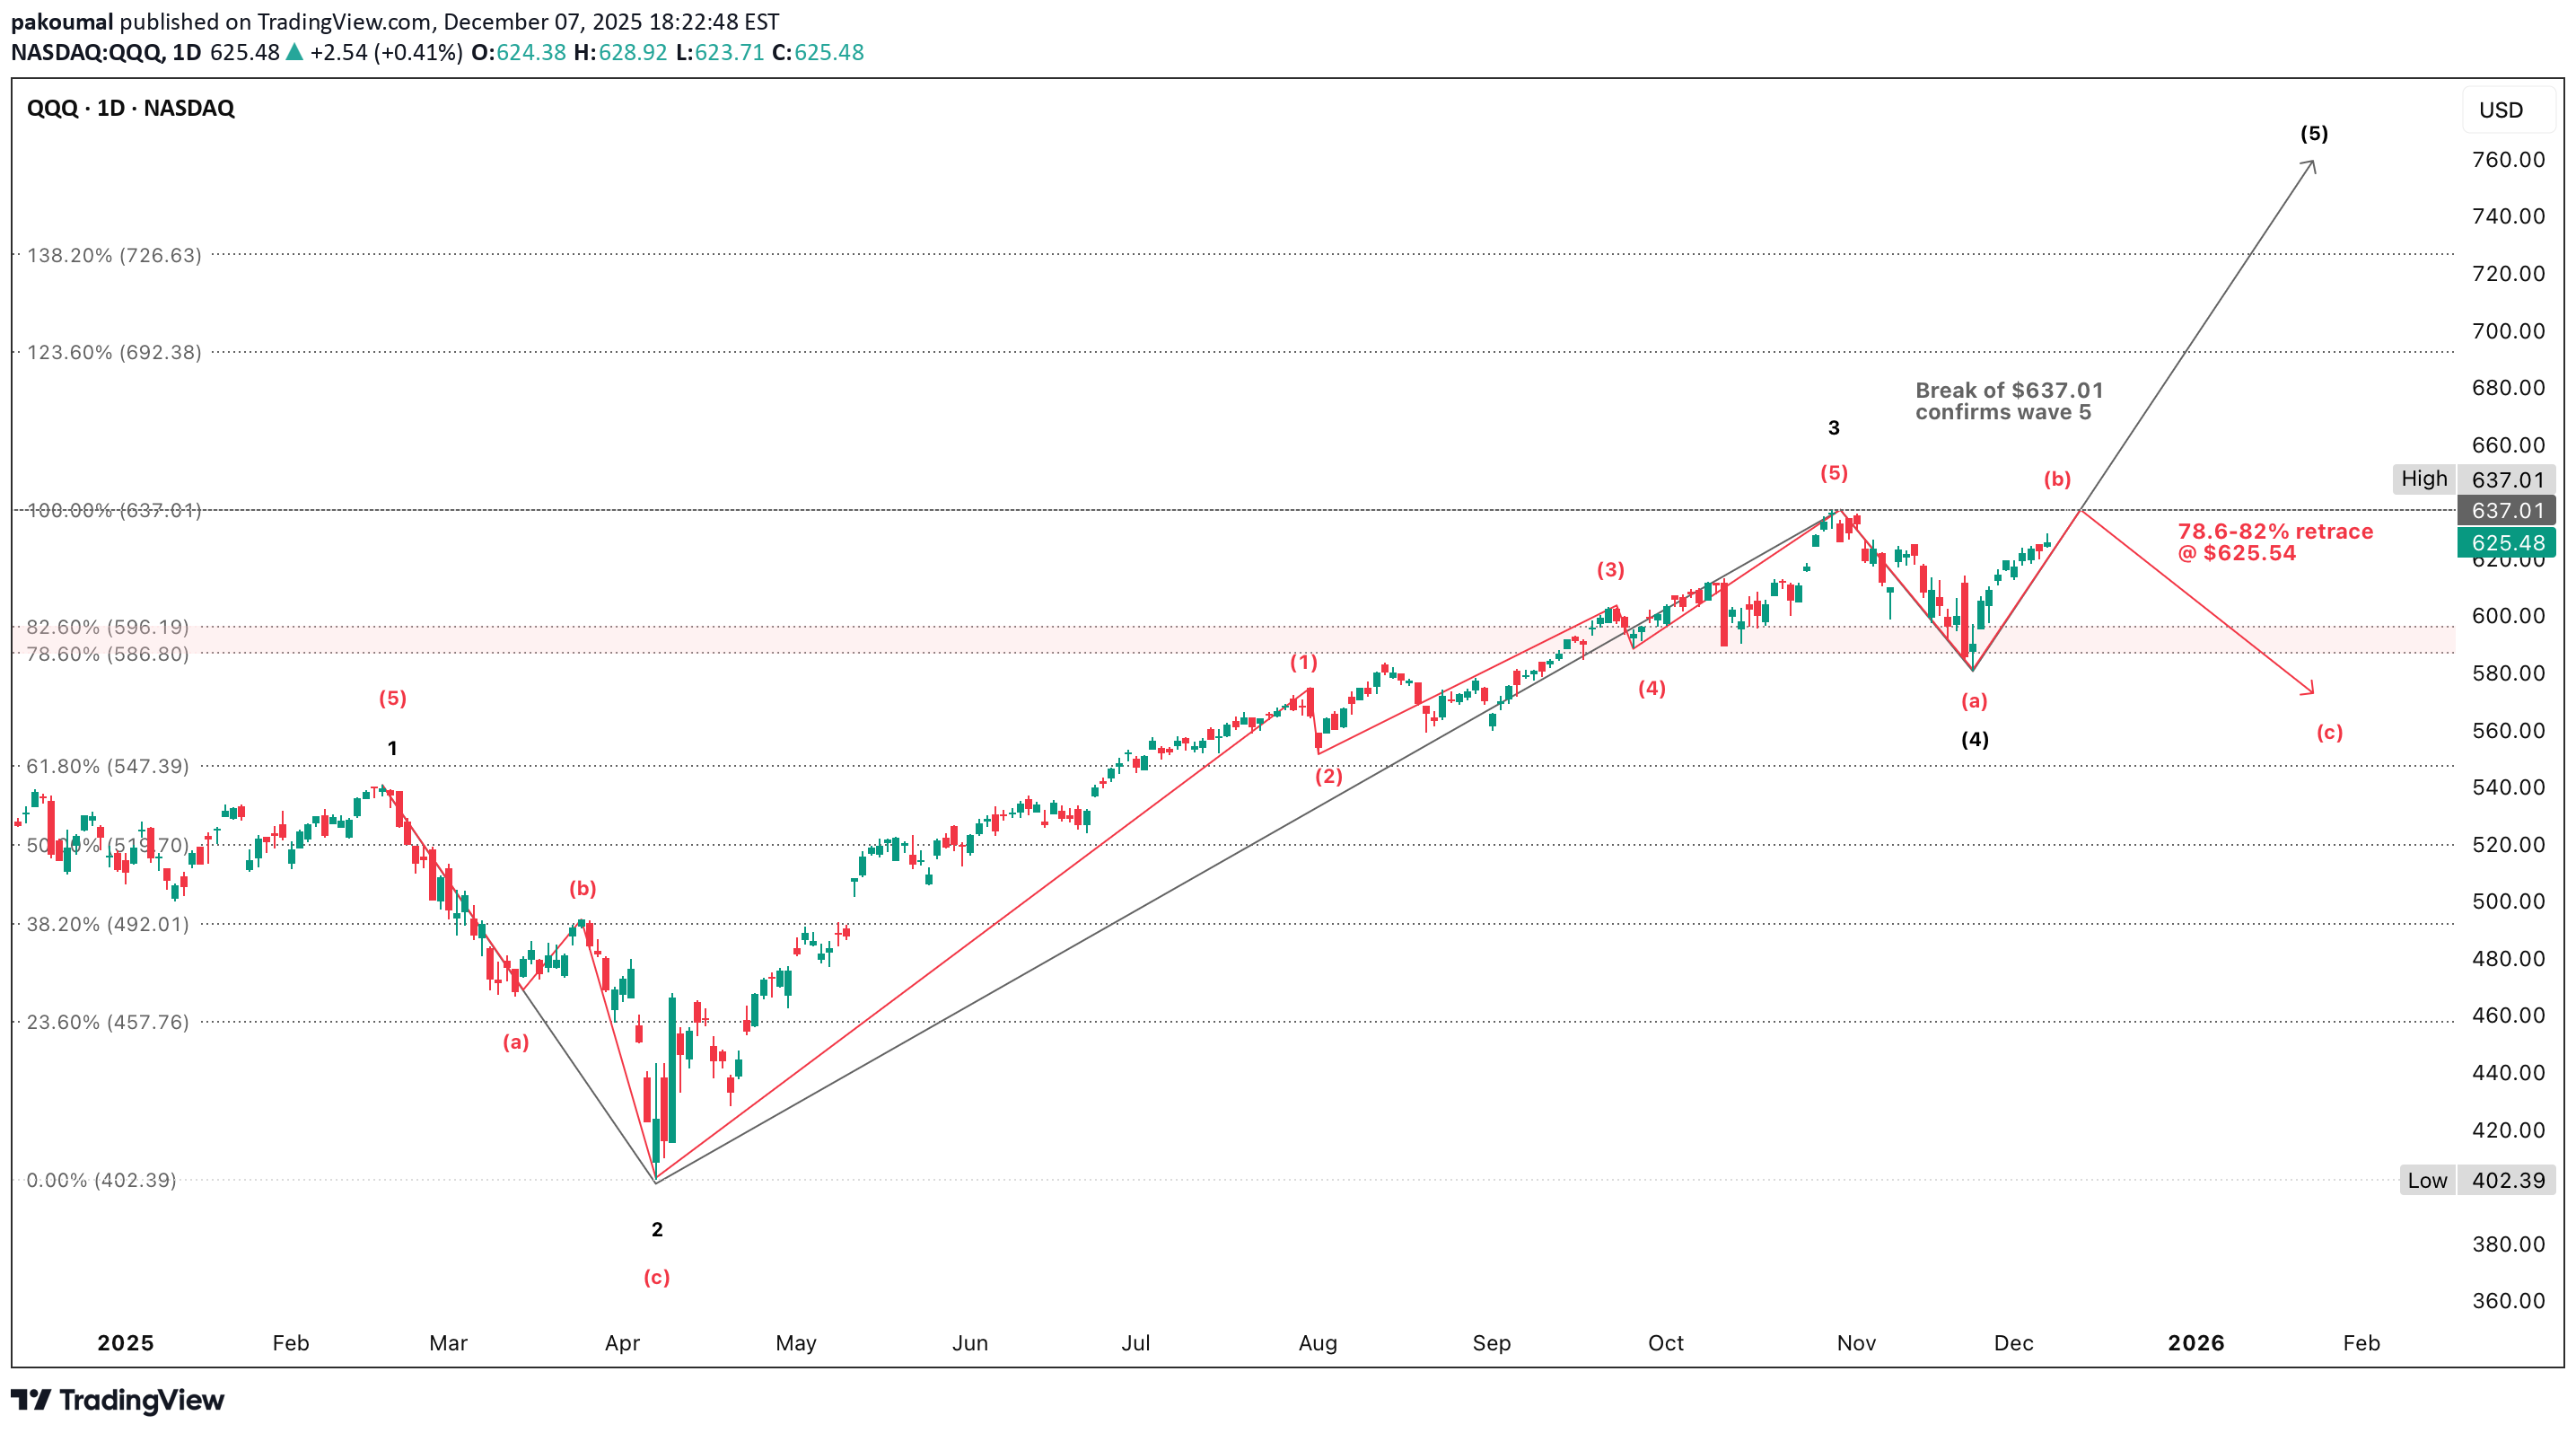
The Thanksgiving bounce was real & technically healthy with a sharp V-reversal off ~$585 Buyers regained key MAs (20d & 50d), oscillators turned upward & price broke out of the panic low without resistance Last week’s action built a tight coil under a clear ceiling & this type of setup often resolves after a catalyst (FOMC) QQQ is at a true inflection point - not obviously topping, not clearly breaking out Both a pullback or breakout are technically reasonable A pullback is possible given stretched momentum, thinning volume, clear resistance $631-$637, many components are strong, but not surging & other short-term exhaustion signals which makes a risk of fade technically credible A breakout is still possible because the trend structure is intact, buyers defended every dip for 2 weeks, short-term AVWAPs are rising under price (support) & no reversal signals so the market tends to drift upward into events The most realistic path is a slow grind into $630-$633 early this week & after FOMC, the market chooses its path If buyers don’t have conviction, then a pullback toward $612 to $605 If buyers get a catalyst, then a breakout above $637 A “bounce into FOMC & then fade” base case is completely supported by the charts, but it’s not the only valid outcome A breakout remains technically possible if $637 is reclaimed with volume QQQ’s Thanksgiving rally carried into last week’s consolidation & the index is now poised at resistance in a balanced, technically neutral state so it can push higher into the $630-$633 early in the week, but the real move (pullback or breakout) will be decided after FOMC Wave 5 & Wave b often look similar until one key level is broken or held & right now, price is where both counts remain technically valid & that’s why I feel at a loss - it's ambiguous by nature, but there are precise levels that resolve the ambiguity 1. Price must break above the prior high at $637.01 with no exceptions Wave 5 must make a higher high relative to wave 3 2. Wave 5 should show expanding candles, improving breadth & stronger volume on the push through resistance bands Right now the move out of wave a is corrective-looking & wave 5 often starts with corrective back-testing; however, it has the look of an a–b–c upward correction, not a start of a new leg higher & this is a yellow flag for the bull case 1. If price rejects at resistance, wave b is confirmed & wave 5 is invalidated Price often stops exactly at the 78.6-82% retrace, which is common for wave b peaks Price should fail below $632-$637, then break $600-$605 & possibly accelerate lower to $570 2. If price closes above $637, then wave 5 is confirmed, period 3. If price rejects $630-$637 & breaks below $612, then the wave b path is confirmed This is the most important support on the chart Break $612 & the bounce was corrective so wave c is next The bounce up from wave a low looks much more like a wave b correction than a wave 5 start given the retracement depth (~78.6%) fits wave b perfectly, declining volume, stretched oscillators without trend confirmation & price pinned under major resistance Wave 5 usually doesn't start with weak volume & overlapping candles, but wave b rallies often do We don't confirm the wave b top until the market breaks support Structurally, the chart is sound & doesn't violate any hard Elliott rules A wave b often retraces 61.8-78.6%, or sometimes 100% of wave a The current rally is sitting just below the 78.6-82% ($630-$632) & may even tag $637 if the market pushes into the event/catalyst Wave c unfolds in 5 clean subwaves, often in a move parallel to wave a & usually lands near the 61.8% retrace of the prior impulse A realistic target is $560-$575 The wave c target around $572 is reasonable if the correction continues 0.618 × wave a (~32 points) 1 × wave a (most common, ~52 points) 1.618 × wave a (during strong, sharp corrections, ~84 points) $572 is between the 0.618 & 1 projections for wave c Lands almost perfectly on the 50% retracement of the entire wave 3 advance
QQQ VWAP Based Entries
When price moves from below to above an AVWAP decisively, it signals short covering & a shift in control from sellers to buyers & when 2 or more AVWAPs converge liquidity concentrates, reversals or breakouts often happen there & these are the spots where traders take reversal trades, breakout entries, or stop placements Right now, the 3 & 21 November AVWAPs are separated, meaning trend strength When they converge, it signals compression 1. Using AVWAPs as a dynamic stop-loss is one of the simplest & most effective uses If you're long above the 21 November AVWAP, the rising blue AVWAP is your dynamic stop A close below it should signal an exit It reflects the average buyer cost basis, not arbitrary price levels 2. An AVWAP is a useful trend filter Price above rising AVWAP(s) suggests a long bias Price below falling AVWAP(s) suggests short bias When price chops around a flattening AVWAP, stay out AVWAP is a trend health indicator 3. AVWAP + candlesticks = clean entry signals The strongest signals come when price pulls back into an AVWAP, prints a small reversal candle (hammer, doji, engulfing) & ATR is declining (just like now) since these become high-quality continuation entries As a high-level playbook, anchor VWAPs at major pivots (highs, lows, breakdowns, earnings gaps), trade pullbacks into rising AVWAPs during uptrends & trade rejects from falling AVWAPs in downtrends Use converging AVWAPs as inflection points Use the nearest rising AVWAP as your stop Anchor to the close if the candle represents an event you want to capture (breakout, breakdown, a clear reversal bar, a candle where closing price indicates the market's verdict, earnings, FOMC, etc) Anchor to (H+L+C)/3 (the “typical price”) when you want a smoothed, less-biased VWAP for longer-term structures or swings Typical price reduces noice from intraday spikes & avoids sensitivity to one extreme print or over-reaction to the tails on the candle (AVWAP from swing highs/lows or the start of a trend) Price is above all AVWAPs This means all meaningful “cost basis cohorts” are beneath price The market is structurally repaired, at least in volume-weighted terms Overhead resistance from anchored supply does not exist right now This is a very different situation from when AVWAPs are stacked above price The ATH AVWAP is rising & firmly below price This is one of the best signs of long-term trend health in AVWAP analysis When the ATH AVWAP is rising, decisively reclaimed & acting as near-term support, it usually tells you the prior correction has been fully absorbed Longs from the top are no longer underwater Selling pressure from those prior buyers is neutralized Trend followers using AVWAP logic have flipped their filters back to “risk-on” This is an objective, mathematical read & not a prediction The 3 & 21 November AVWAP are now support layers 3 November (red) are breakdown-day sellers who are now underwater & this is a bullish dynamic because they can’t apply pressure 21 Nov (blue) are capitulation low buyers, still profitable & in control - primary support Together, these form a layered support around $605-$612, or the area where dip-buyers have historically stepped-in A stop-loss location for AVWAP-based trading systems Now that price is above all 3 major AVWAPs, the focus shifts to behavior around the ATH AVWAP & since price is above it already, there are only 2 meaningful reads 1. Bullish continuation setup 2. Price may pull back to the ATH AVWAP ($618) Find buyers (hammer, doji, small-range reversal) & then move away This is one of Brian Shannon’s highest-probability setups (reclaim AVWAP → pullback → higher low → continuation) Potential warning setup because trend deterioration begins with this move Price closes below the ATH AVWAP Then stays below it for multiple sessions Slope begins to flatten or roll over This would be your first objective sign that the trend is losing strength from an anchored-volume standpoint The chart shows the exact 3 level anchored VWAP system that institutional traders use A correction-low AVWAP (21 November) A breakdown-event AVWAP (3 November) A structural high AVWAP (ATH) This lets you map out short-term trend control (blue), intermediate-term supply absorption (red) & higher-timeframe trend health (gray) & right now, all of them say the same thing Price is in a state of repaired, orderly trend with all major AVWAPs providing support beneath ATH AVWAP Defines trend health at the highest timeframe visible on your chart Swing traders, late buyers at the highs, trend-following algos When price is above the ATH AVWAP then the uptrend is structurally intact When price is below it then long-term players are underwater, trend is suspect QQQ is above the ATH AVWAP (~$618) This means that ATH buyers are profitable again The first high-quality pullback often tags this line in early trend repair phases A reclaim → retest → hold sequence is extremely bullish behavior 3 November breakdown AVWAP Tracks sellers from major breakdowns or panic candles Funds that sold into weakness, systematic risk-off flows If price is above it then that entire selling cohort is underwater These traders become forced buyers on pullbacks or breakouts AVWAP ~$610 Price is above it then supply from that breakdown is absorbed This AVWAP becomes support on deeper pullbacks If price tags it then watch for immediate dip-buying 21 Nov AVWAP - capitulation Tracks the cost basis of buyers who stepped in at the emotional low Aggressive reversal traders, deep-value algos, CTA re-leveraging This is the most important rising support line in the model When price is above it, the reversal cohort is still in control A close below it often signals trend exhaustion AVWAP ~$605 Price is well above it & the slope is rising aggressively As long as price respects this AVWAP, the recovery trend remains clean If price pulls back to it then this is a high-odds rotation/continuation buy point Long-Term AVWAP This is the long rising AVWAP on your chart (~$592) It acts as deep trend support The line separating bull vs bear structure The highest timeframe “fair value” of the entire trend leg A tag here marks trend reset, not breakdown A break below this layer shifts the market into caution This long AVWAP is safely under price so the long-cycle trend remains intact When all layers are stacked in ascending order like this, you get a fully aligned bull structure, clean pullback architecture, no overhead VWAP resistance, multi-cohort profit alignment & strong continuation behavior This model is about control, not prediction & right now, the bullish alignment is simply a fact of structure These levels come directly from how institutions trade AVWAPs 1. ATH AVWAP (~$618) is the light pullback, common after a fast push off a low Signals to watch for include a hammer/doji at the AVWAP Lower wick rejection ATR contraction & reversal Reclaim → hold → push This is the first layer most swing traders buy 2. 3 November AVWAP (~$610) This is the mid-depth pullback It’s usually triggered when short-term longs trim Expect a strong buyer reaction 1-2 days of stabilizing candles Momentum traders stepping back in This is a very strong continuation level in AVWAP systems 3. 21 November AVWAP (~$605) This is the high-value dip This line is VWAP traders’ favorite It represents the true reversal cohort’s cost basis It has been respected perfectly It rises steadily each day It marks the “line of trend continuation” If price reaches this AVWAP, this is often the highest-probability buy in the entire structure Rejecting here = trend continuation Closing below = trend fatigue 4. Long-Term AVWAP (~$592) This is the deep reset, not a casual dip If price ever hits this momentum is gone, trend is resetting, higher timeframe traders reassess, hedge funds rotate & isk allocation shifts This is not a breakdown, but it is a significant tone-change You rarely see this tested unless markets enter a broader digestion phase Given the current AVWAP spacing & slope $618 (ATH AVWAP) is highly actionable $610 (3 November AVWAP) is a strong level $605 (21 November AVWAP) is an institutional-grade support When price is above all 3, VWAP traders don’t look for tops - they monitor control transitions
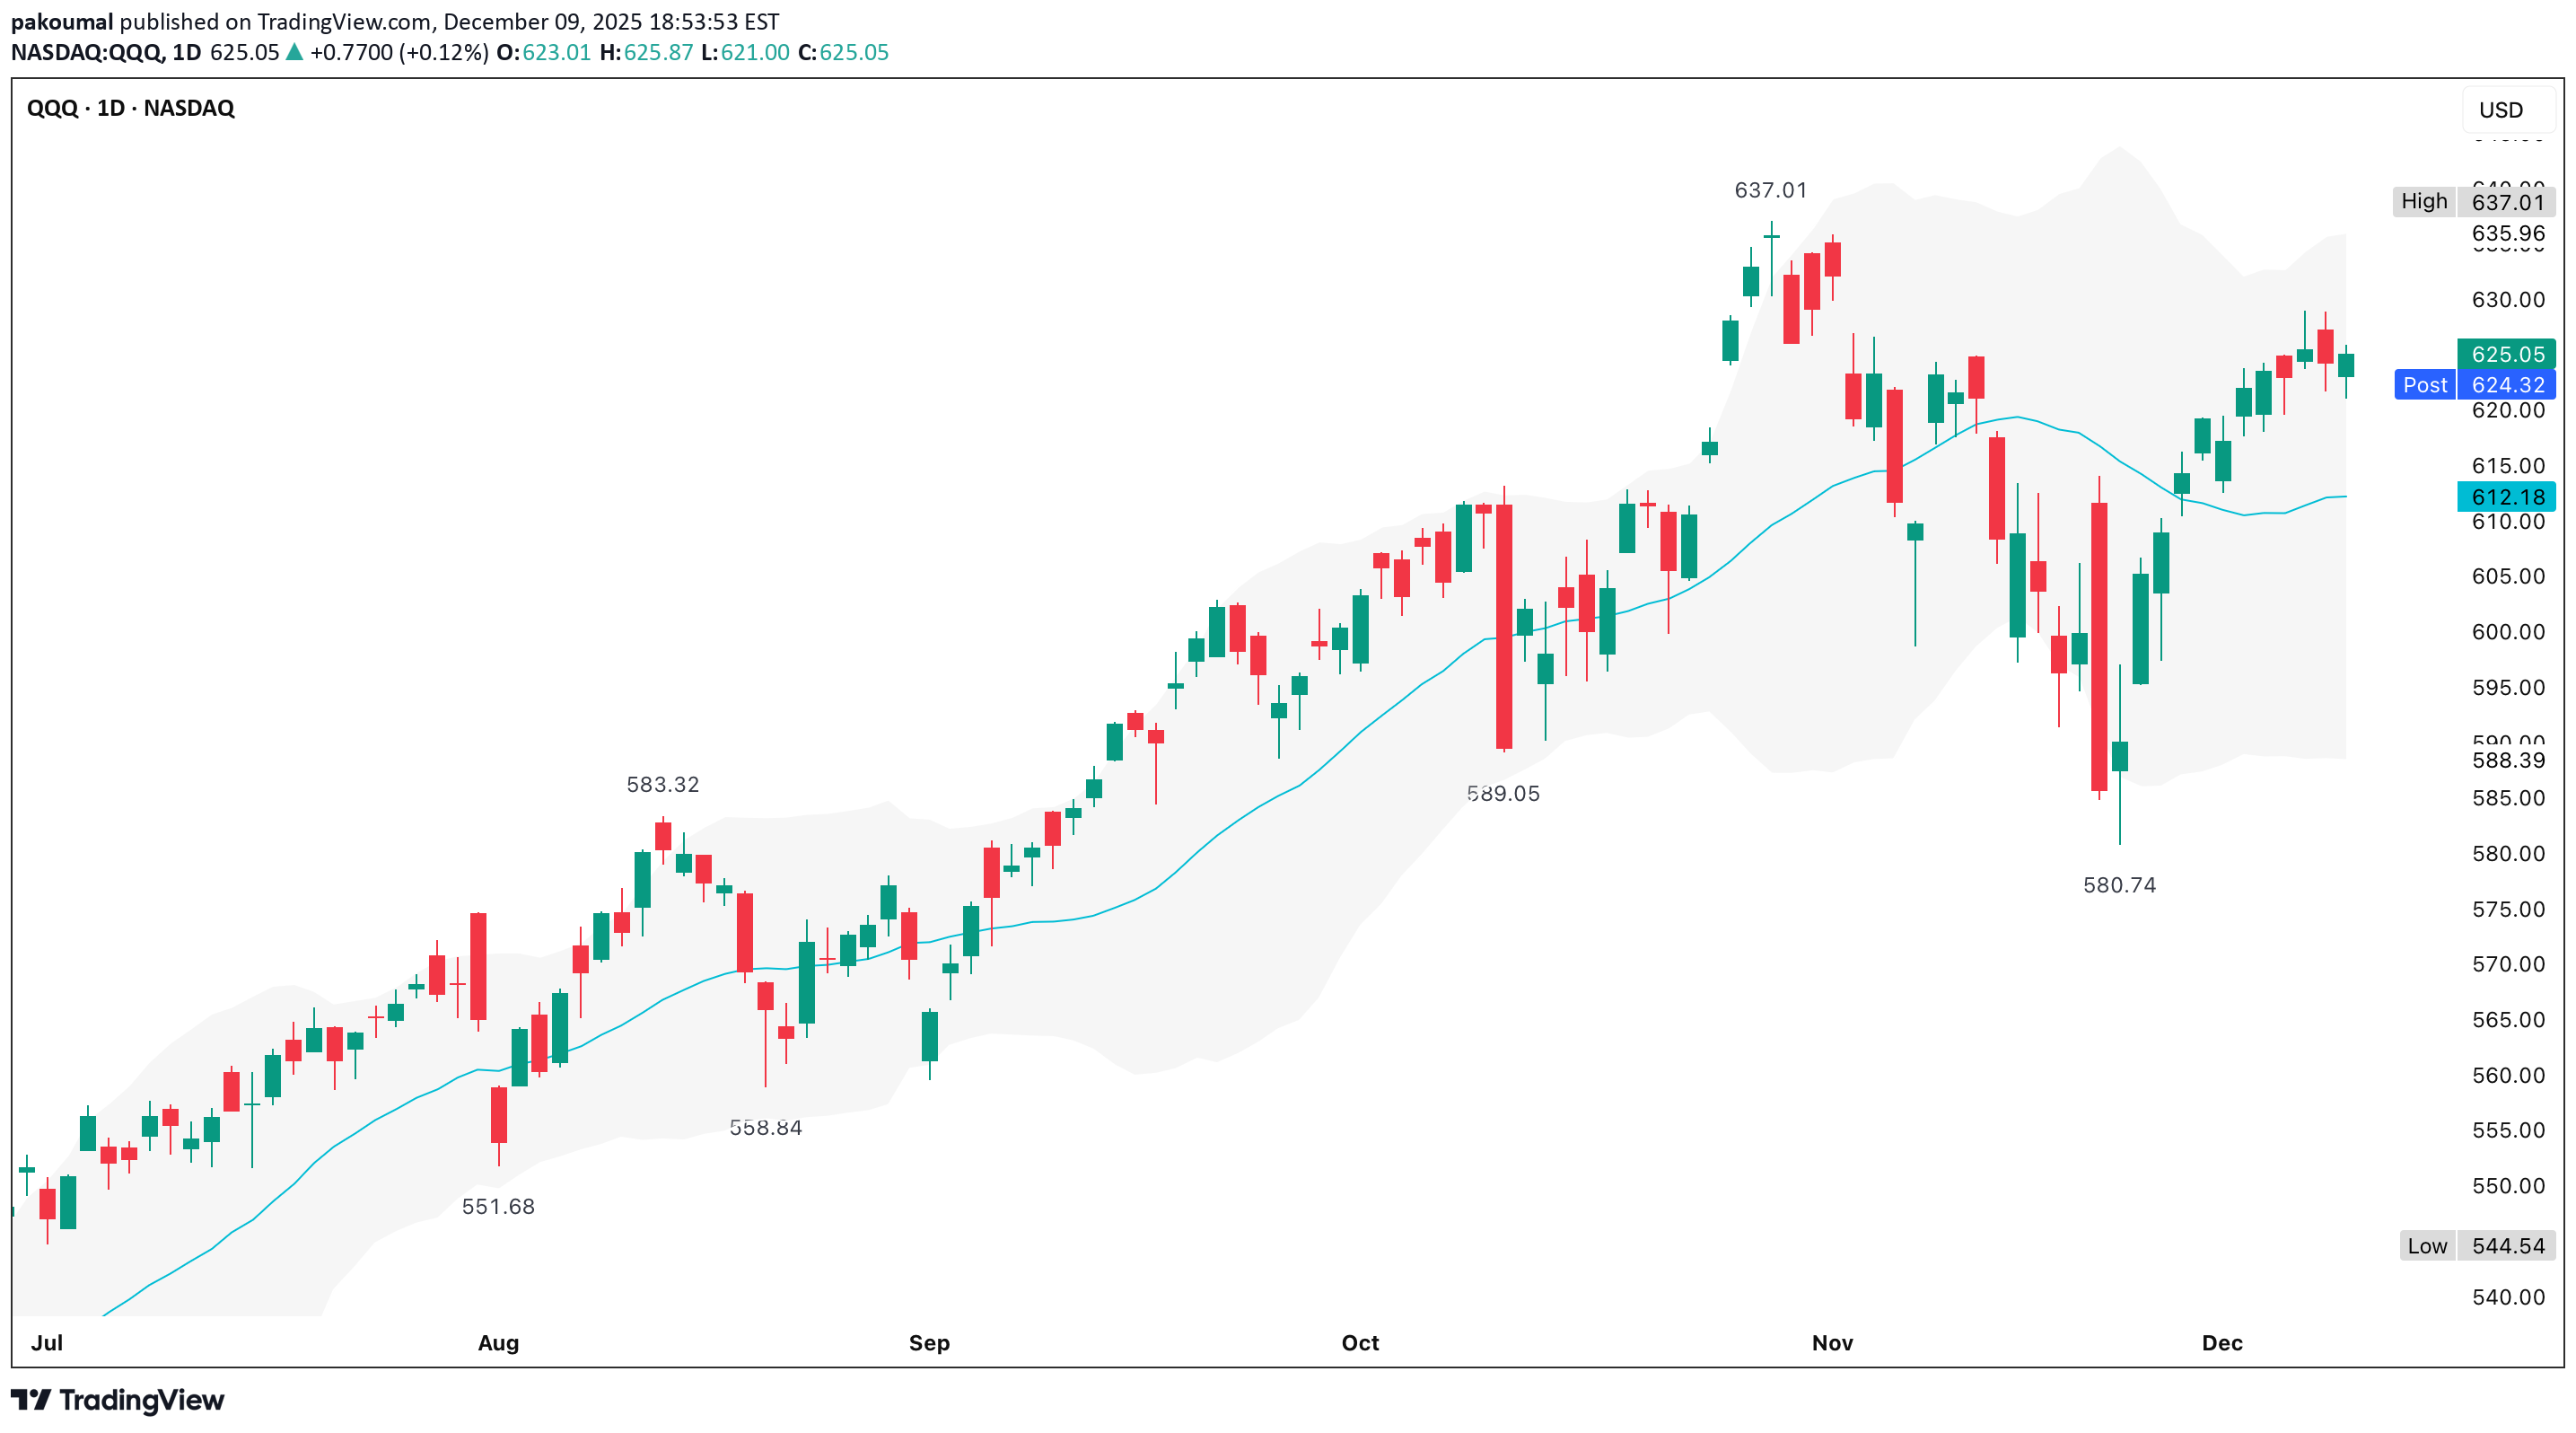
QQQ (5 December)
When QQQ tops on the daily timeframe, you typically see upper-band overextension, multiple rejection wicks, bearish engulfing candles, a clear lower high formation, EMA breakdown & shrinking momentum + rising volatility, but the chart shows the opposite Price bounced cleanly off the mid-band & is riding the upper half of the Bollinger channel This is continuation behavior - not reversal structure The daily trend is intact and healthy No close below the mid-Bollinger (20d MA) No sharp mean reversion No violation of October low structure Higher lows since the pivot around $589 This is an uptrend, with no technical evidence of topping $637 is the ATH QQQ rarely tops on the first retest It either i) consolidates under resistance & then breaks, or ii) fakes a small dip & then breaks The current setup shows controlled expansion, trending conditions, no volatility spike, smooth adherence to mid-band support & higher highs forming inside the bands This is bullish The last candle is green, closing near the upper band with solid volume & QQQ closed above $625 - a higher high vs last week, which suggests continuation, not distribution 1. Breakout attempt toward $630-$635 60% Trend + position in band favors upside 2. Pullback to $620-$615 before breaking higher 30% Standard retest of mid-band structure 3. Deep reversal toward $580 10% No topping pattern; requires macro shock
Disclaimer
Any content and materials included in Sahmeto's website and official communication channels are a compilation of personal opinions and analyses and are not binding. They do not constitute any recommendation for buying, selling, entering or exiting the stock market and cryptocurrency market. Also, all news and analyses included in the website and channels are merely republished information from official and unofficial domestic and foreign sources, and it is obvious that users of the said content are responsible for following up and ensuring the authenticity and accuracy of the materials. Therefore, while disclaiming responsibility, it is declared that the responsibility for any decision-making, action, and potential profit and loss in the capital market and cryptocurrency market lies with the trader.