
observingthetrade
@t_observingthetrade

What symbols does the trader recommend buying?
Purchase History
پیام های تریدر
Filter
observingthetrade
پایان راز ZEC: شمع صعودی ماهانه در راه است!
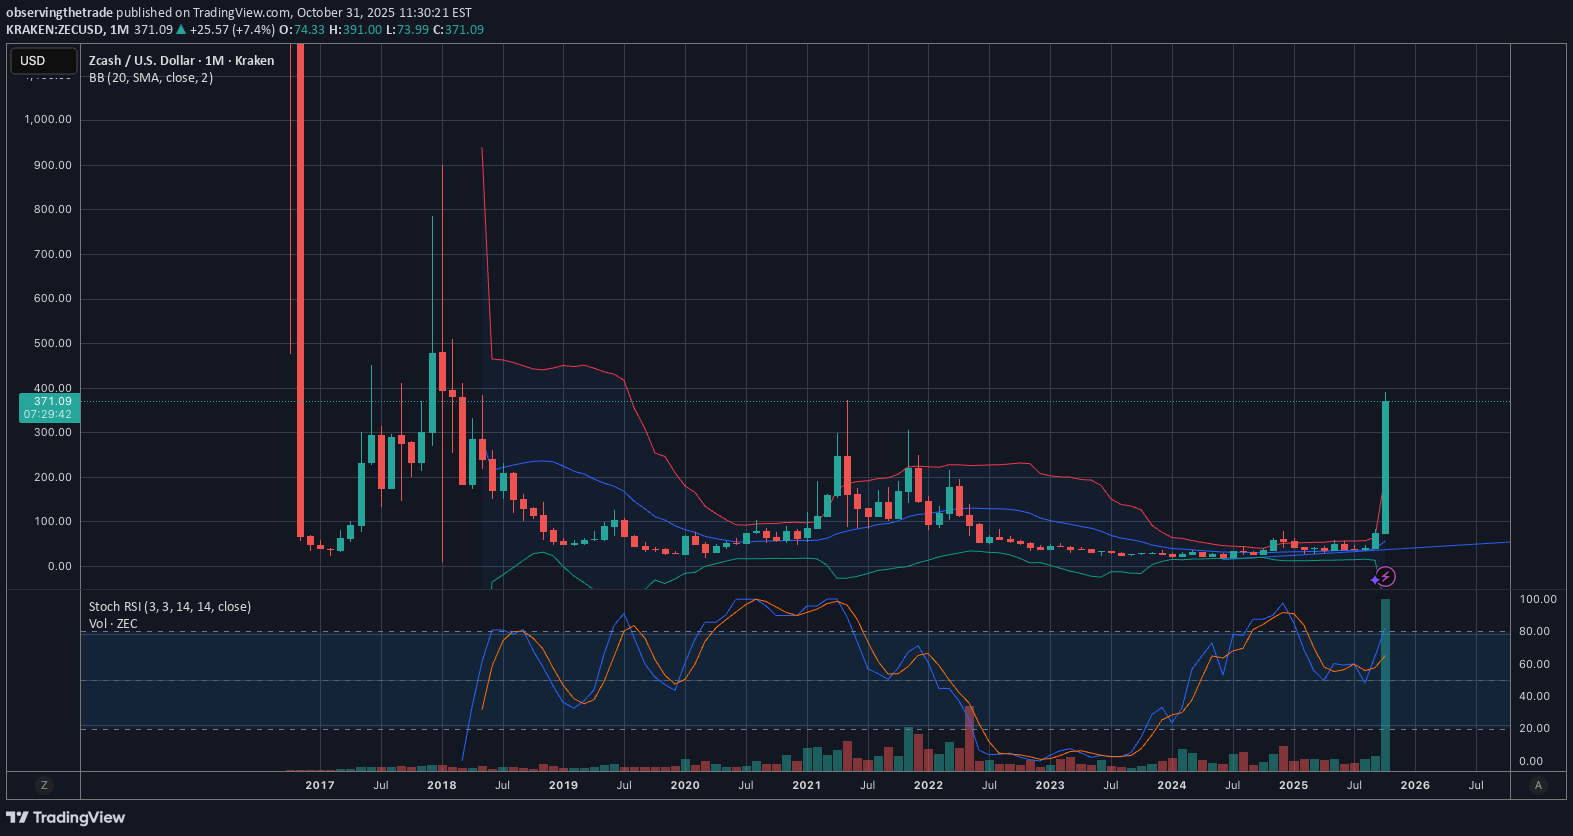
ZEC has been unreal and life changing. But this is only the beginning. Zcash will print another candle on the monthly chart today. The asset is looking for support above the 2021 top. All signs are pointing to this happening. ZEC has on exchange price history at $30k and beyond a coin. The buy volume on the monthly chart is massive. It's time to lock in. Tf in. My intent for your reality is the same bliss I am seeking.
observingthetrade

Ironically Zcash is $36 at the time of writing this or 666. The number of the flesh Flesh The need for money Kill your ego and starve your pride but still need money to survive Zcash is the stash The stash to melt faces One of many Phoenix that will arise from our debt laden and dying old way of finance This is a bold thought but with the upside potential one could consider If Zcash went from $2500 to $70 in one month Could it go from $70 to $2500 in the same time? I am stepping into my 32nd year on this earth. Best wishes.
observingthetrade

I’ve believed a lot in zcash over the years. Held the top and did other things. Looking at the chart again Im thinking it’s time to buy some more. This project has always seemed like a long term company in my opinion and I’ve always looked at it like a real competitor to Bitcoin. The price has been very bearish overall but looking at the bigger timeframes things are looking to be at a reversal/resolution. I used to call it Zcash the stash and bought a bag at $65. Like I said I’m tripling down. Na. Quadrupling down. You get the vibe. Unless you’re blind, you see the squeeze.
observingthetrade

If that right shoulder forms we are going to break above the recent high. The price range we have been testing the last day was major resistance in the initial sell off. A lot of the higher prices have FAR less resistance than we are seeing here. There was a smaller inverse head and shoulders before last weeks pump. This one is much larger. Speculation and risk are your friend if you treat them well. Cheers.
observingthetrade

You have probably been watching XRP all these years like me. Even if you haven’t sit back and watch history take place this week. The Stochastic RSI looks ready to do what needs to be done. $10-15 would be aligned with BTC price compared to the xrp/btc price ratio when XRP was at $3.84 years and years ago. I remember trying to talk my sister out of buying a rental house a few years ago and to invest in BTC instead. I was shocked because it had just surpassed the price of an ounce of gold. I thought, this means business. My lovely and slightly more traditional sister didn’t see the vision and passed on the opportunity. I didn’t have any money to invest at the time but still was in wonder at the potential. The point is even with all that I couldn’t have imagined BTC at these prices just a few years later. XRP feels to be at a similar moment in time. But thats my biased opinion It’s been a wild journey but high water, hell or a hayride here we are.
observingthetrade

XCN fining strength at .01 and is ready to retest the recent high of .016 Not too sure if it will break but am going to be looking for a candle close above .01 on the weekly. If below there a chance to revisit .008 and .004 areas roughly.There is a beautiful inverse head and shoulder forming on the 3 min chart as we speak. XCN to da moon
observingthetrade

A large bull flag has formed after the explosive rise in price for XCN. There is a little bit of bearish divergence but I’m on the bullish side of this trade. I have a strategy if we break down. If this is going to make another run up I believe it’s about to happen. Best wishes…Flag broke to the downside next area of support is around .09Nice reversal around .096 with a daily candle close over .01 Stochastic RSI oversold on larger timeframes, overbought on the daily. I think we could see a retest on the recent high just under .16 before the weekly candle close in 24 hr Should be an interesting dayHere comes a bullish move…My ego may of been too proud. We could be breaking down. Going to test .0096 at the very least possibly mid .008’s…Looks to be finding support on the major trend line that has supported this entire bullish move. Also is the key level of a penny. Downside potential is still there but larger timeframes are oversold and ready to start running…Ok so I didn’t really expect it to go to that mid .008 area but I dosed off accidentally and asI lay sleeping it played out precisely. I could have had some better orders set but wasn’t planning on snoozing. Regardless you wont find me in regret. Hopefully you caught that 50% swing? Sheeesh! Like I said we’re up and on track for one interesting day with XCNFinding support above .01 on a retest after breaking the downtrend…Battling for support at .01 if we are able to get it we will quickly retest .016The support held and we are seeing a nice pumpWoke up early morning and we are about to test the .015 high!Next bullish impulse is imminentWe have been chopping up around .0126 for some time. If you look back to the initial selloff this was an area of strong support. Once this flips I’ll be looking towards .017’s. Patience has been required today.
observingthetrade

Recent price action has sent the weekly candle above this multi year triangle I have drawn on the chart here. I have left this wedge formation untouched for years. It has been interesting to see it following so well. With every day the sentiment towards seamless transactions and secured digital money are more of a reality. All while fiat is silently hyper-inflating. I am bullish and long especially if the weekly candle closed above the line of resistance. I will re-evaulate upon the weekly close and following weeks.
observingthetrade

Algorand is at a historic moment regaining the 13.5 cent support area. Weekly & Monthly chart are showing potential for a big rally. This coins ATH is $3.15 or 23x the current price. Take a look at that squeeze on the Bollinger Bands! Price has been very suppressed on this project if you look at the larger timeframes. The boom/bust cycle symmetry is there and there is now potential for exponential growth! TV please don't delete my post! This chart has the potential to age very well! Always invest at your own risk! Im basing this trade over the next 3 to 12 months. Don't sleep on Algo!
observingthetrade

Potential For Exponential Growth In Near Future Algorand could make a bullish reversal on the daily chart continuing the rally thats been happening. Price has been very suppressed on this project if you look at the larger timeframes. The boom/bust symmetry is there and there is now potential for exponential growth! The coins ATH is $3.15 or 23x the current price. The Weekly & Monthly chart are showing strength in multiple indicators. If the .14c area can be confirmed as support I believe we could see a real pump in this altcoin. Need a strong close on the weekly candle above 13 cents. TV please don't delete my post! This chart has the potential to age very well! Don't sleep on Algo!
Disclaimer
Any content and materials included in Sahmeto's website and official communication channels are a compilation of personal opinions and analyses and are not binding. They do not constitute any recommendation for buying, selling, entering or exiting the stock market and cryptocurrency market. Also, all news and analyses included in the website and channels are merely republished information from official and unofficial domestic and foreign sources, and it is obvious that users of the said content are responsible for following up and ensuring the authenticity and accuracy of the materials. Therefore, while disclaiming responsibility, it is declared that the responsibility for any decision-making, action, and potential profit and loss in the capital market and cryptocurrency market lies with the trader.