
nicktussing77
@t_nicktussing77

What symbols does the trader recommend buying?
Purchase History
پیام های تریدر
Filter
nicktussing77
TSLA TO 1600, YOU SAW IT HERE FIRST
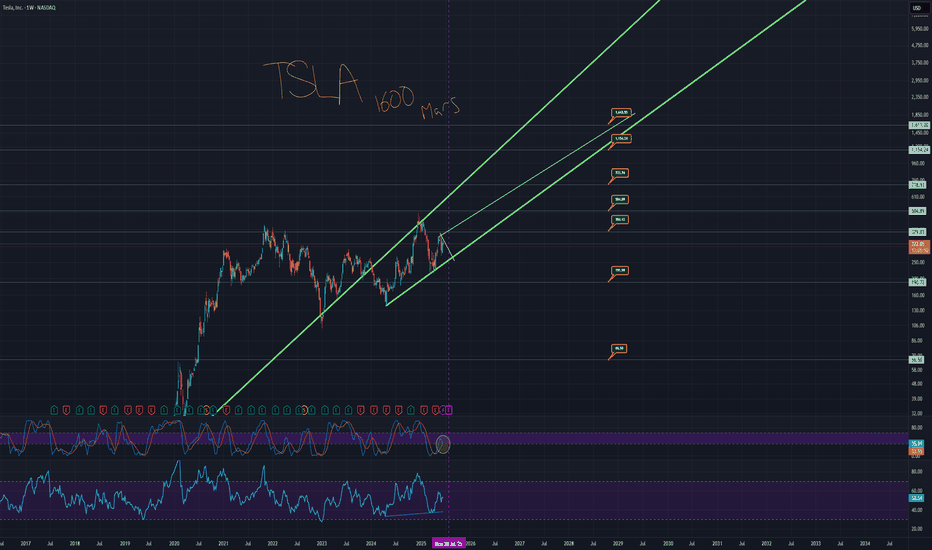
Here's the TA that takes Tesla legitimately to 1600. The monthly chart has a trend that is currently acting as support. The price has fallen under that trend. Price action is also over a massive support trend from the weekly chart. These are the two thickest green trends. When you zoom back and look at TSLA as a whole, you see the bigger picture. You have a situation where the low side takes you to around $60 to 70 dollars with a low of around $48. And then you have the high side taking you to around 1600. It sounds like a candidate for a stock reverse split. Essentially, don't miss out on this potential solar data fast car thingy ready to really zoom. Here is the chart with the auto fib numbers showing potential targets. Remember, this likely doesn't occur all in one night, but the projection is really looking like it takes off from earnings. Projection line in yellow. You have an opportunity where short term trends go to a strong long term trend which climbs to a support trend meaning price can literally take off from multiple of these trends meaning, we can price action go from 420 down to 250 and back up to 1600 in less than a year total.
nicktussing77
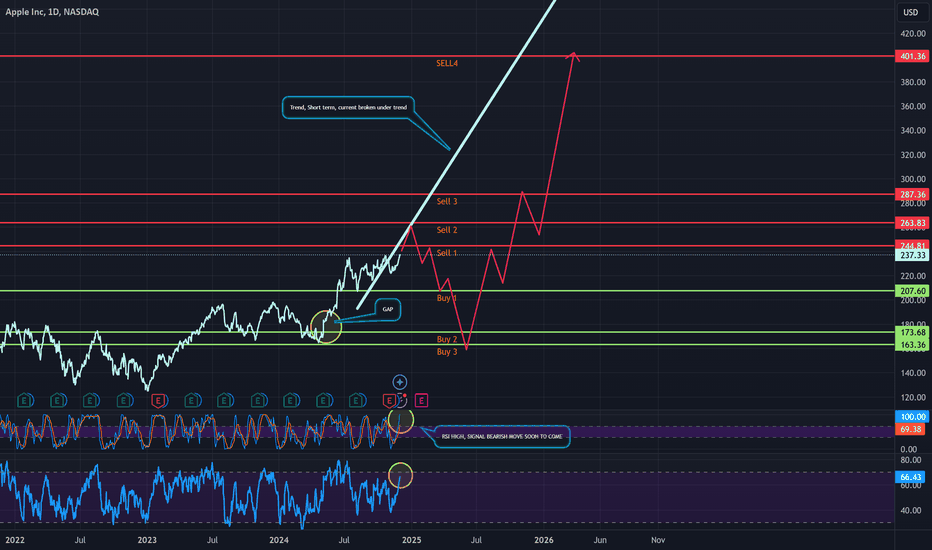
APPLE A FRESH APPLE TO BITE
The chart for Apple (NASDAQ: AAPL) shows the following key elements: Rejection Trends: Marked in red, indicating levels where the price has faced resistance and reversed. Support Levels: Marked in green, with horizontal support indicated by dotted lines, showing price levels where the stock has historically found buying interest. Price Targets: Marked with specific values, suggesting potential future price levels based on the analysis. Guideline: Represented by a dashed line, likely indicating a trend or channel guideline. RSI and Trends: Displayed at the bottom, with the Relative Strength Index (RSI) and additional trend indicators in colorful lines. Earnings: Marked with purple dashed lines, highlighting significant earnings dates or periods. The chart covers a timeframe from mid-2023 to June 20, 2025, with the latest data point at 12:07 AM EDT on June 20, 2025. Watch out, because there is a price target to 169. Meaning, we need to be careful. There is also a price target to 280+ which has support of indicators. Heading into earnings we might see the 215 mark which could see a slight drop to around 205, and then could see a climb over months to 280. Even 300+ Watch the trends, and price targets, if at trend, look to sell or buy depending on if support or resistance.
nicktussing77
BTC USD 180K BIG HOW?

Trends and price targets is how, but realistically, it looks like 134k in the short term. Drop is wicked if it were to occur, takes price to literally 12k, which you want to go all in if that occurs. 55k is another drop zone. Otherwise, it looks fairly bullish. buy zone marked in green, sell in red. watch the trends and price targets are pretty accurate usually. good luck!! Custom charts by request.Careful to 91k
nicktussing77
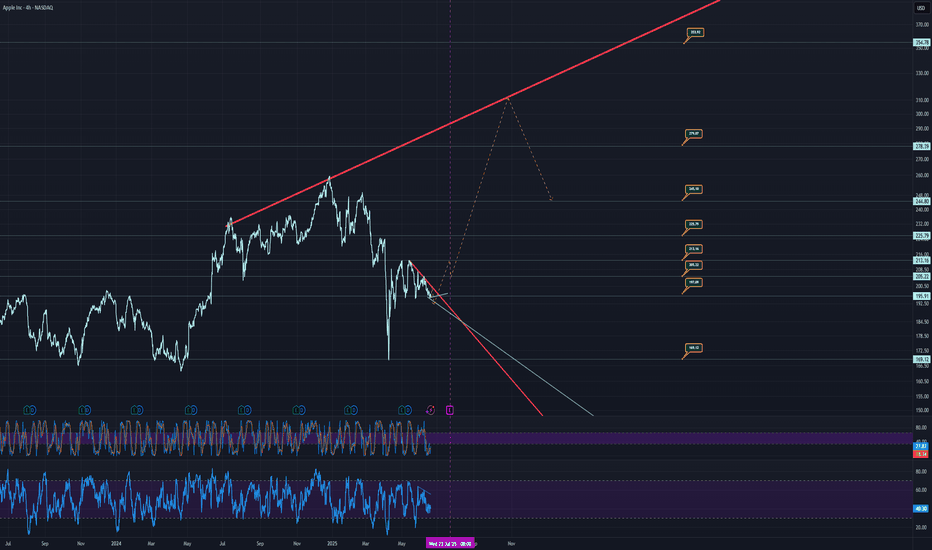
APPLE Big circle building edition
Smart phones, some of them look pretty nice tbh. However, something I read recently about cloud storage really interested me with apple. Among other things obviously, like big stacks of cash. Apple has a lot of money essentially. Apple has a lot of talented people. SF real estate is scary. TA and chart description. basically, we are under a short term trend break and have a lot of indicators pushing a top with a drastic overextension, so you might expect a possible rebound from all of that in alignment. Which you can then notice the gap at 154, and see how it can close that gap and essentially climb in a stable path to nearly 400 after creating some massive support at the 263 mark. Excited to see how this one moves in price, Excited to see what apple comes out with in the future. Good luck trading. Guideline is to show the idea, try not to follow it, instead focus on the price targets and trends.looking good so far! However, you might want a new chart with updated trends.
nicktussing77
COIN BASE, LIKE A REAL BASE? OF COINS? CHART
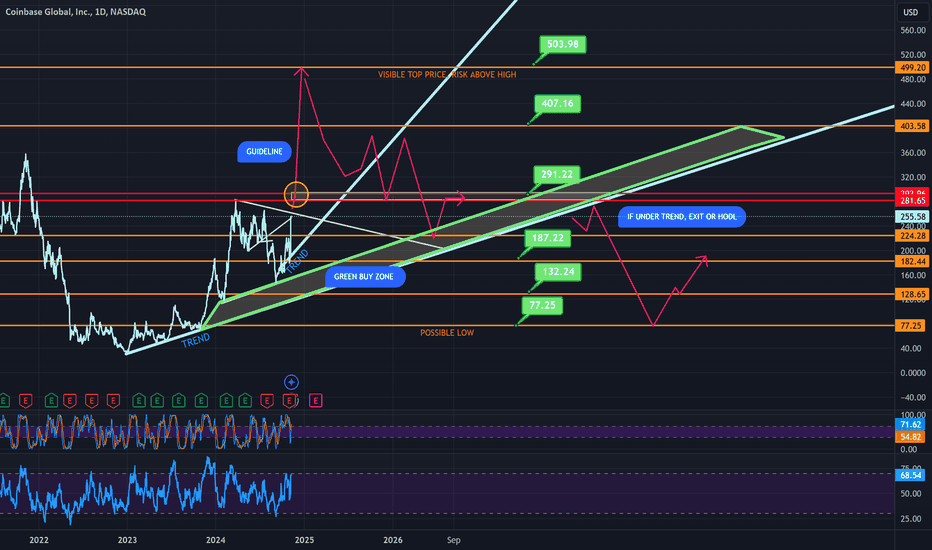
Trends are marked, as are price targets and guidelines—though the latter shouldn't be followed, they do project a significant move to maintain COIN's bullish trend over a longer period. Major resistance lines are noted; however, be vigilant for a trend break, which could signal an exit if you're trading. The maximum I foresee is around 525, but if the crypto market surges, those numbers could climb higher. Currently, if you're skeptical about a 'squeeze,' safer numbers are provided. I've attempted to include both bearish and bullish targets, both of which have the potential to exceed expectations. The yellow circle indicates a potential "breakout zone," but as this extends over time, it could also present significant resistance, so it's a matter of risk levels and what you're comfortable investing at that point. For the daring traders, I personally view an upward move as more probable. This isn't to say I'm endorsing a reckless approach, but it represents the more extreme side of the bullish projection. Otherwise, adhere to the established price targets and trends. A bullish long-term trend, at least, offers the opportunity to hold for the long term if a trade doesn't pan out as expected—once again, the level of risk is crucial. For those who are not fond of crypto, just consider how often you've heard the phrase, "if only I had bought BTC in 2016."
nicktussing77
LRCUSD LoopRing... Ring.. Ring. Hello?

Like a phone, lol get it? Okay, enough fun, time for the serious stuff. Loopring is at support area, where things are flipping in the bullish direction I don't know the exact point it moves, but I know .1 was an area of support on a past chart. Take this move and probably compress the line, which isn't as accurate and more a guide to show the idea of a potential trend move to the upside. Okay, here is help from AI Here's an analysis based on the chart provided: ### Overview: - **Asset:** Loopring (LRC) against USD on the BITSTAMP exchange. - **Time Frame:** Weekly chart from 2023 projected into the future until 2028. ### Key Observations: 1. **Price Movement Analysis:** - The chart displays a pattern where the price of Loopring has been oscillating within a broadening formation, often referred to as a "megaphone" pattern. This is characterized by an expanding range between resistance and support lines, suggesting increasing volatility. 2. **Technical Indicators:** - **Price Levels:** The current price is at $0.04002, with a slight decrease (-0.17%) from the previous period. - **Volume:** The volume on the trading day is 229K, indicating moderate trading activity. 3. **Trend Analysis:** - **Support and Resistance:** The chart shows potential support around $0.02700 and resistance at approximately $0.07800. The price has been bouncing between these levels, with historical attempts to break above the upper resistance. - **Divergence:** There appears to be a divergence between the price action and the RSI (Relative Strength Index). While the price has been making higher highs, the RSI hasn't followed suit, which could be a sign of weakening momentum, hinting at a possible correction or consolidation phase. 4. **RSI Indicator:** - The RSI is currently in the neutral zone, neither overbought nor oversold, which might suggest a phase of indecision or consolidation in the market for Loopring. 5. **Future Projections:** - **Trend Lines:** The chart includes two trend lines drawn in a way that suggests an anticipated breakout or continuation pattern. The upper line acts as a resistance that has yet to be decisively breached, while the lower line serves as a support. Given the broadening pattern, there's an expectation of a significant move, but the direction is uncertain based on this chart alone. 6. **Volume Analysis:** - The volume bars show periods of high volume followed by lower volumes, typical in a broadening pattern where the market tests new highs and lows with less conviction each time. ### Potential Scenarios: - **Bullish Scenario:** If the price breaks above the upper resistance line with strong volume, it could signal a bullish trend continuation. This would align with the broader market's bullish sentiment if other external factors are favorable. - **Bearish Scenario:** A drop below the lower support line could indicate a bearish trend, potentially leading to a test of lower levels, around the 0.02370 region, indicated by the horizontal line. ### Trading Strategy Implications: - **Entry Points:** For a bullish trade, one might look for a confirmation of a breakout above the resistance with increased volume. Conversely, for a bearish stance, a break below support could prompt a short position. - **Exit Points:** Setting stop-losses just below support or above resistance could help manage risk effectively. For profit-taking, aiming for the next significant resistance or support levels as shown might be strategic. ### Recommendations: - **Wait for Confirmation:** It might be wise to wait for a clear breakout in either direction before committing to a trade. False breakouts are common in broadening patterns, so volume and price action confirmation are crucial. - **Time Frame Considerations:** Given the long-term nature of this chart, this analysis might be more suited for swing trading or long-term investment rather than day trading. - **Backtesting:** Before live trading, backtest any strategy you might derive from this chart against historical data to gauge its effectiveness. - **Market Sentiment:** Keep an eye on market sentiment and news related to Loopring or the broader crypto market. Fundamental analysis might also be necessary to understand why such patterns are forming, especially in the context of broader market trends. ### Conclusion: The chart suggests Loopring might be at a critical juncture, potentially poised for a breakout. However, the broadening pattern's nature implies caution, as it can lead to either a significant rise or fall. Traders should use additional tools like moving averages, MACD, or Fibonacci retracement for more refined entry and exit points. Given the chart's time frame, patience and a cautious approach are recommended. Always remember, in trading, patience can be a virtue, and understanding the broader market context is crucial. Remember, this is not financial advice, and while technical analysis provides insights, it's just one tool in a trader's toolkit. Always consider combining TA with fundamental analysis and market sentiment for a more comprehensive view.
nicktussing77
LRCUSD LOOPRING IS THIS THE END?

not really, unless something super major happens which is outside of TA and puts the coin down to nearly nothing. Overall, RSI is bearish, but gearing up to move bullish for at least a little bit, at which point, it can reject the short term trend and continue to funnel down or it doesn't and the short term trend ends up moving LRC to the higher price targets. Everything is marked on the chart. This is the Monthly view so really long term viewpoint. Anyway, all the other LRC charts cover a lot of the moves, trends and price targets so this one is staying simple.
nicktussing77
DOGECOIN MAJOR BUY ZONE INCOMING AND POTENTIALLY LOWER?

Here's the important numbers for doge at the moment. You can adjust them a bit for your needs.There is some really short term indicators that, when reset, put everything in alignment to see a lot of bullish movement coming into DOGE. Again, because the market is the market it can easily break through this strong trend it's about to hit.Good news is it falls to support at .0888Even better news, should it fall more, there is support at an even lower level, likely. I'd be looking to see if I can get my position set soon. I think there is a bullish future for this good dog. Watch SHIB for a bigger move to the upside, with a drop that would be to basically zero. Doge has the support to take it up to .29 and maybe even .45, and as quick as dogecoin can confirm a jump like that, you'll see it at probably $10. I've been consistently super bullish on this coin, and currently, I'm liking the look of the chart.it can catch and really rocket, lots of price targets to act as support. Otherwise a retracement isn't crazy and I'd use the trend on that one.Doge is nearing the limit of this chart, turns out major was really major, haha. So what next? I can't say, crypto is risky and volatile. What I can say based on what I see, with the chart and information I can find. I like the long term potential of doge, so, as the chart tops out at these numbers, Long term holders shouldn't feel bad about seeing it drop some 30 or 40% and then moving up again, just as fast. Which is where it comes to short term traders. If you hit the signal, and you're in it for profit, there is no reason to not take some profits and reset a position. Obviously stay with your trading strategy to minimize risk or missed out profits, however, what the short term traders will be looking for is another trend breaking into support with a bearish trend (rejection trend) trading in the upwards direction, which doge actually does have on long term charts, which leads back into the long term, it looks great. Other than that, I haven't looked at the chart on a timescale for the short term trading, as I've liked this coin a long time. SummaryProfits are good even if you miss out.Long term means long term, don't worry about the in-between moves in a market such as this.Look for another trend break leading to an upper rejection trend in alignment with climbing support that essentially increases in spacing where you can see those bigger moves projected as a potential move (remember, nothing is guaranteed) Find lots of info and then even try to make your own chart, it's a great way to learn. Personally, big fan of Doge, name my dog Doge so I love the coin. I like the features of X premium, worth a look if you enjoy other elon products/companies.The ELAWN mower, solar powered robot grass cutter with vampire teeth.
nicktussing77
WOOF WOOF BARK BARK DOGE THE GOOD BOY

Doge chart looking really nice.Not much to say.Labeled most things on the chart. Trend support picked up price action.Big time trend support.This is the kind of thing you want to see before a few hundred percent gains. Good luck.
nicktussing77
BITCOIN VS THE EMA's (COLORFUL LINE EDITION)

Another crazy looking chart. Here's a neat chart that gives a picture of BITCOIN when you look at it from a bigger picture. This is a scary point for BTC, it's somewhat on the edge of a cliff. And if you look at the EMA's, There are a few times when they have looked this overextended with the smaller EMA starting to come down closer to the 20. Marked with flags. So what does this chart mean? Does it mean BTC will definitely go to 17k? Idk, hard to say, but what I can say is bitcoin has some weird indicators and weird spring like trends starting to form. Cycle wise, we should be topping out. Which can really take the price down low. But when we project out the numbers, and see BTC as a whole, and then consider where the price could be (100k to 1.2mil) we can see that a drop to 17k before a run to 120k wouldn't be the worst thing in the world as it allows the price to settle over the 50k mark, probably for a very long time. But can we assume a drop to 17k? No. But we can project where a drop with a springlike move to the upside can take us. So to follow the chart, connect the colors. IF drop takes us to blue, and holds, good chance, we head back to blue. If drop takes us to red, assume bounce back is huge. I wouldn't be surprised to see 41 to 38k again in the near future. If we start to break out, catching support at 62.9, watch for a sharp 70 or 80k rejection into a very similar move (steep drop, big return). If downside is sharp and fast, it likely returns to 52k to 62k pretty quickly, which then allows for the same confirmation at 62.9 without the need to return to 17k. That breakout at 62.9 with the downside having already completed should likely be a "launching point" in price, taking us to that 120k price target. Why can we see such a big movement in a short period of time? I'd assume or guess that it has to do with the nature of bitcoin, the news a crash could cause, a rush of institutional buying, and a drop in the overall market, and panic, lots of panic. NOTE: Projection line is a rough guess at best to show an idea, follow the price targets, as again, it doesn't have to drop that far, it doesn't have to drop that fast. But if it does, at least this chart will give you a rough idea of when you could try to buy into that fear.yellow to yellow, orange to orange, red to red. Be careful, no big deal if profits need to be locked in to limit risk and maximize profits. Other than that, no opinion on price movement in short term, I haven't looked close enough. good luck everyone! Alt coins maybe. The barking ones.
Disclaimer
Any content and materials included in Sahmeto's website and official communication channels are a compilation of personal opinions and analyses and are not binding. They do not constitute any recommendation for buying, selling, entering or exiting the stock market and cryptocurrency market. Also, all news and analyses included in the website and channels are merely republished information from official and unofficial domestic and foreign sources, and it is obvious that users of the said content are responsible for following up and ensuring the authenticity and accuracy of the materials. Therefore, while disclaiming responsibility, it is declared that the responsibility for any decision-making, action, and potential profit and loss in the capital market and cryptocurrency market lies with the trader.