Technical analysis by nicktussing77 about Symbol AAPLX: Buy recommendation (6/20/2025)

nicktussing77
APPLE A FRESH APPLE TO BITE
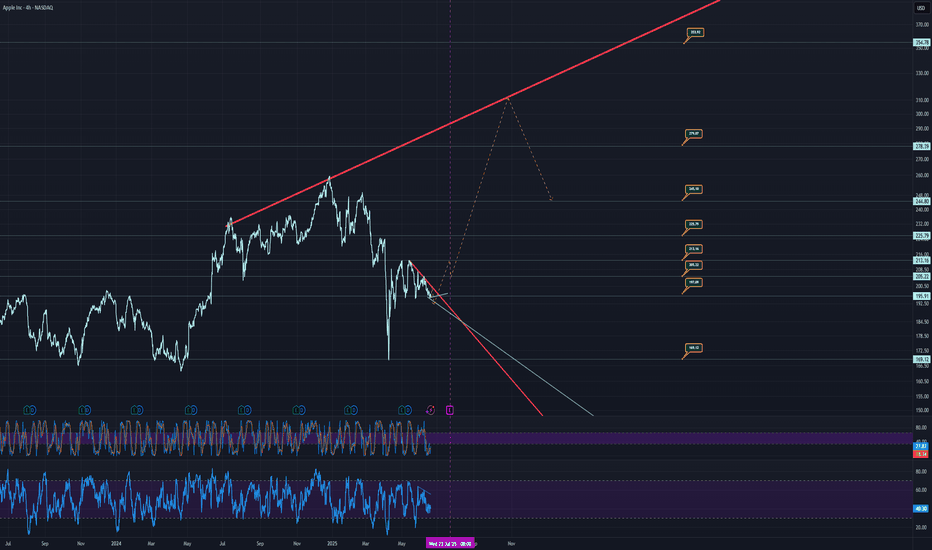
The chart for Apple (NASDAQ: AAPL) shows the following key elements: Rejection Trends: Marked in red, indicating levels where the price has faced resistance and reversed. Support Levels: Marked in green, with horizontal support indicated by dotted lines, showing price levels where the stock has historically found buying interest. Price Targets: Marked with specific values, suggesting potential future price levels based on the analysis. Guideline: Represented by a dashed line, likely indicating a trend or channel guideline. RSI and Trends: Displayed at the bottom, with the Relative Strength Index (RSI) and additional trend indicators in colorful lines. Earnings: Marked with purple dashed lines, highlighting significant earnings dates or periods. The chart covers a timeframe from mid-2023 to June 20, 2025, with the latest data point at 12:07 AM EDT on June 20, 2025. Watch out, because there is a price target to 169. Meaning, we need to be careful. There is also a price target to 280+ which has support of indicators. Heading into earnings we might see the 215 mark which could see a slight drop to around 205, and then could see a climb over months to 280. Even 300+ Watch the trends, and price targets, if at trend, look to sell or buy depending on if support or resistance.