
mycotoxin
@t_mycotoxin

What symbols does the trader recommend buying?
Purchase History
پیام های تریدر
Filter
mycotoxin
سیگنال خرید بیت کوین: هدفهای شوکهکننده ۱۰۷k و ۱۱۵k پس از الگوی خاص!
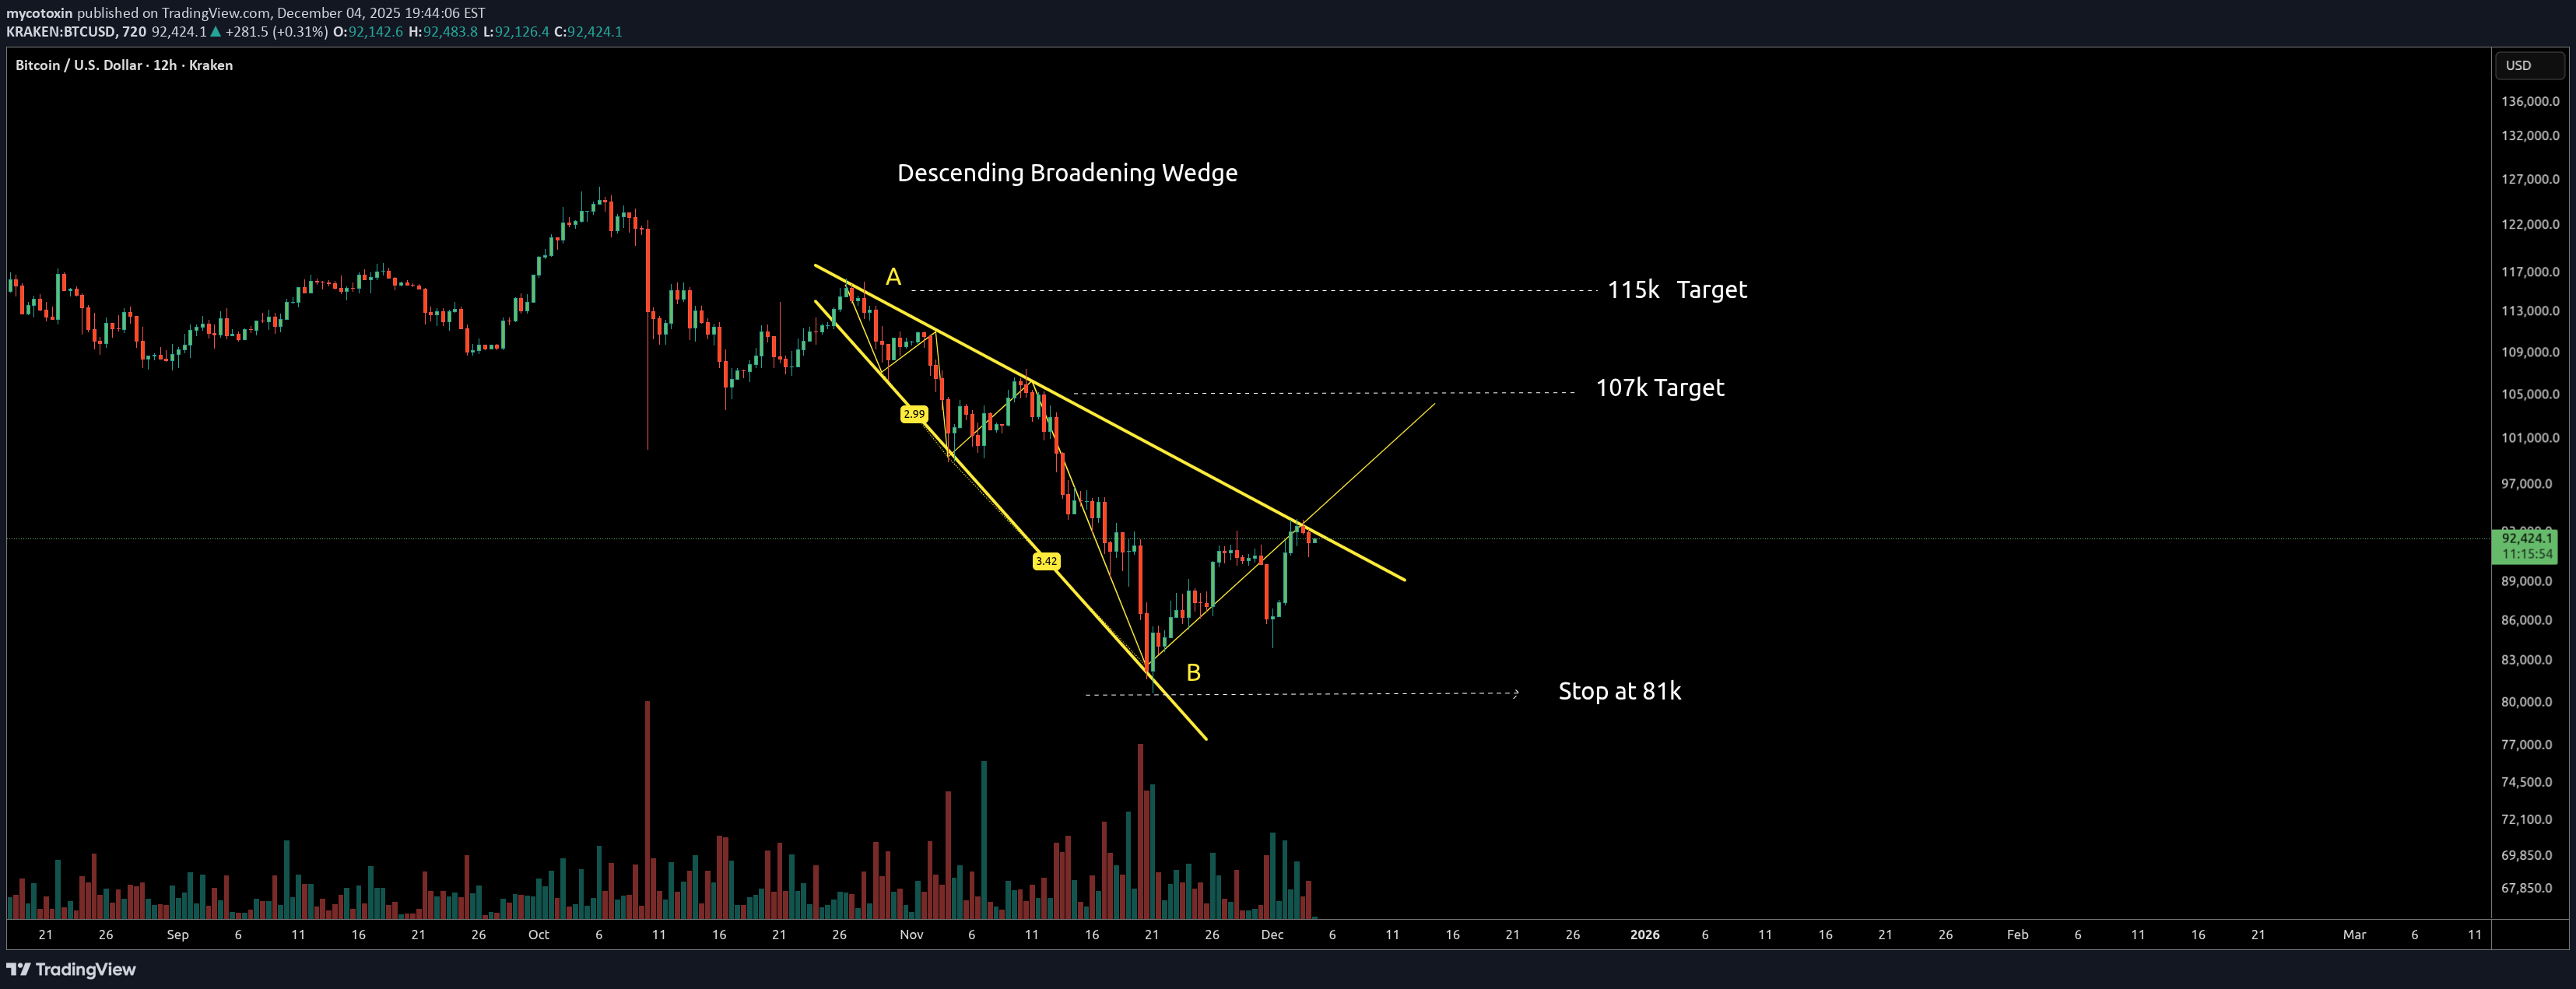
A Descending Broadening Wedge is visible on the BTC 12 hour chart. This can offer a quick trade opportunity as these patterns typically break upwards more often than not. The wedge shows expanding price action with lower highs and lower lows. Points A and B mark where price touched the wedge boundaries. Right now price is testing the lower trendline support. Trade Plan: Stop Loss: Must be set at 81k (bottom of the wedge). If it breaks below this, the pattern is invalidated. Target 1: 107k Target 2: 115k (top of the wedge/measured move) Things to Watch: Wait for a breakout above the upper trendline for confirmation Volume should pick up on a real breakout 81k is critical support - a clean break below kills the setup
mycotoxin
سقف دوقلو در ZEC: هدف قیمتی ۲۷۳ کجاست؟
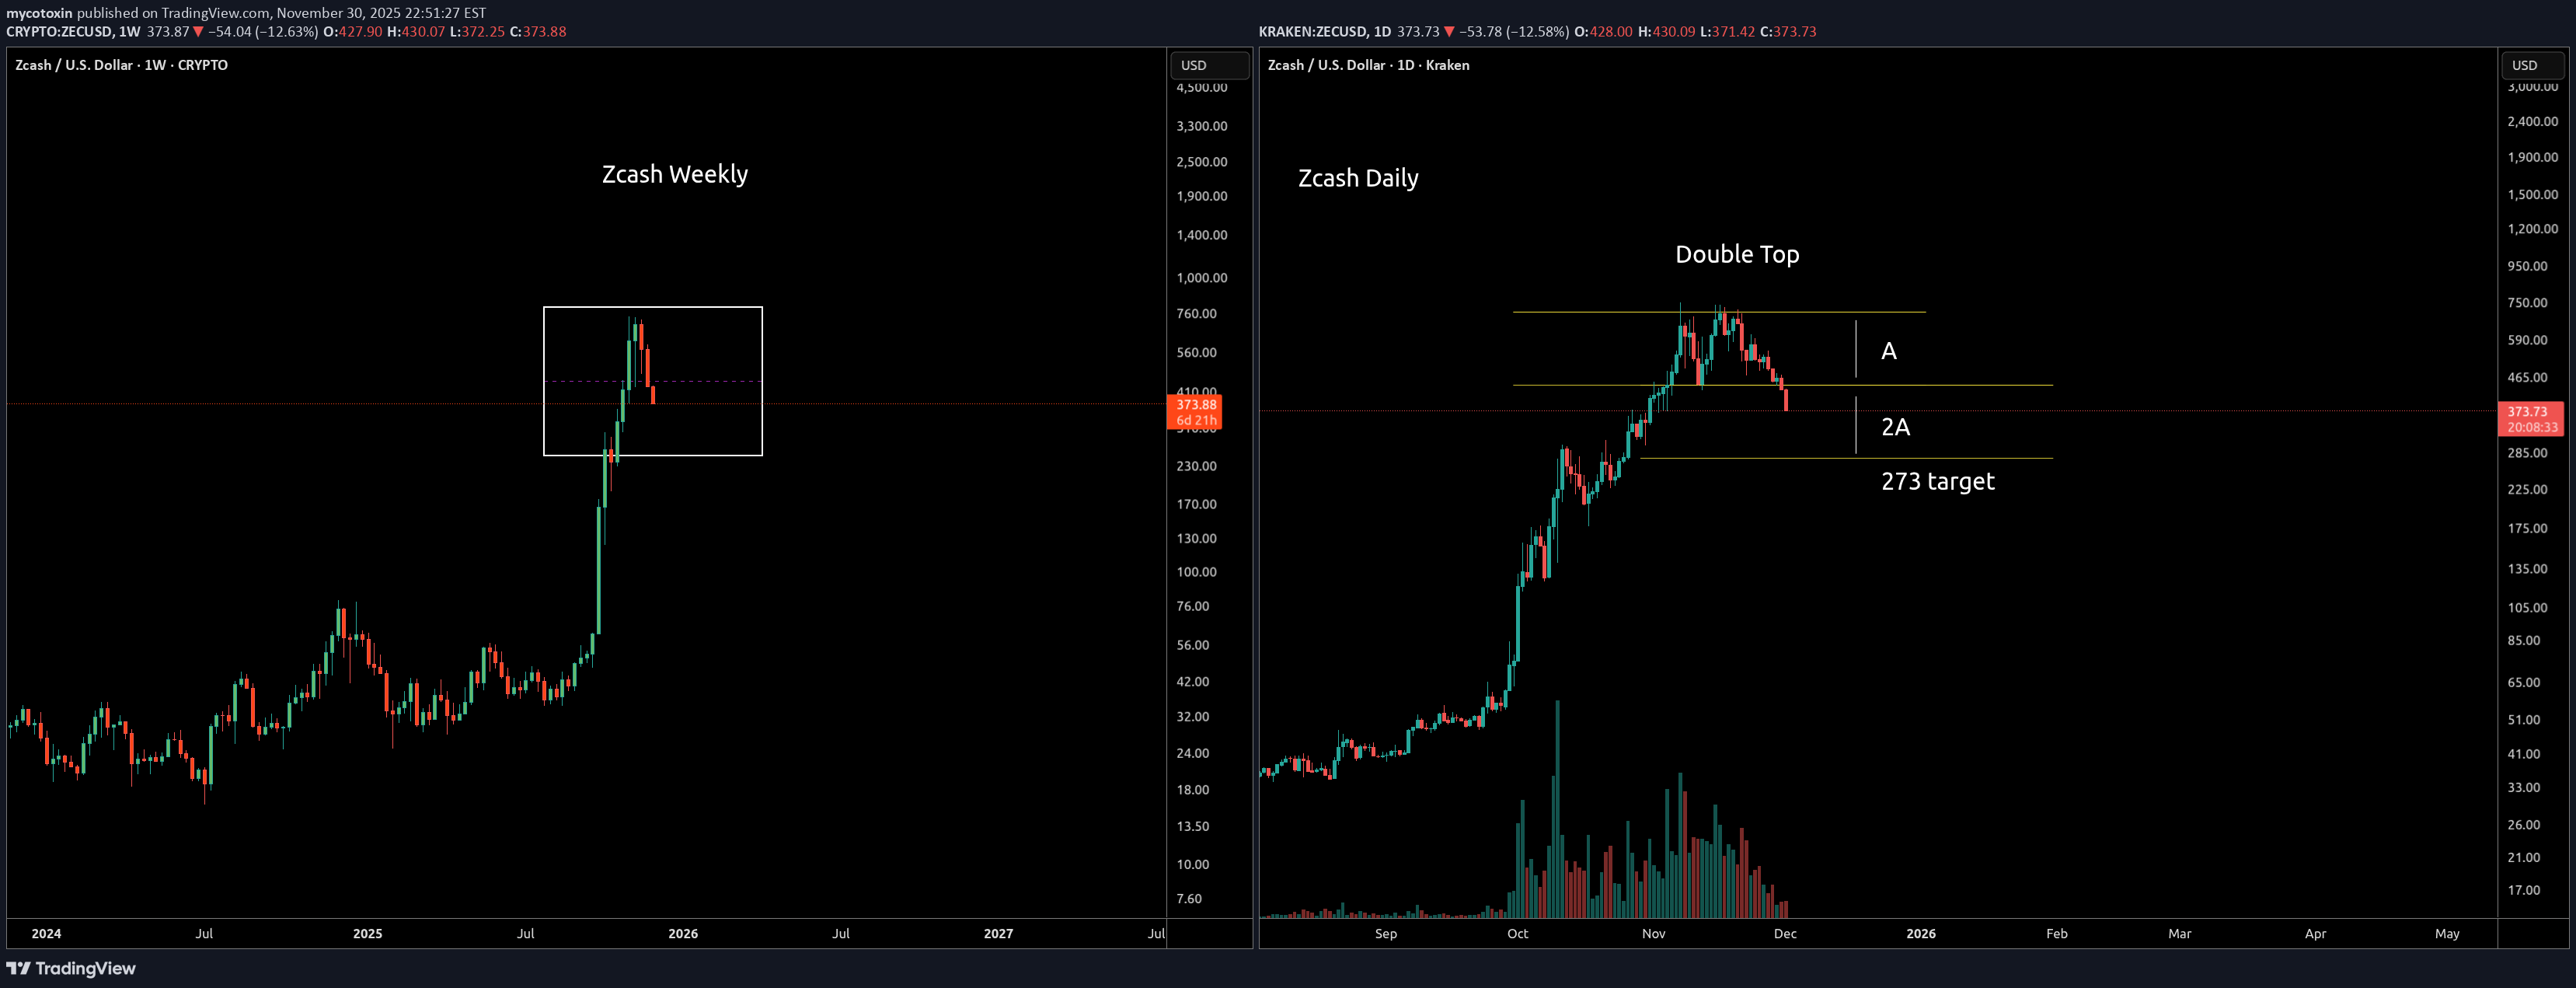
Zooming in on the weekly pattern shows a double top on the daily . The target for a double top is 2 times the height of the double top. Hence if the distance shown is A the target of the double top will be twice A (2A) which is approximately 273 My thought is this is part of a larger pattern with a 10K target once the consolidation completesWhy 10K ? ============ because a look at the far left side above the resistance line shows there is no resistance after that area - its a straight move up; Hence as price moved down quickly past that area I expect it will similarly move up fast when it reaches above this zone.
mycotoxin
آیا زِدکش (ZEC) آماده جهش به ۱۲۰۰ دلار است؟ راز شکست مقاومت ۷۶۰ دلاری!
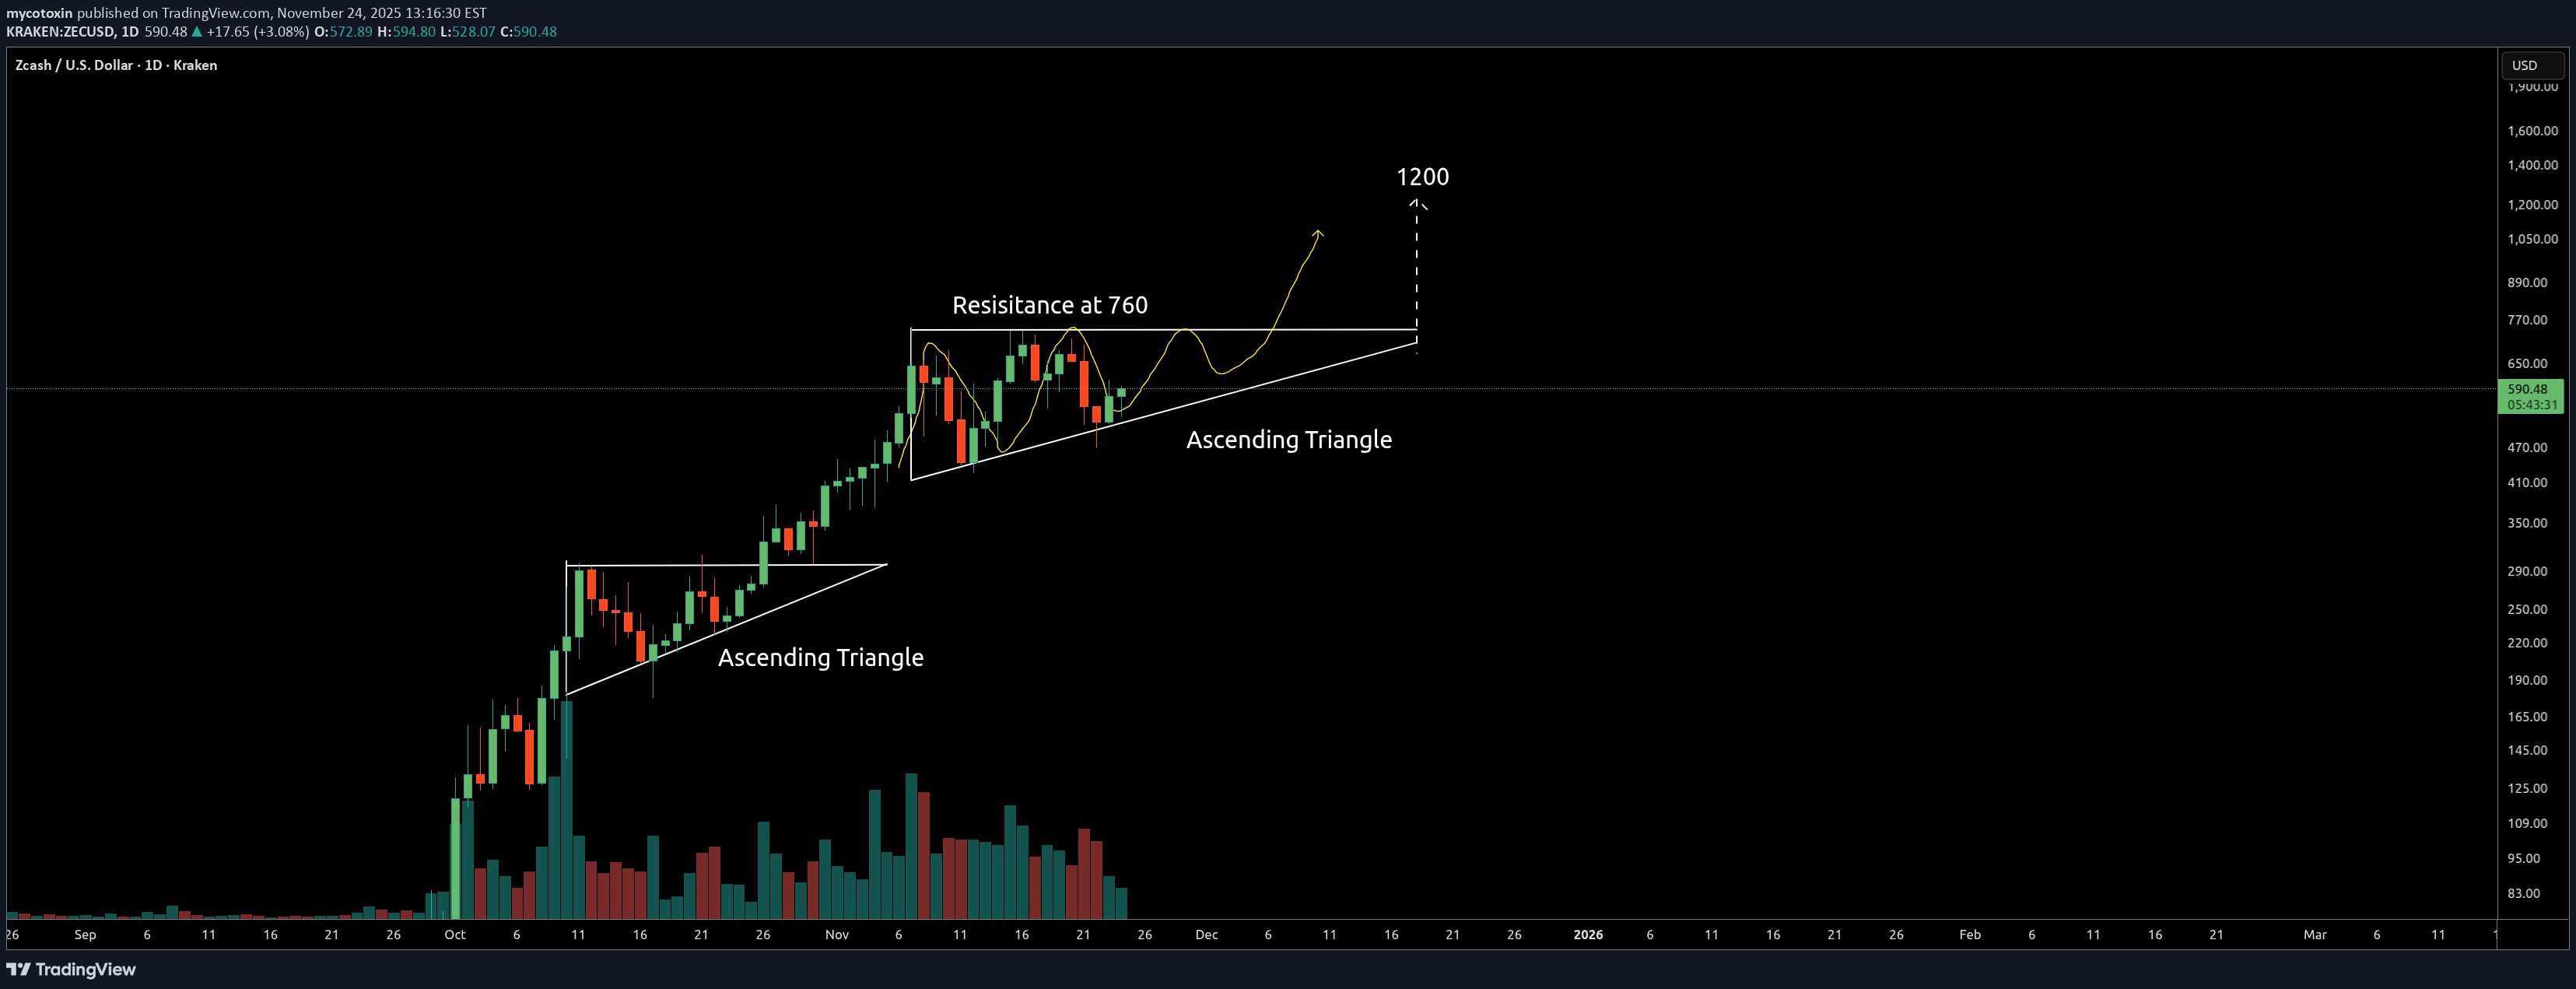
From the chart, Zcash appears to be forming a bullish ascending triangle on the daily time frame. A bullish ascending triangle typically forms after an uptrend and is characterized by a sloping trend-line at the bottom, formed by two or more consecutive higher lows. The top of the pattern is formed by drawing a horizontal line connecting two or more highs that create a resistance level. In this case, resistance sits at the $760 area. For the ascending triangle to be successfully confirmed, ZEC will need to remain in the pattern and close above the $760 resistance on the daily timeframe. A clean break above $760 followed by a successful retest could then pave the way for a move toward the $1,200 area. If this breakout completes, I'd expect it to happen around the first week of December. However, if ZEC fails to break above the $760 resistance, I'd expect a move down to support at around the $400 zone. Volume will be critical to watch here - a breakout above $760 should be accompanied by a strong volume spike to confirm buyer conviction. Without volume confirmation, any move above resistance could be a false breakout. As always good luck and this is just my technical observation and not financial advice; hence always DYOR.
mycotoxin
کشف بزرگ بیت کوین کش (BCH): راز انباشت 8 ساله که همه نادیده گرفتهاند!
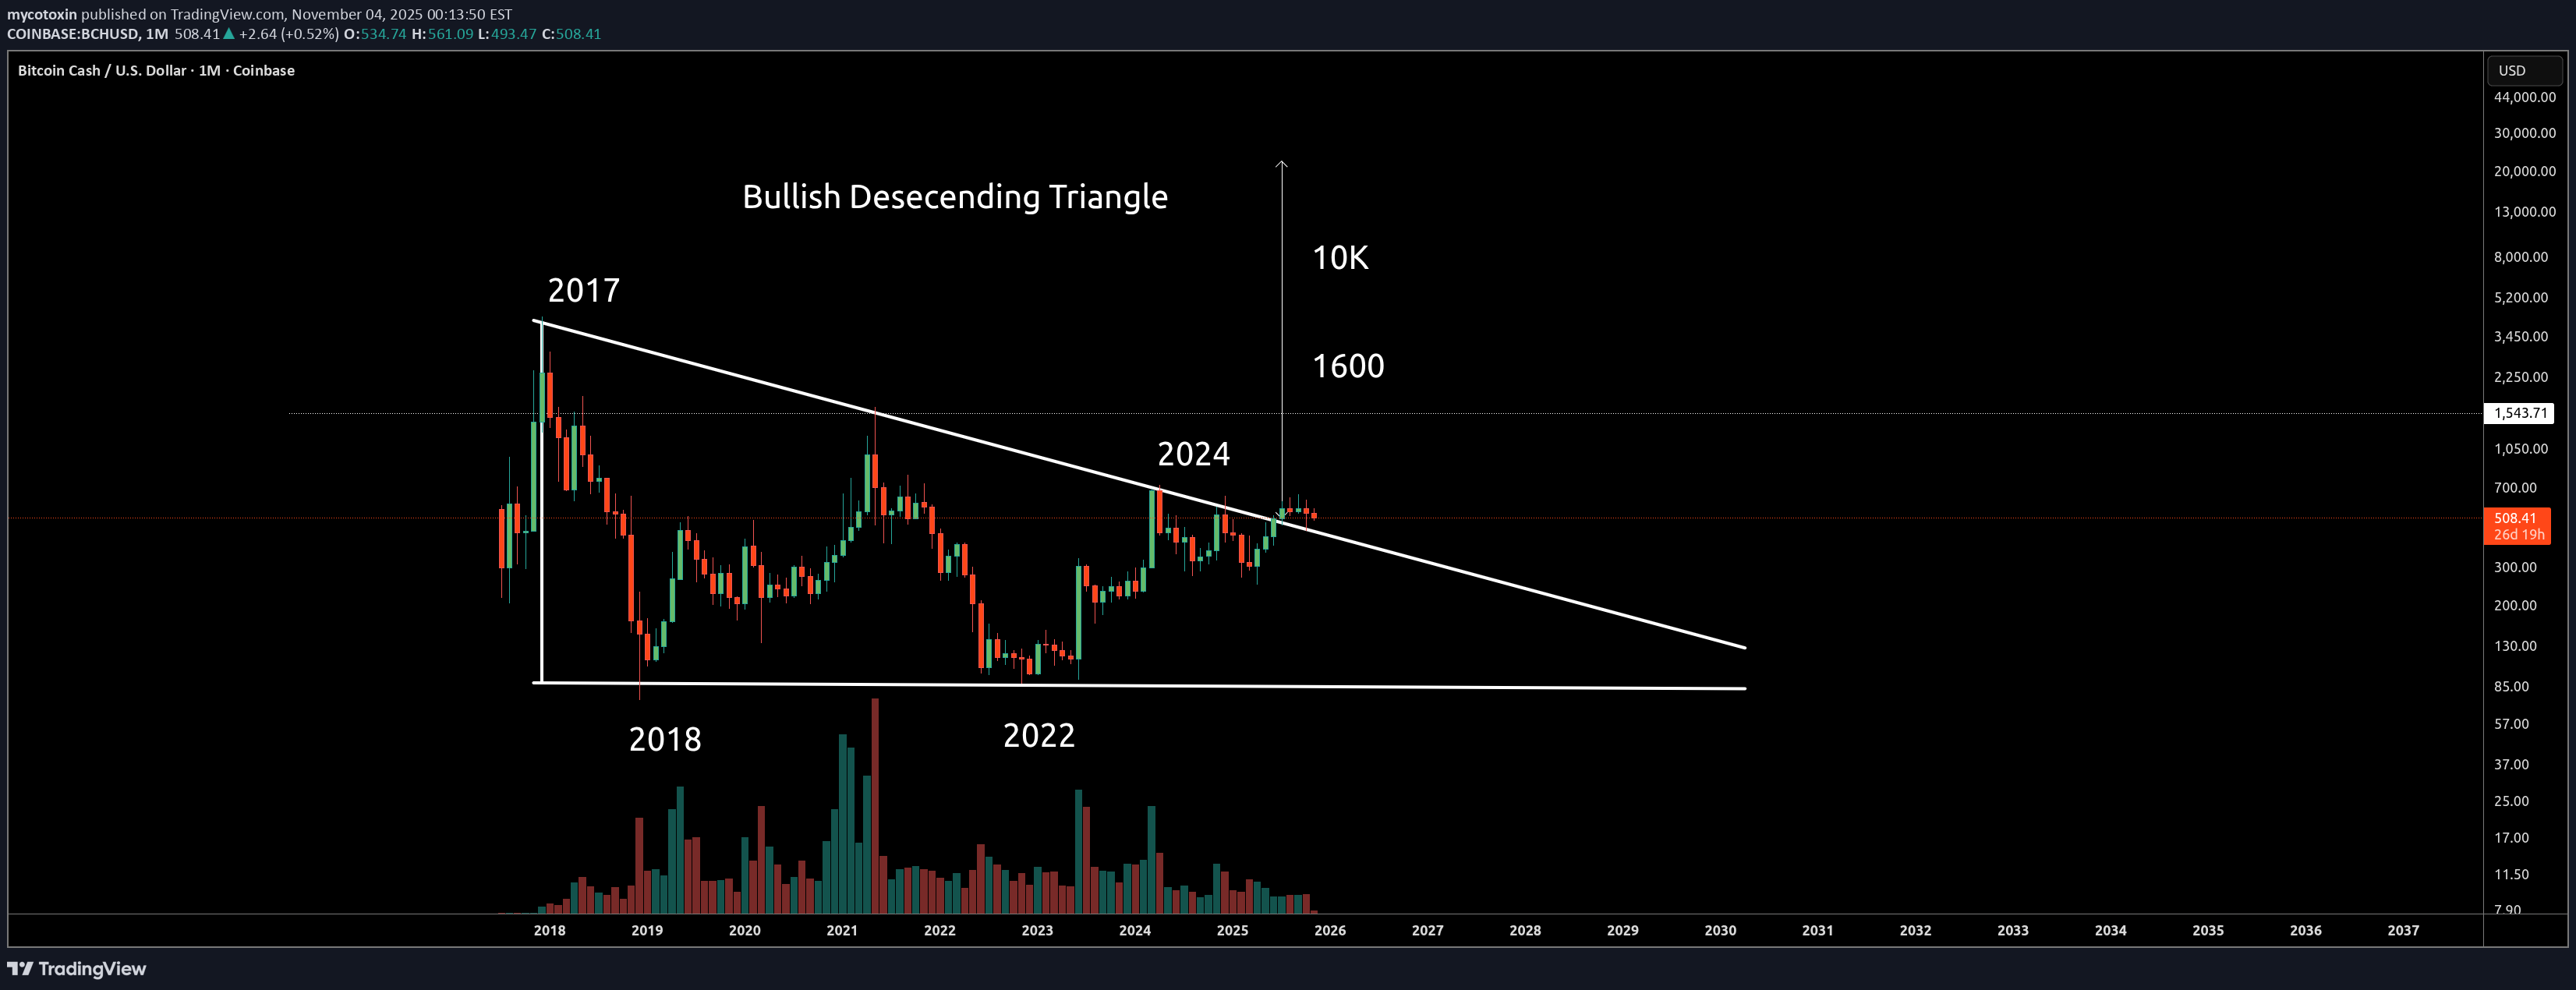
BCH is a very solid token that most people are sleeping on. Its fast, has low supply, and transaction fees are extremely cheap . BCH is also in an 8 year accumulation phase that appears to be wrapping up. The bullish descending triangle pattern is textbook and the long term targets appear to be in the 1600 and 10k range . Id even go as far as to say that BCH is going to be the surprise move of 2025/2026. The Strategy is straightforward: a) Buy b) Hold c) Forget about it d) Check back in a few months to a year and reassess I definitely wouldn't sleep on this one. The 8 year accumulation pattern doesn't lie - and when these patterns finally break out they tend to move with significant force and speed.
mycotoxin
پامپ انفجاری XRP: خروج از مثلث و هدف ۶.۸ دلار! (فقط برای صبورها)
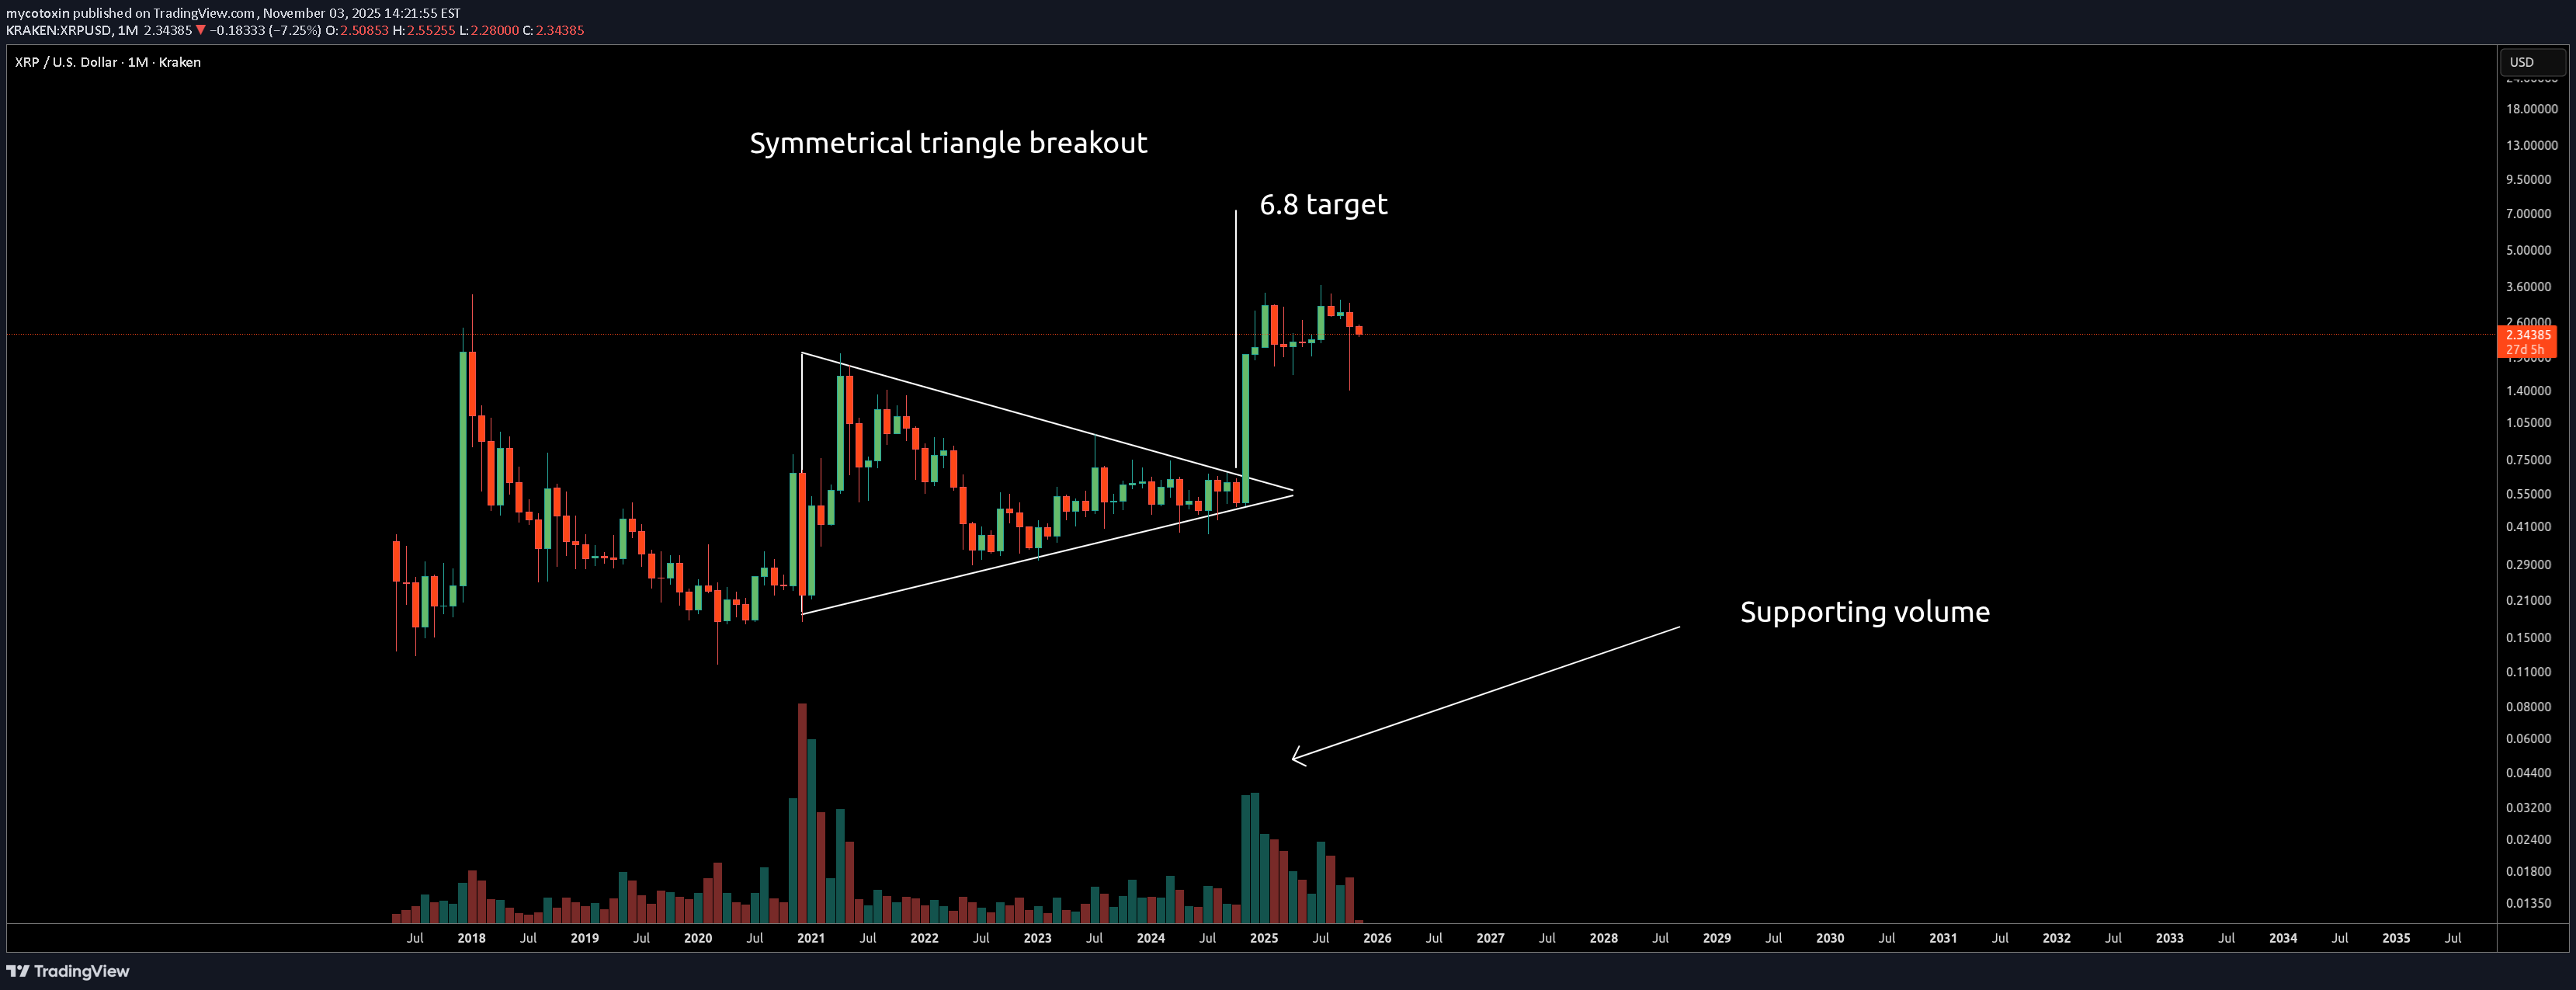
XRP looks like it just broke out of a Symmetrical Triangle with supporting volume and is eyeing a move to the $6.8 zone. XRP is unique. It's one of those coins that just does its own thing. XRP will sit there doing absolutely nothing while the rest of the market pumps, then randomly decide to move when you've completely forgotten about it. Definitely not for weak hands as XRP will frustrate the hell out of you. However, if you can wait it out, XRP delivers solid rewards. The long-term game plan should be: a) Buy b) Hold c) Forget about it d) Check back in 6 months For patient hands only. Set it and forget it and your future self will thank you.
mycotoxin
بیت کوین در مسیر هدف 150 هزار دلاری: تحلیل جدید با روش وایکوف
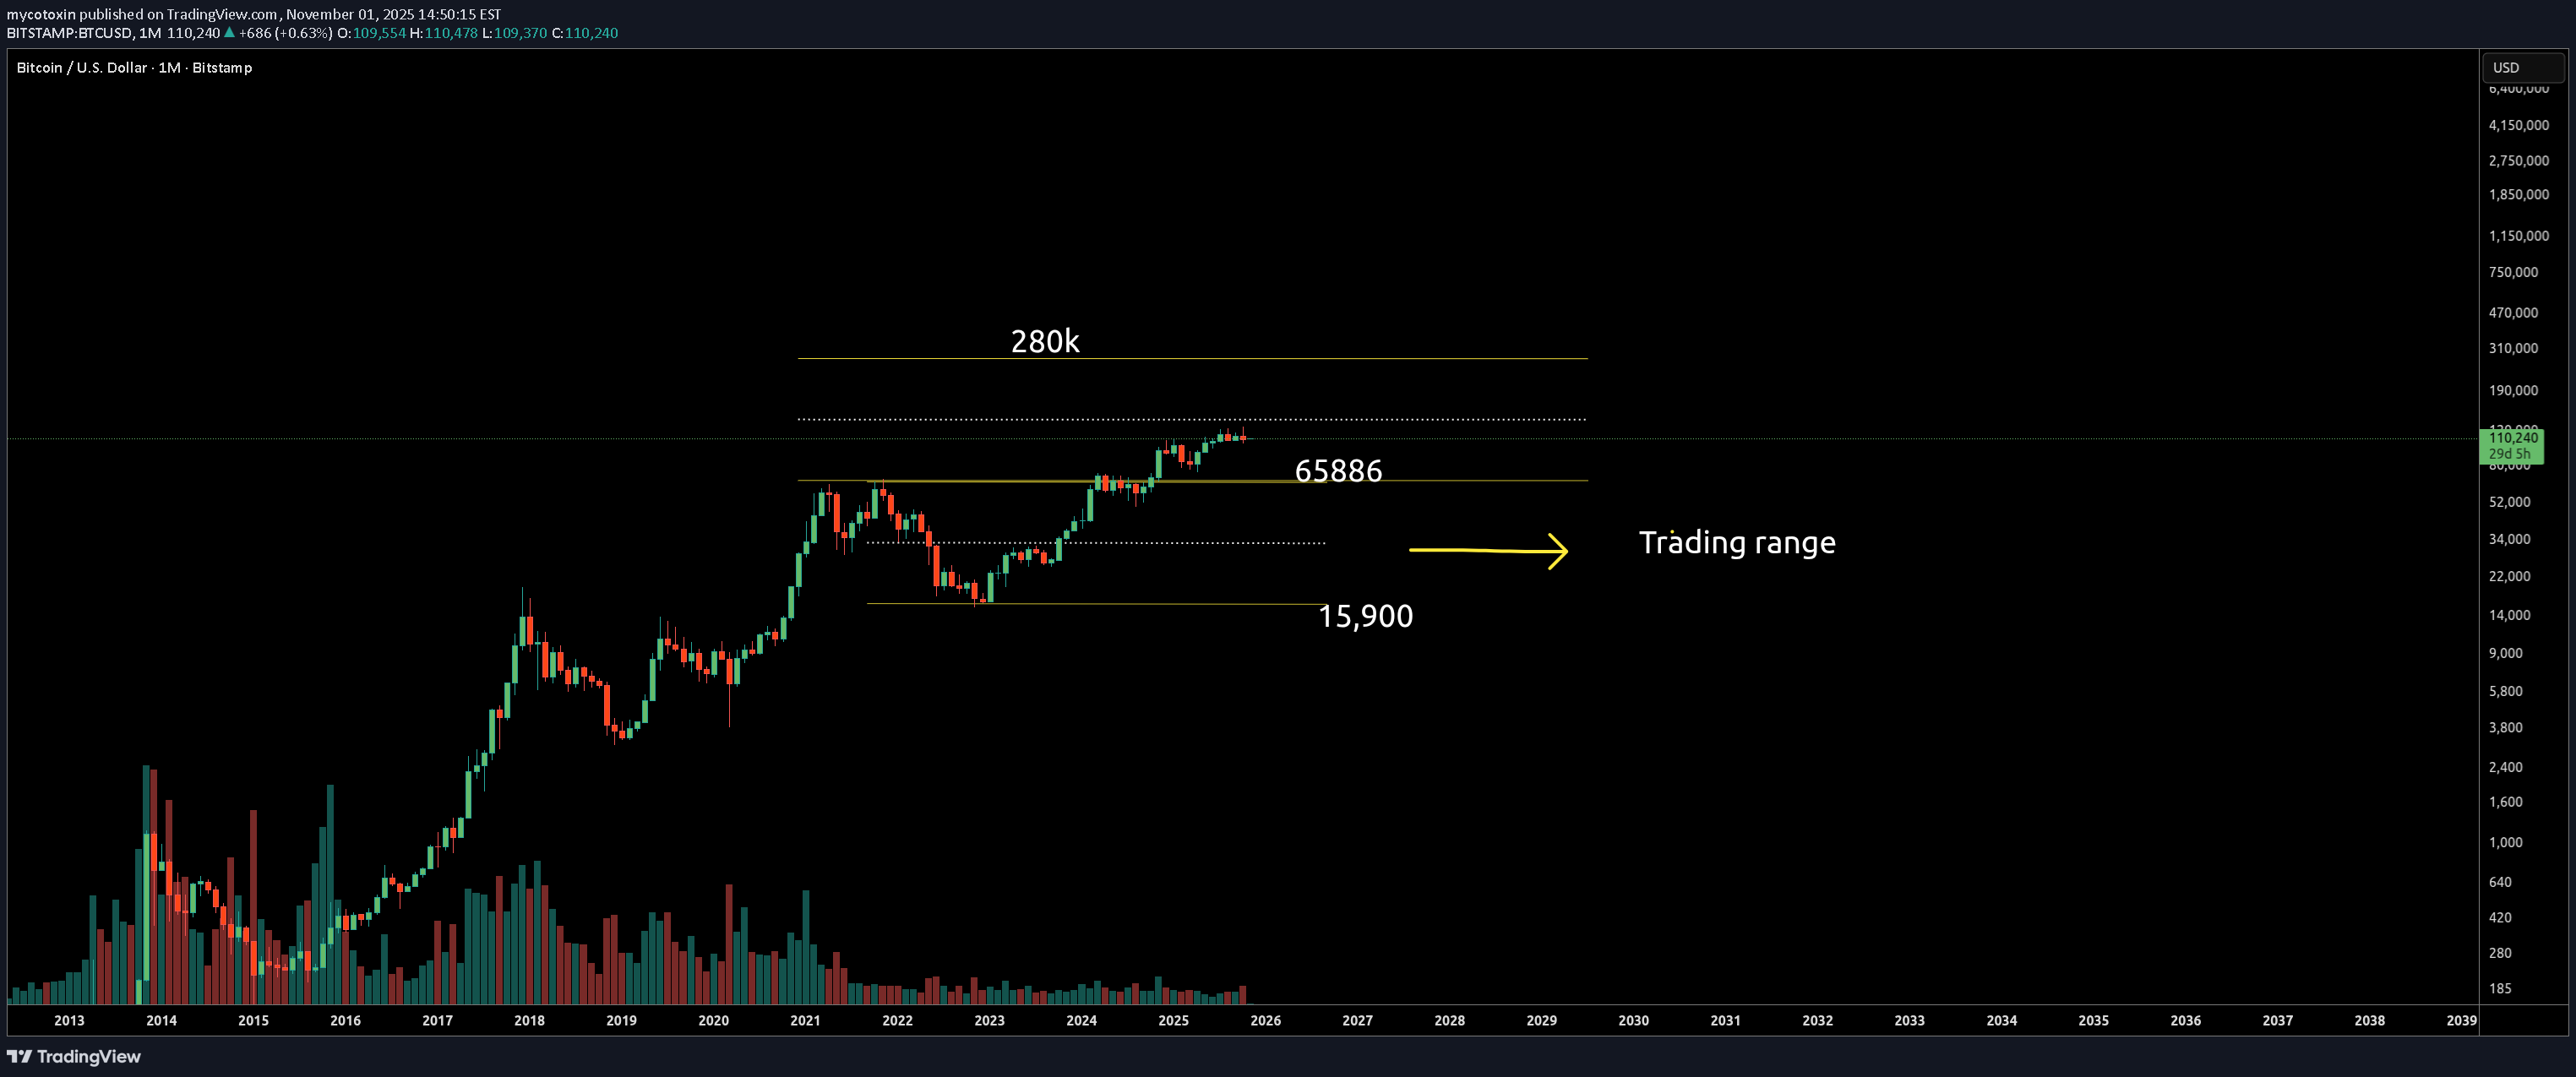
BTC is still on track for the targets from my August 2025 analysis (chart below). Applying the Wyckoff method, it's officially exited the multi-year trading range of $15,900 to $65,888 and is crawling upward. Targets remain unchanged: $137k-$150k for the first leg, followed by $250k-$280k.
mycotoxin
XLM در آستانه انفجار؟ رمز ارز قدیمی با پتانسیل صعودی بزرگ به ۱.۷۰ دلار!
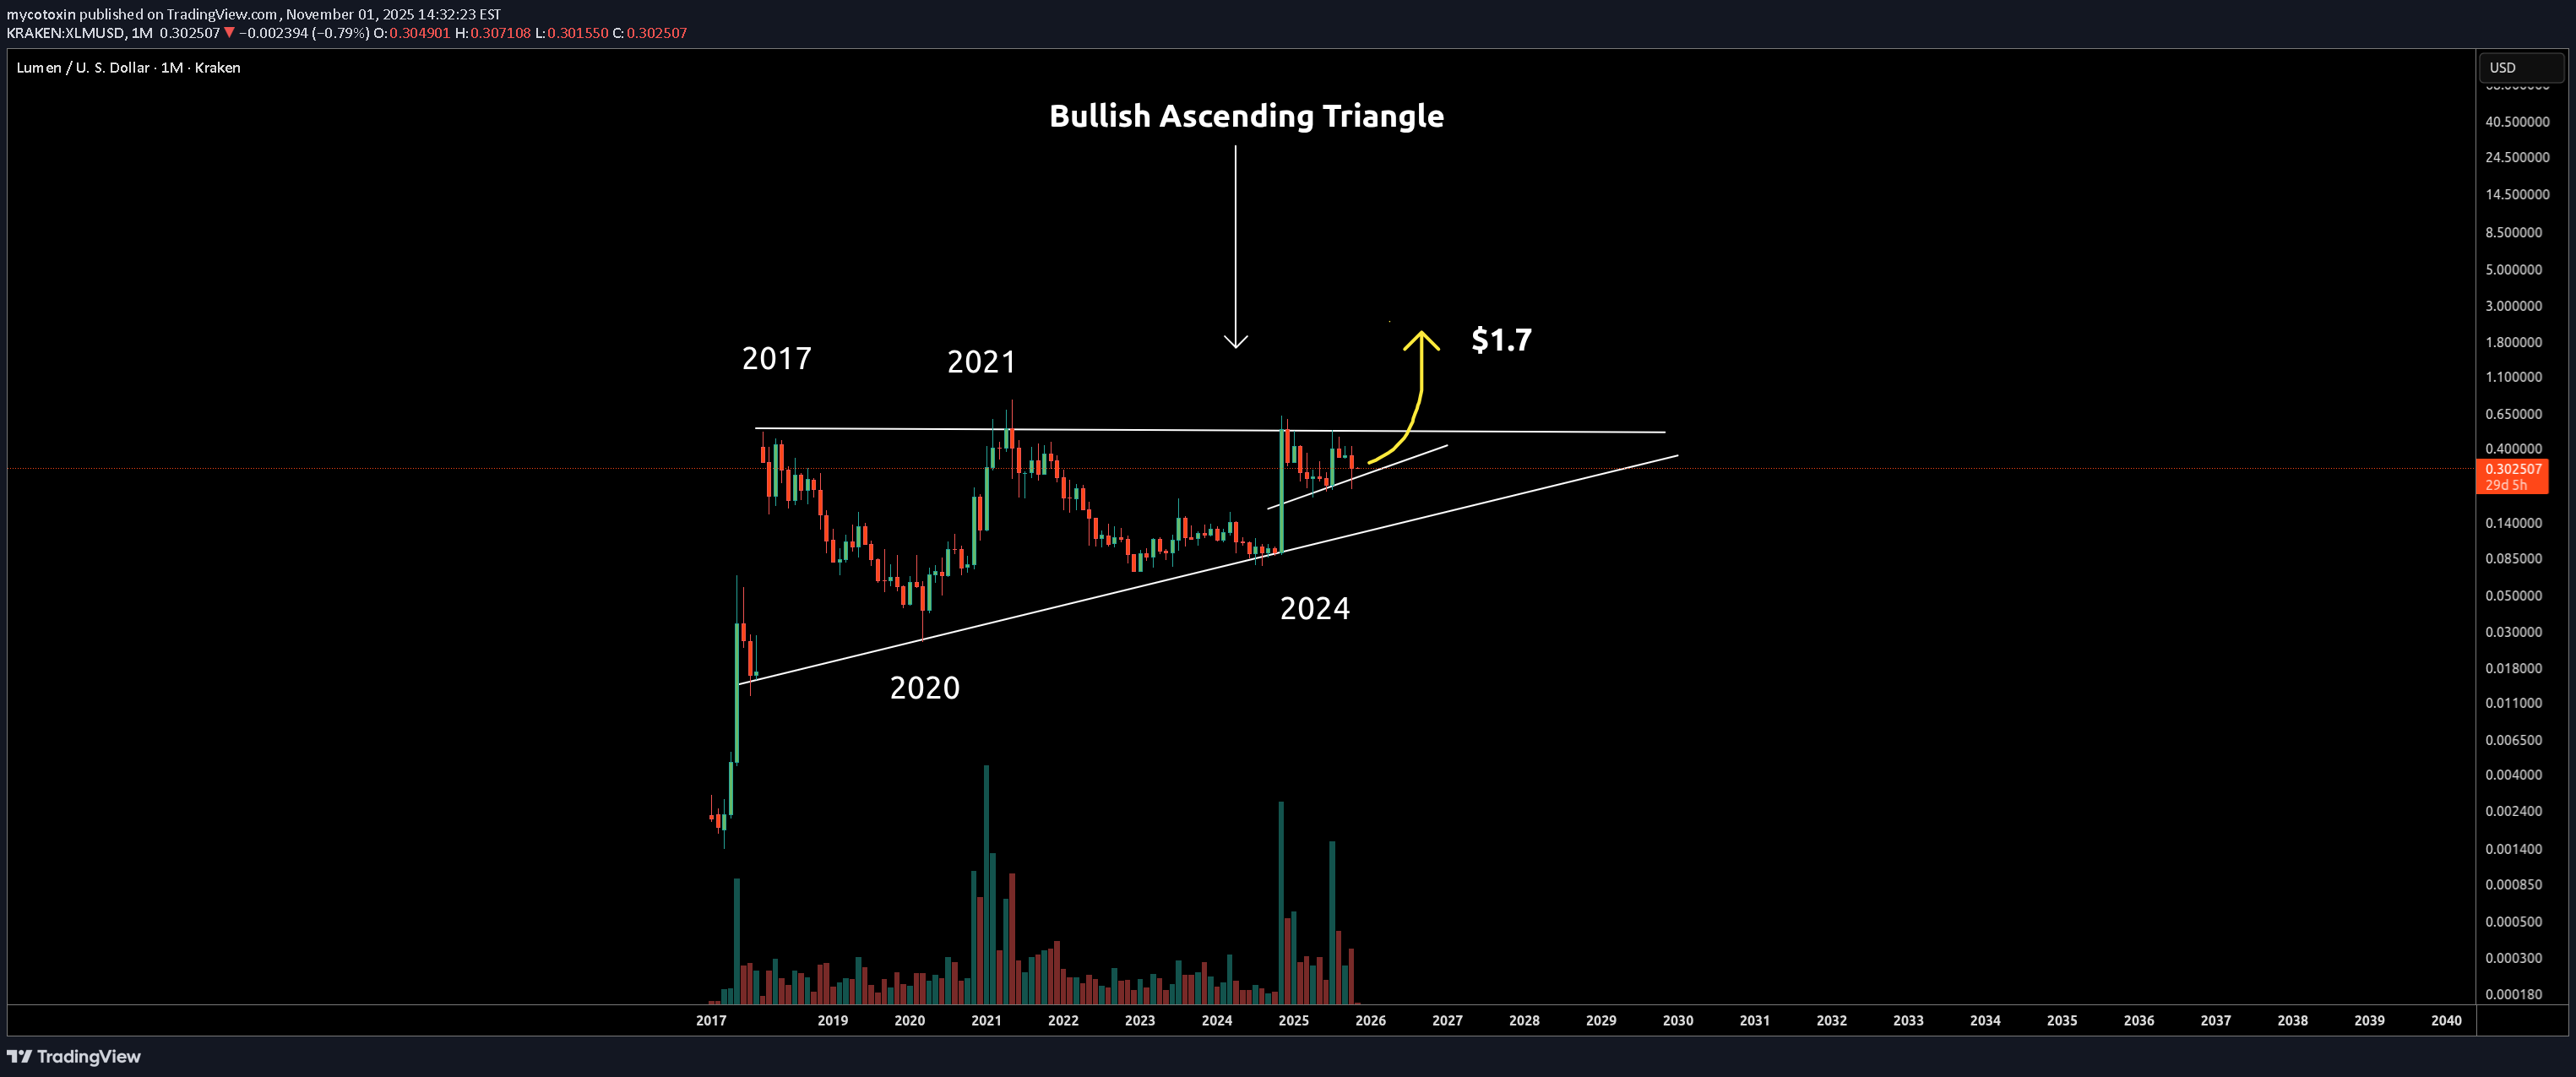
XLM is wrapping up a multi-year accumulation phase (8 years from 2017 to 2025). The bullish ascending triangle pattern shows that strong hands have been steadily accumulating the token over the years. As a reliable OG token with history and proven staying power, I'd expect an initial move to the $1.70 area for XLM to get things rolling, then push higher from there. This is a clean setup and the measured move suggests significant upside ahead. Don't sleep on this one.
mycotoxin
تغییر رژیم ZCASH: سیگنال انفجاری صعودی با شمع مارابوزوی تاریخی!
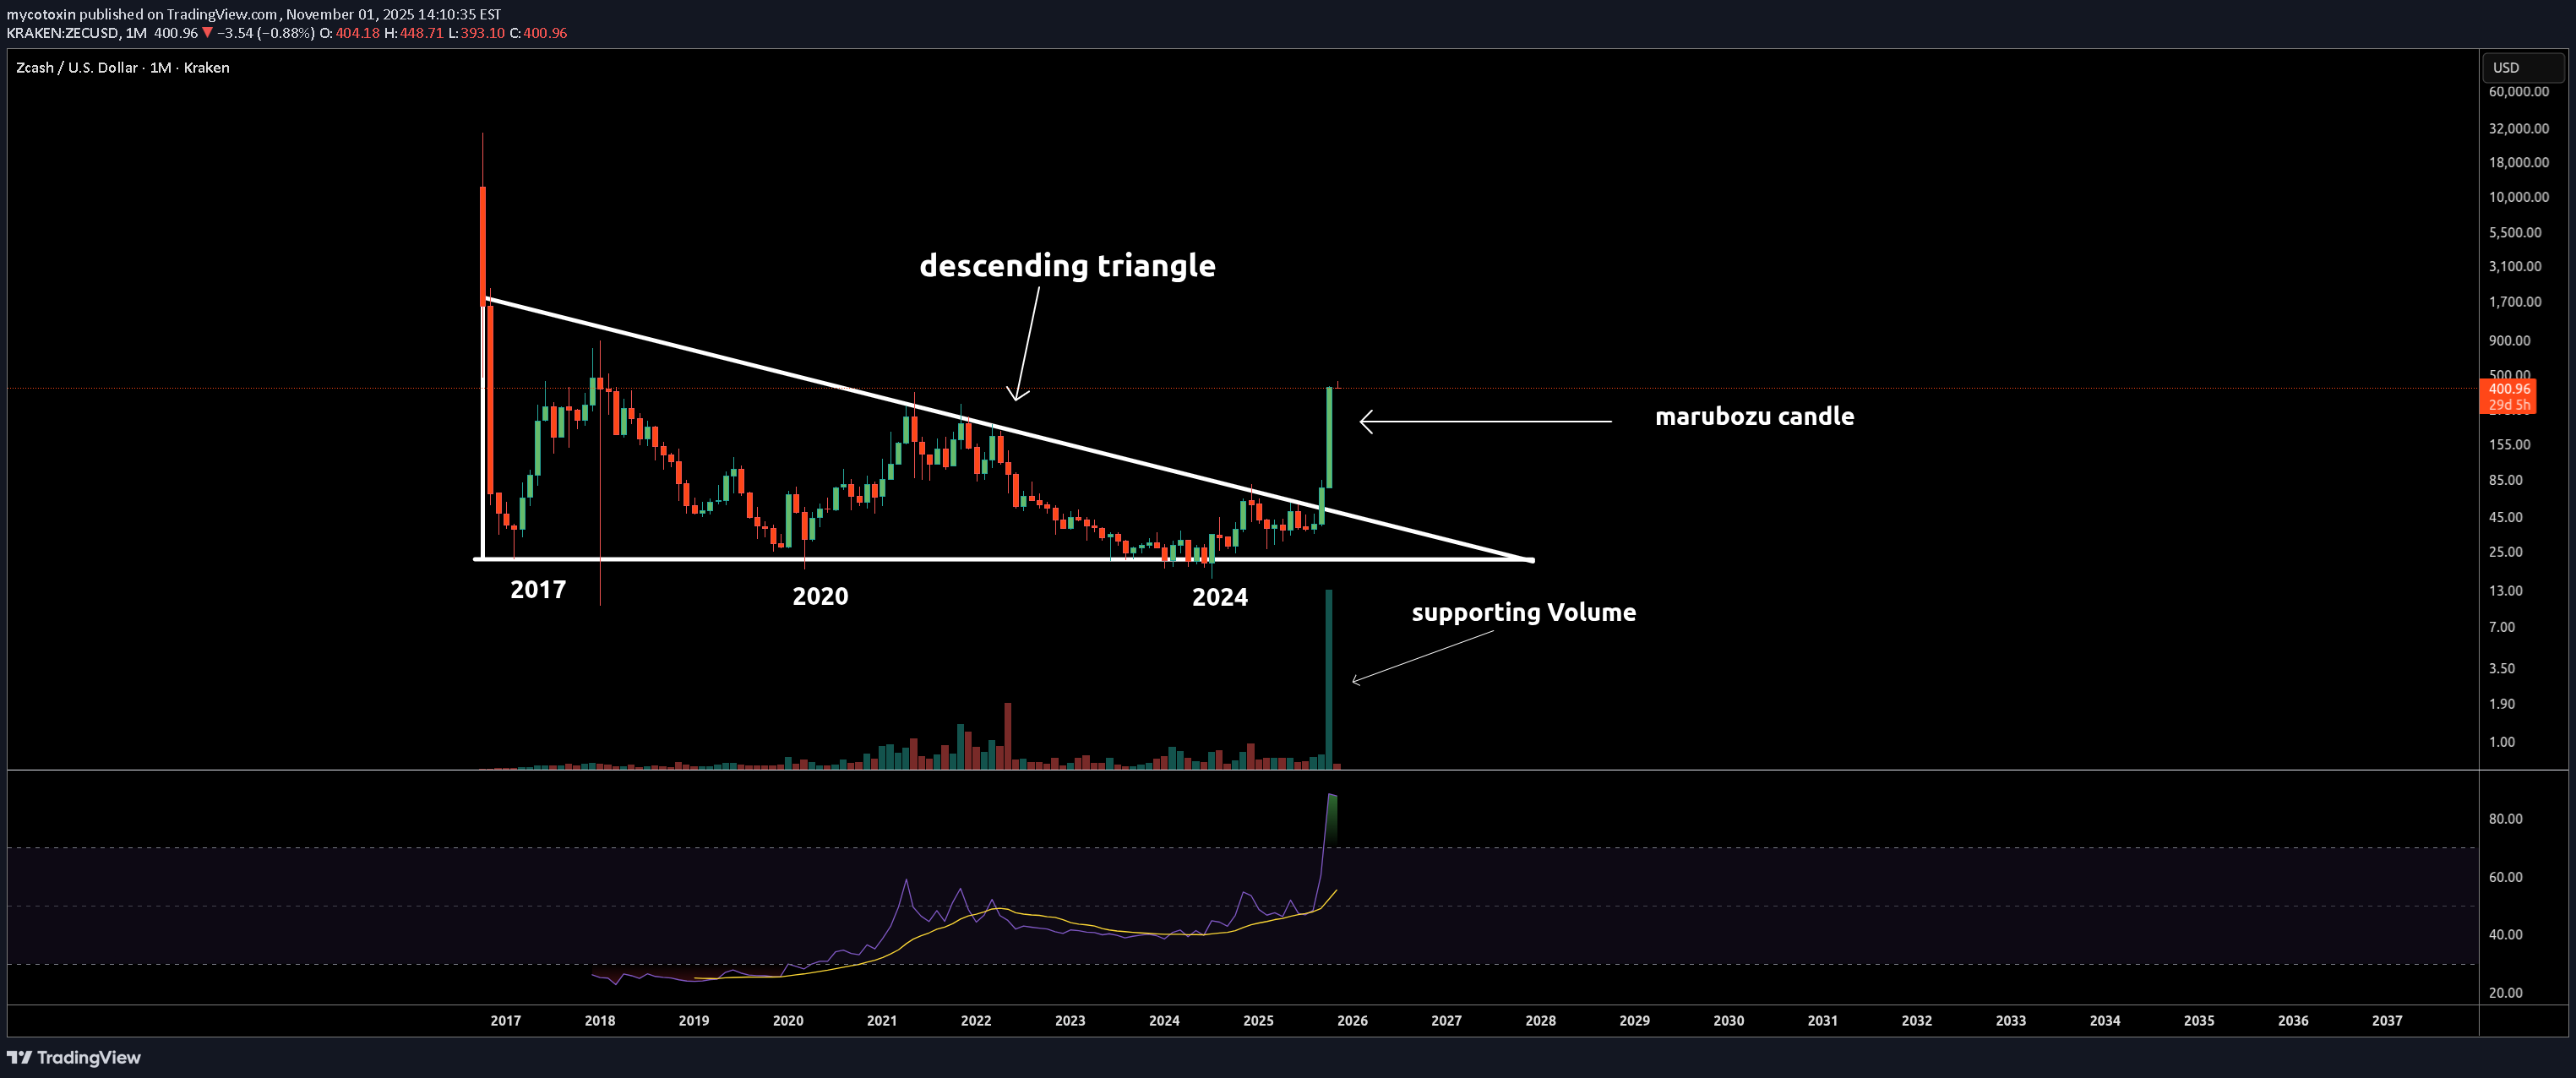
A marubozu candle is a strong bullish candle with heavy volume and no wicks on either end. The lack of wicks means buyers were completely in control—pushing price up from open to close with zero hesitation. What's extremely rare here is that marubozu candles usually show up on daily or hourly charts, not monthly charts. However on the ZCASH chart, we're seeing a full marubozu on the monthly timeframe with massive supporting volume. This isn't just a trend change—it's a regime change. Whales have been accumulating for 8 years and have finally signaled they're ready to push price to higher pastures. I expect price to hit resistance around $460, consolidate there for a bit, then push toward the $1,000-$1,500 area This is a textbook breakout after years of accumulation. The monthly marubozu with volume tells you everything you need to know—smart money is done waiting and this could be the start of something bigLooking at the ZECBTC chart there is no resistance till price reaches .00678 BTC hence price can also hit around the $700 mark before a pullback is seenReviewing the ZECBTC chart. Price has currently stopped at the top of the main resistance around 700. To be honest, I just don't see ZEC blasting through this area as folks trapped since 2017 will be exiting, along with institutions likely taking some profit. I'd guess a consolidation dip to the 400-380 area is in the works before price recovers. My expectation is price consolidates for a few weeks/months between 750-380, then the ZEC run continues in 2026 towards the 10k zone. Just my thoughts—not financial advice.
mycotoxin
DASH: بازگشت از خواب زمستانی! آیا انفجار بزرگ قیمتی در راه است؟
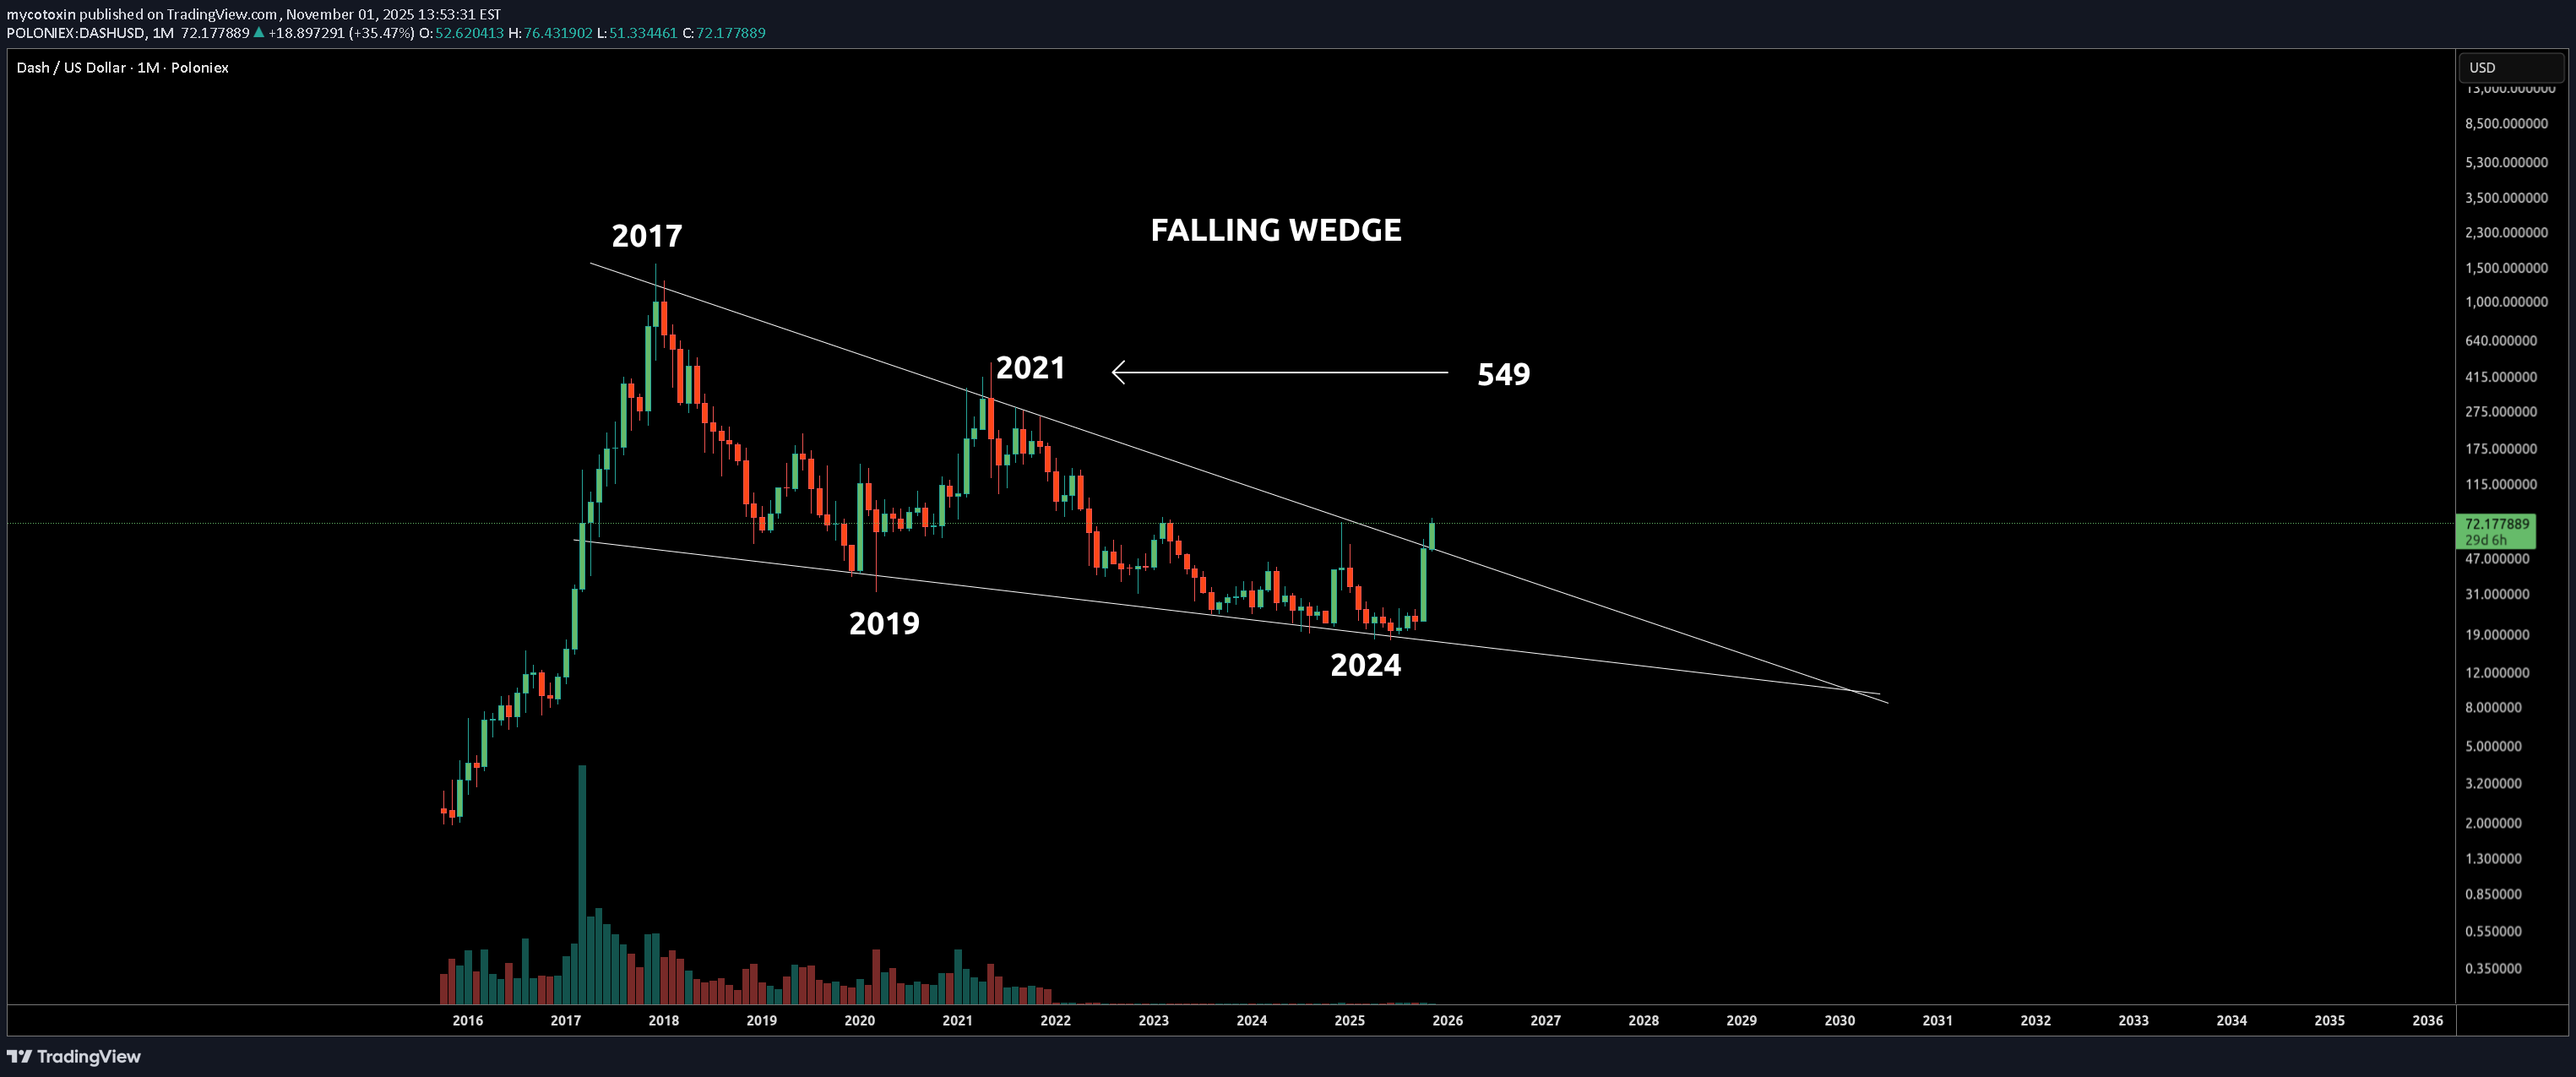
DASH appears to be wrapping up a 8 year accumulation evidenced by the falling wedge pattern. One thing that stuck me as interesting in 2017 was at its peak I remember reading that DASH holders earned 120K a year by using 1000 DASH tokens to run a masternode. Judging by the falling wedge pattern it appears some whales took notice of this fact and have suppressed the DASH price to Accumulate over 8 years. Similar to ZCASH as DASH exits its accumulation range ill expect the price to break out strongly with an initial price target in the 549 range,
mycotoxin
BTC 150k followed by target to 260-280k .
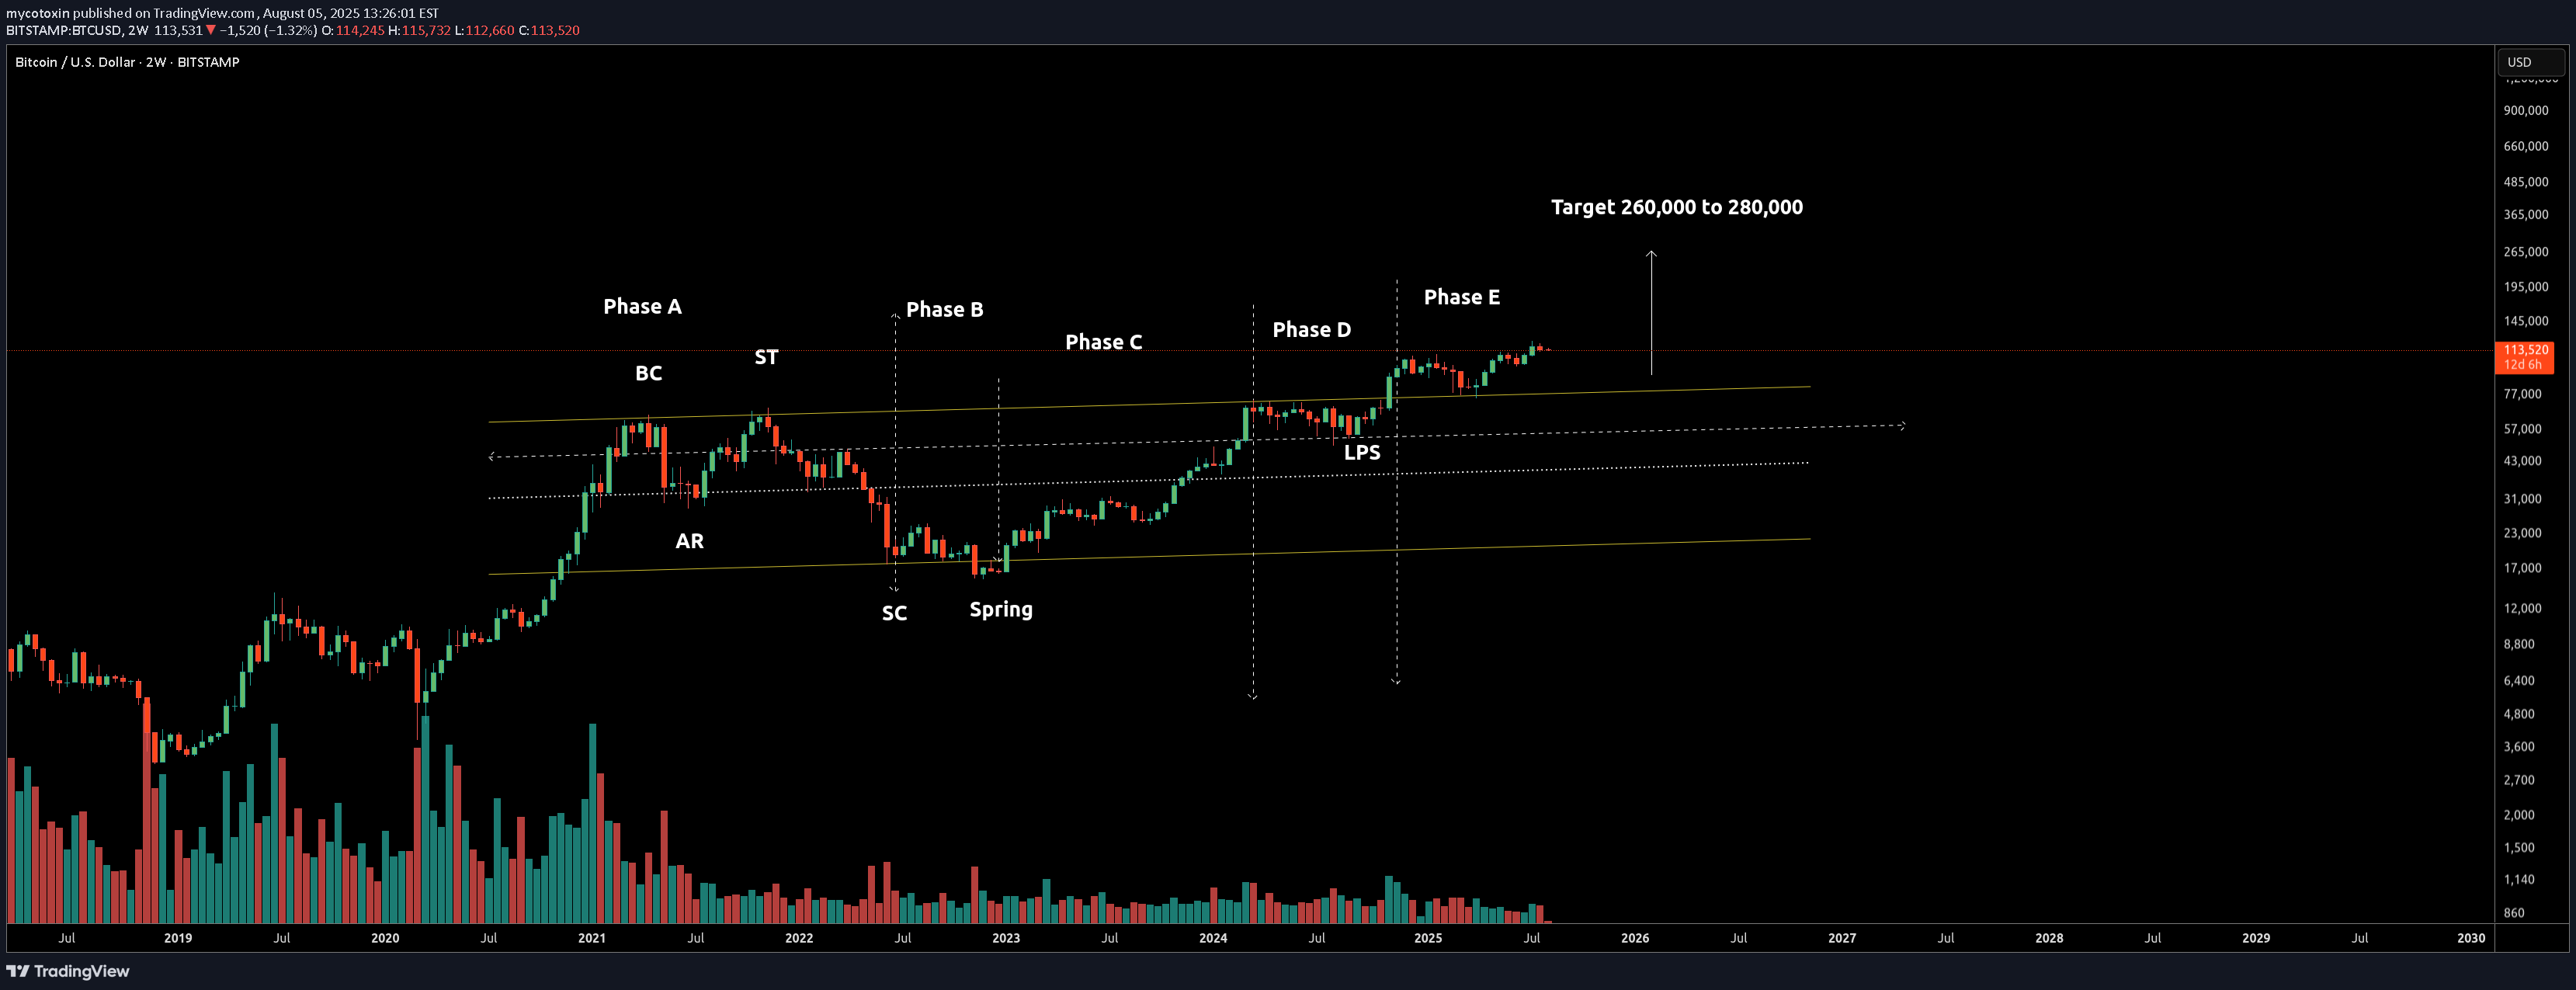
if the wyckoff methodology is applied then this is a re-accumulation phase with a first target in the 150k area followed by a main target in the 260k to 280K zone. The wyckoff phases identified on the chart are as follows Phase A: BC (Buying Climax) AR (Automatic Reaction) ST (Secondary Test) Phase B: Characterized by volatility and testing within the range. Phase C: SC (Selling Climax) Spring – a final shakeout below support to mislead traders before upward movement. Phase D: Clear higher highs and higher lows; sign of strength (SOS) and last point of support (LPS) observed. Phase E : Price has broken above the re-accumulation range and rested the trading range which is now acting as support. As the assets price exits the trading range id expect a strong move to around the 150K area followed by a secondary move to the 260-280k target.if the wyckoff Point and Figure (PnF) analysis is applied we can use it to calculate the first target stop after a breakout. Using the PnF method the first target should be between 133k and 180k and this will also be the take profit area. P&F Count Estimation using the following: structure: ============================================== a) Major low (Spring/Phase C): Around $15,500-16,000 b) Potential breakout level: Around $73,000-75,000 (previous highs) c) Current resistance to clear: Around $70,000-75,000 range d)From the width of the accumulation pattern there are 12-15 columns of consolidation activity. Conservative P&F Target -------------------------------------------- using the vertical count method: Base = ~$60,000 range width Breakout point = ~$73,000 Conservative target = $73,000 + $60,000 = ~$133,000 Aggressive P&F Target: -------------------------------------- Using a wider count or horizontal count method: Extended range = ~$90,000-100,000 Breakout point = ~$73,000 Aggressive target = $73,000 + $100,000 = ~$173,000-180,000
Disclaimer
Any content and materials included in Sahmeto's website and official communication channels are a compilation of personal opinions and analyses and are not binding. They do not constitute any recommendation for buying, selling, entering or exiting the stock market and cryptocurrency market. Also, all news and analyses included in the website and channels are merely republished information from official and unofficial domestic and foreign sources, and it is obvious that users of the said content are responsible for following up and ensuring the authenticity and accuracy of the materials. Therefore, while disclaiming responsibility, it is declared that the responsibility for any decision-making, action, and potential profit and loss in the capital market and cryptocurrency market lies with the trader.