Technical analysis by mycotoxin about Symbol ZEC on 11/24/2025

mycotoxin
آیا زِدکش (ZEC) آماده جهش به ۱۲۰۰ دلار است؟ راز شکست مقاومت ۷۶۰ دلاری!
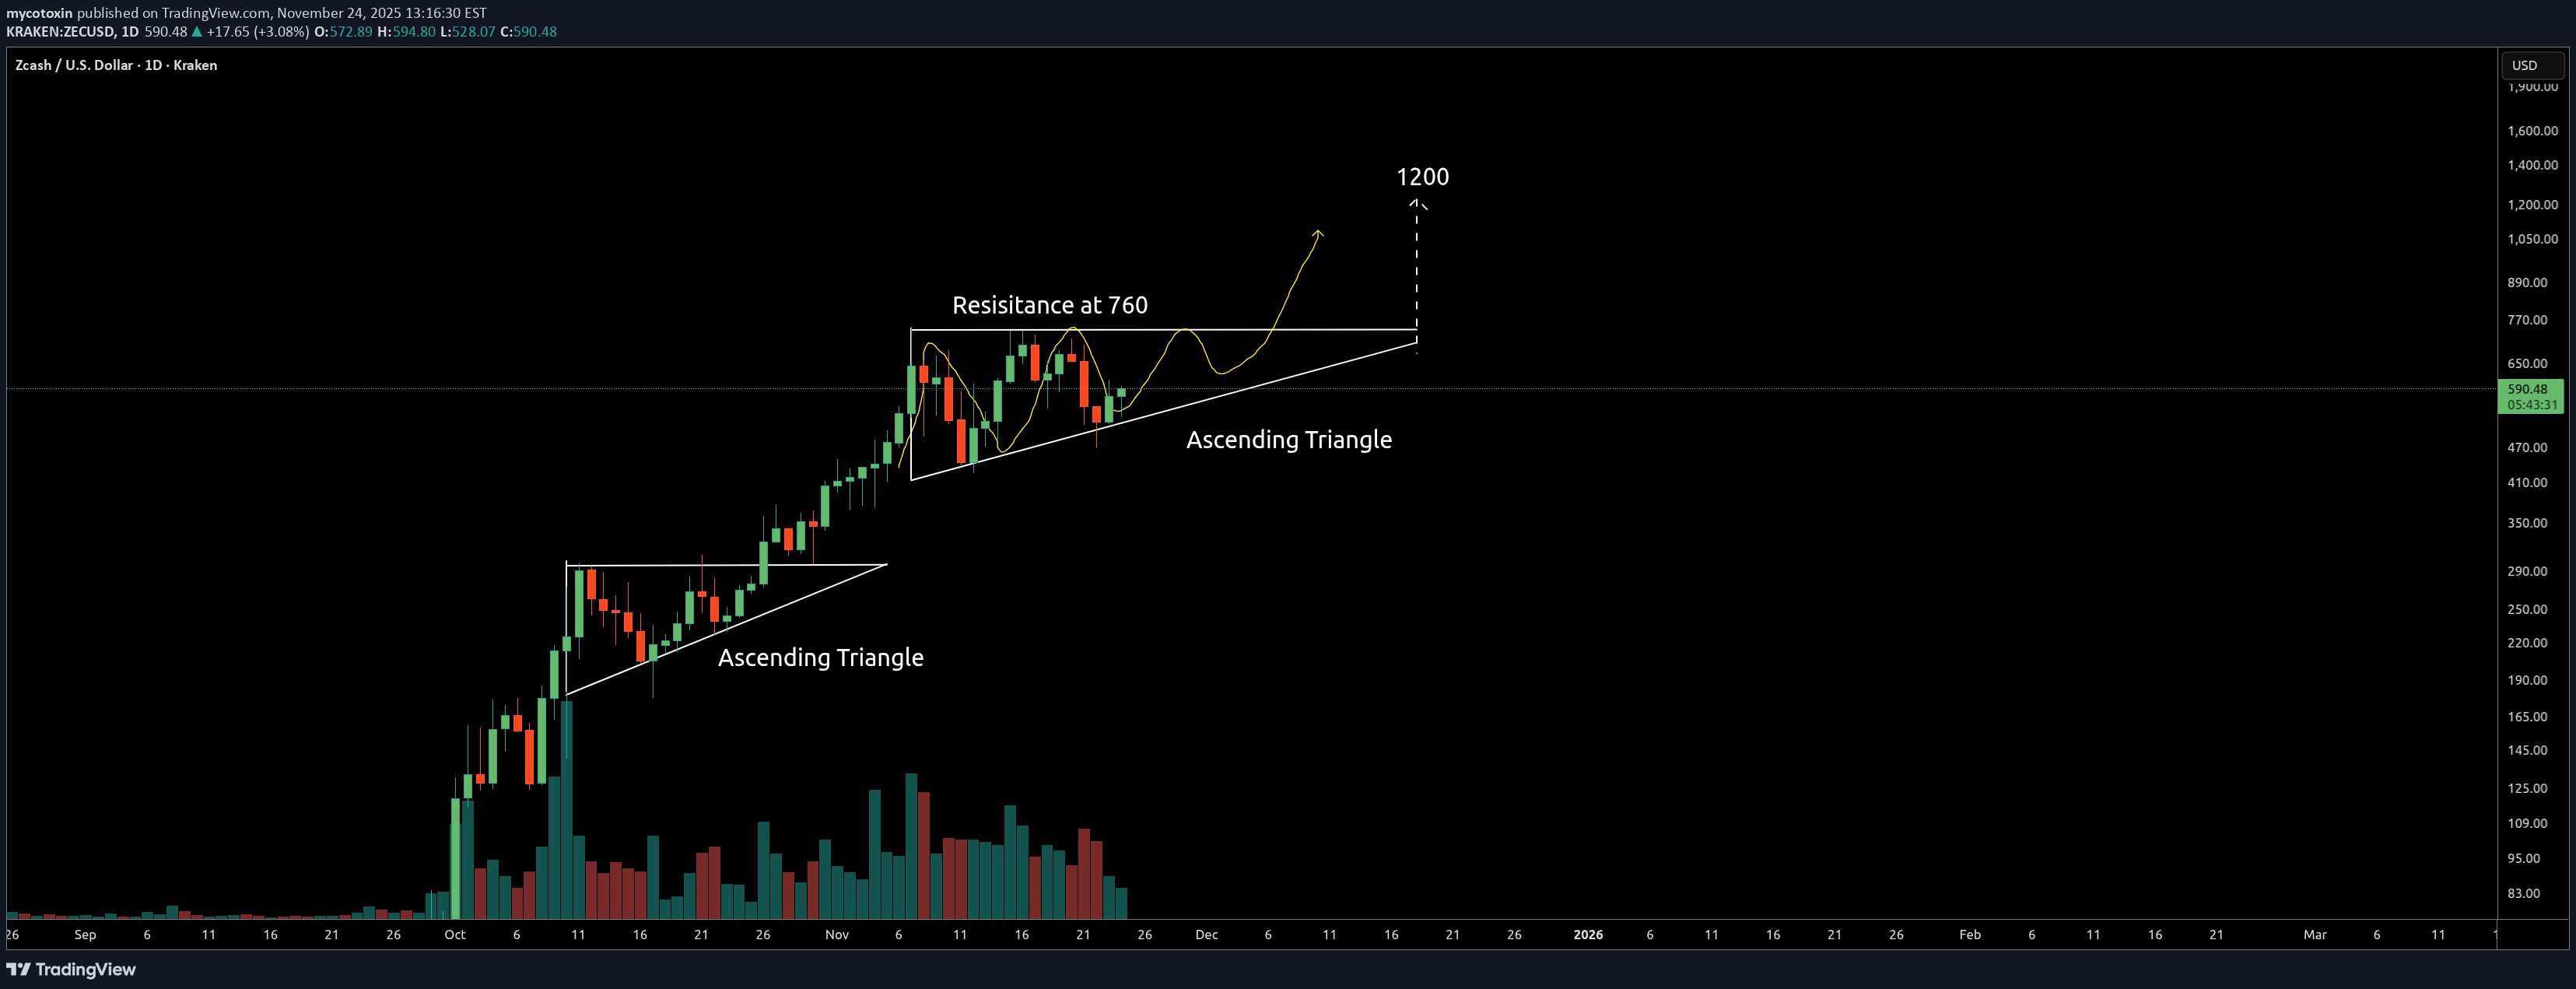
From the chart, Zcash appears to be forming a bullish ascending triangle on the daily time frame. A bullish ascending triangle typically forms after an uptrend and is characterized by a sloping trend-line at the bottom, formed by two or more consecutive higher lows. The top of the pattern is formed by drawing a horizontal line connecting two or more highs that create a resistance level. In this case, resistance sits at the $760 area. For the ascending triangle to be successfully confirmed, ZEC will need to remain in the pattern and close above the $760 resistance on the daily timeframe. A clean break above $760 followed by a successful retest could then pave the way for a move toward the $1,200 area. If this breakout completes, I'd expect it to happen around the first week of December. However, if ZEC fails to break above the $760 resistance, I'd expect a move down to support at around the $400 zone. Volume will be critical to watch here - a breakout above $760 should be accompanied by a strong volume spike to confirm buyer conviction. Without volume confirmation, any move above resistance could be a false breakout. As always good luck and this is just my technical observation and not financial advice; hence always DYOR.