
mrarroyo2u
@t_mrarroyo2u

What symbols does the trader recommend buying?
Purchase History
پیام های تریدر
Filter
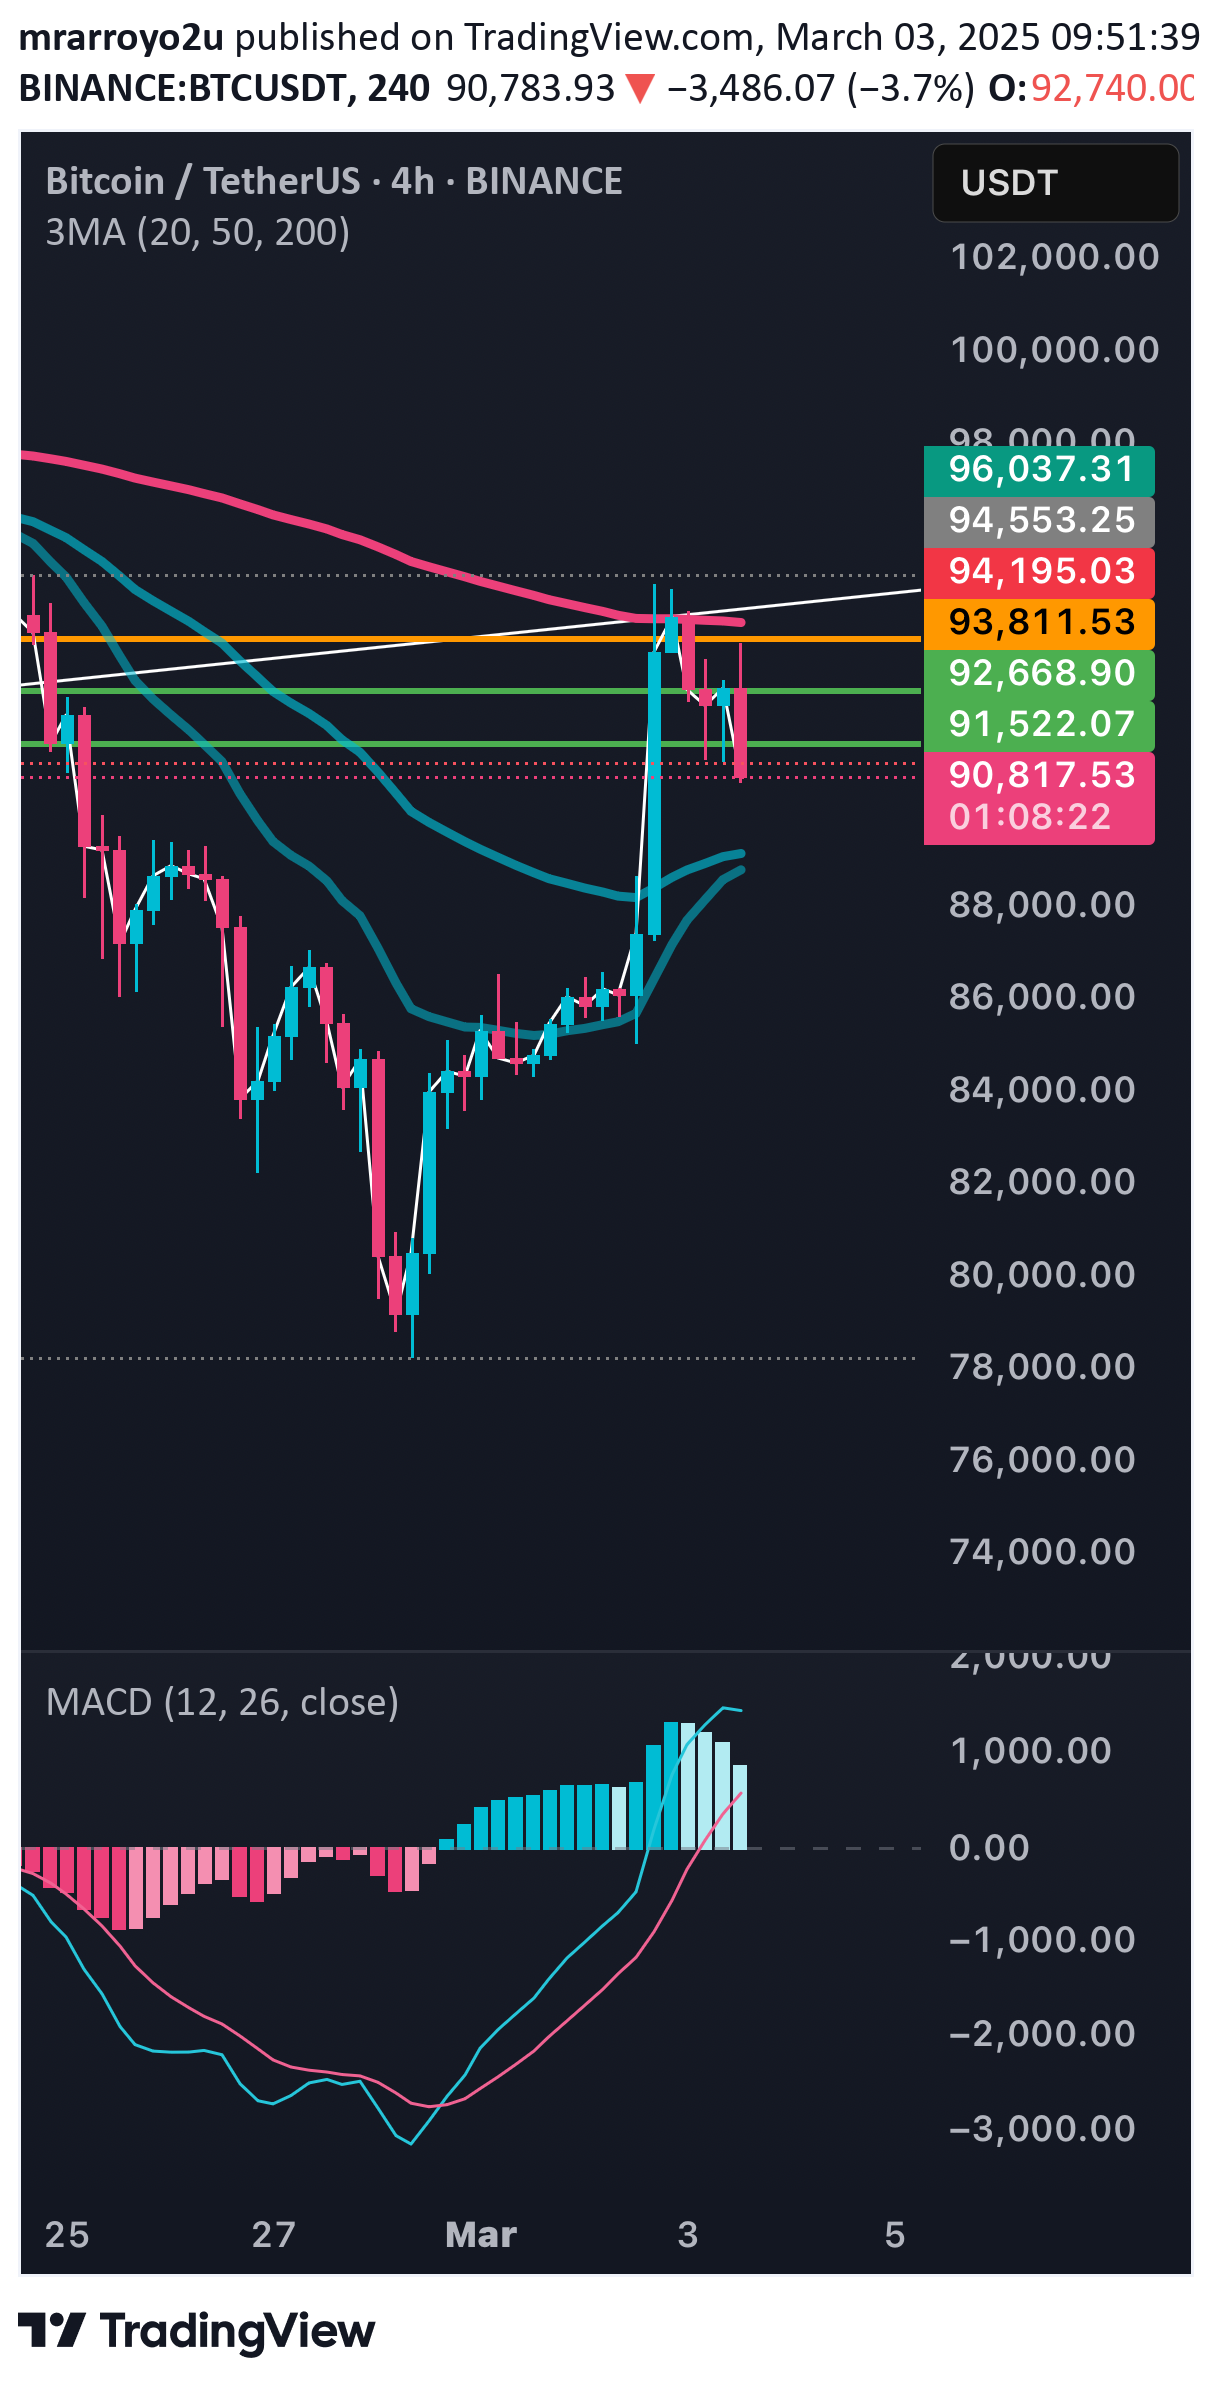
بیت کوین تا کجا ریزش میکند؟ تحلیل دقیق مسیر صعودی به سمت ۱۰۰ هزار دلار
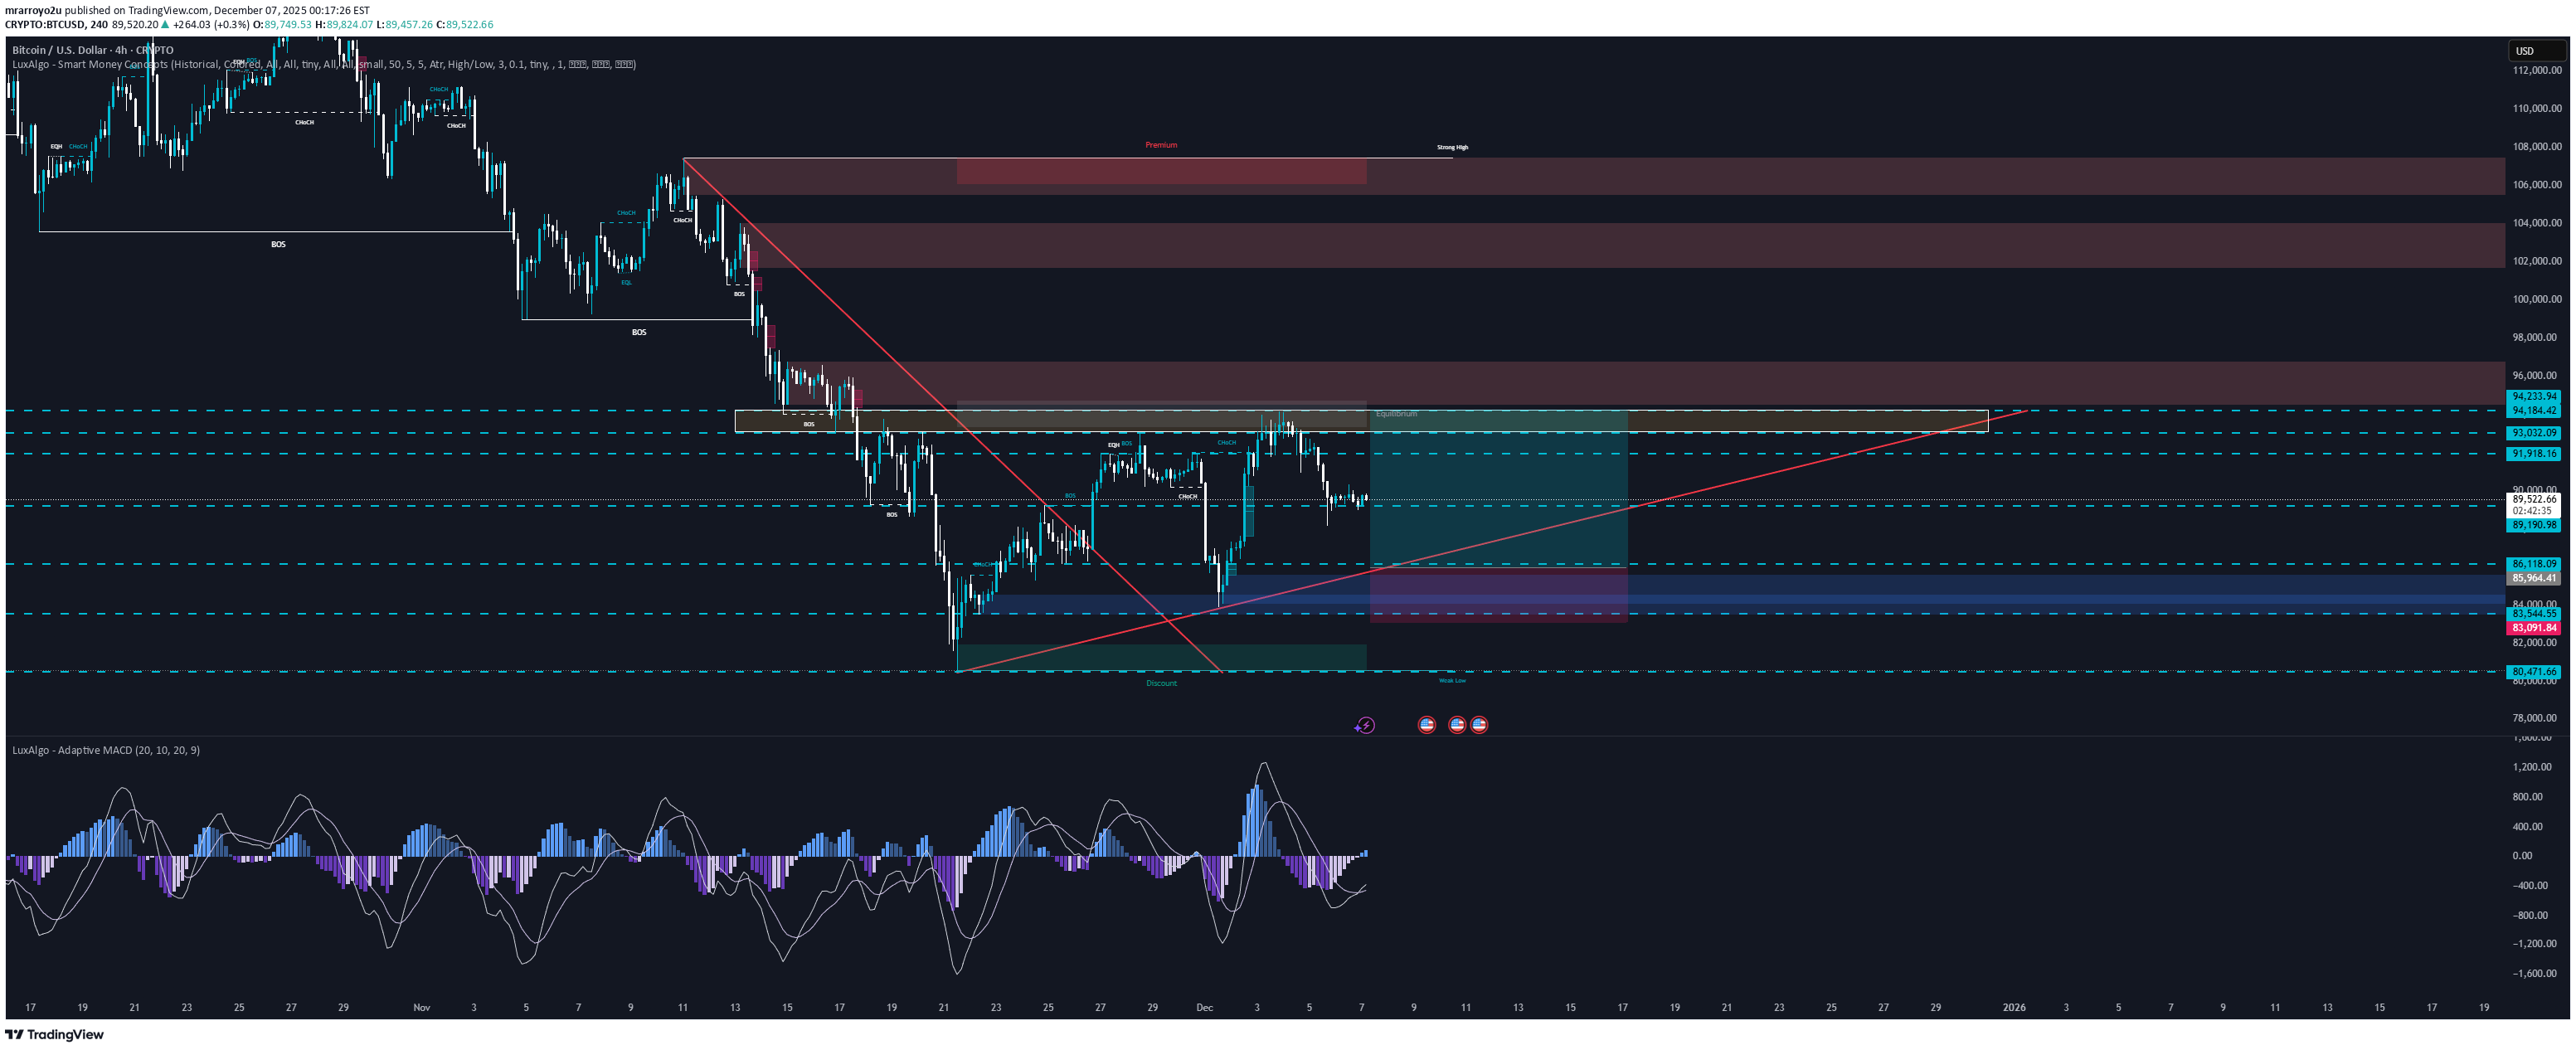
In my view, Bitcoin still has room for one more corrective move, likely into the $84K range before the next major leg upward. This level makes sense for a few reasons: 1. Market Structure & Healthy Retracements Even in strong bull markets, BTC tends to revisit key liquidity zones. The mid-80K range lines up with previous consolidation, unfilled liquidity pockets, and a natural retracement level from the last impulse move. A dip to this region would allow big players to reload without breaking overall bullish structure. 2. Sentiment Control, Not Sentiment Collapse A move back to the $70Ks, in my opinion, would generate too much panic. That type of drop during a euphoric phase could flip sentiment from “healthy correction” to “full-blown disbelief,” which is not typical behavior right before a new all-time-high push. The market often moves in ways that create doubt—but not full capitulation—before major breakouts. 3. Whales & Smart Money Favor Controlled Pullbacks Institutions and long-term holders tend to accumulate during strategic dips, not emotional crashes. An $84K revisit shakes out over-leveraged longs and late FOMO buyers, but it doesn’t destroy market confidence. It’s the perfect “reset point” before a push to psychological milestones like $100K. 4. The 100K Psychological Magnet Once BTC re-tests and holds a strong support zone like mid-$80Ks, the path toward $100K becomes clear: sentiment stabilizes buyers return leverage resets resistance thins out At that point, the market narrative naturally shifts to: “Next stop, six figures.”
اولین ETF ارز دیجیتال MOG در آمریکا: ورود قانونی به دنیای میمکوینها!
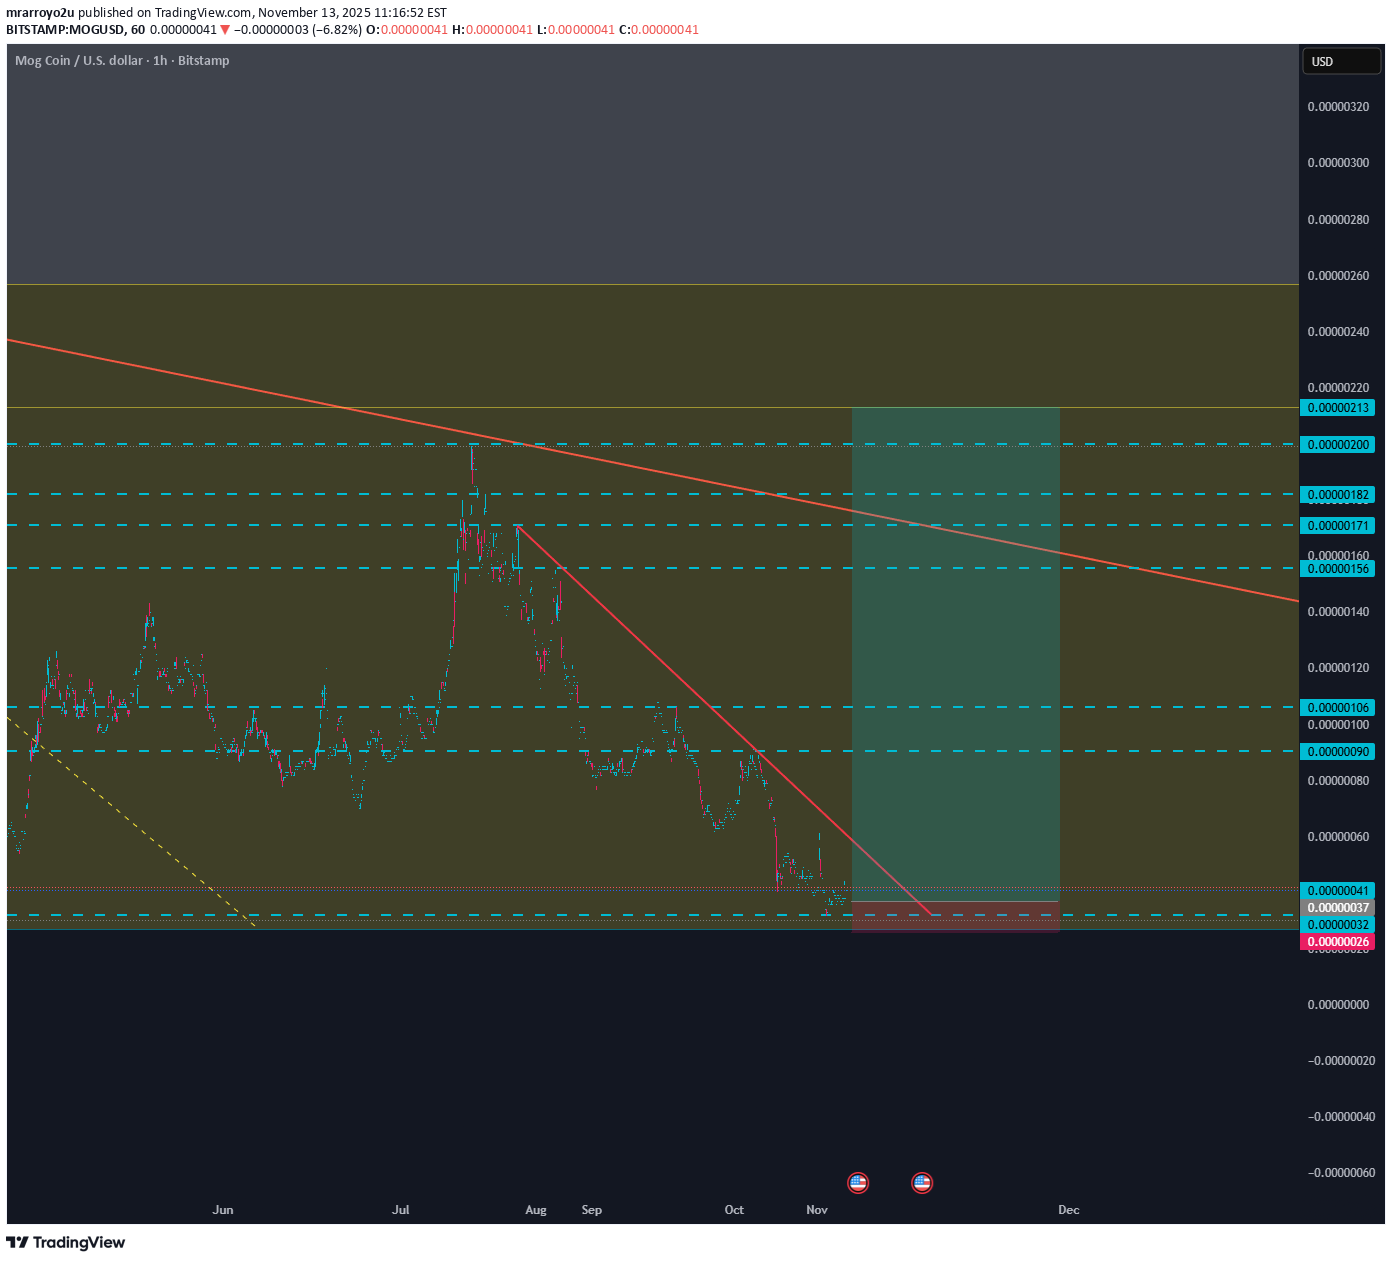
Canary Capital has advanced its crypto product lineup with the launch of the first-ever MOG ETF in the United States. The firm filed with the Securities and Exchange Commission on November 12 to introduce the new exchange-traded product. The MOG ETF aims to give traders direct access to MOG Coin’s spot price through a regulated market structure. Inside the Canary MOG ETF Filing The MOG ETF will operate as a trust and will hold MOG tokens in secure custody rather than using futures contracts. It seeks to mirror the spot market price of MOG Coin while deducting management expenses and operational costs. This structure allows traditional brokerage account holders to gain regulated access to the memecoin without using unregulated exchanges. The filing specifies that the MOG ETF will issue and redeem shares in large blocks known as Baskets. Each Basket represents a specific amount of MOG, either in cash or token form, ensuring consistent valuation. Authorized Participants will handle the creation and redemption of these Baskets through designated custodians. The Trust’s shares will trade on a registered exchange once approved, though the ticker symbol remains undisclosed. CSC Delaware Trust Company serves as trustee, while U.S. Bancorp Fund Services operates as transfer agent. Additionally, U.S. Bank N.A. will act as the cash custodian, and another appointed custodian will safeguard all MOG assets.
The Miami Wave is Coming For BTC!
I feel like we could take one last riptide to the down side with BTC before we make a tsunami wave and ride the swell to the $120K! How you all feeling about the news on Crypto and the Law passed?
Bearish Riptide…
Utilizing my strategy called Miami Beach from Yo_mrarroyoWe are still under the 200 EMA And even with the Beautiful 4H candle from yesterday, I do think we’re headed back down For the moment. I know Trump has a lot going on right now with the Crypto space, But I just think that we’re in a time where investing is not about that he said she said, but waiting and doing your own research. So do I think people are more skeptical now over being in for a quick bag?! Yes, I do. So we can get pulled By the bearish riptide Or wait for the swell And ride the Bullish pipeline!
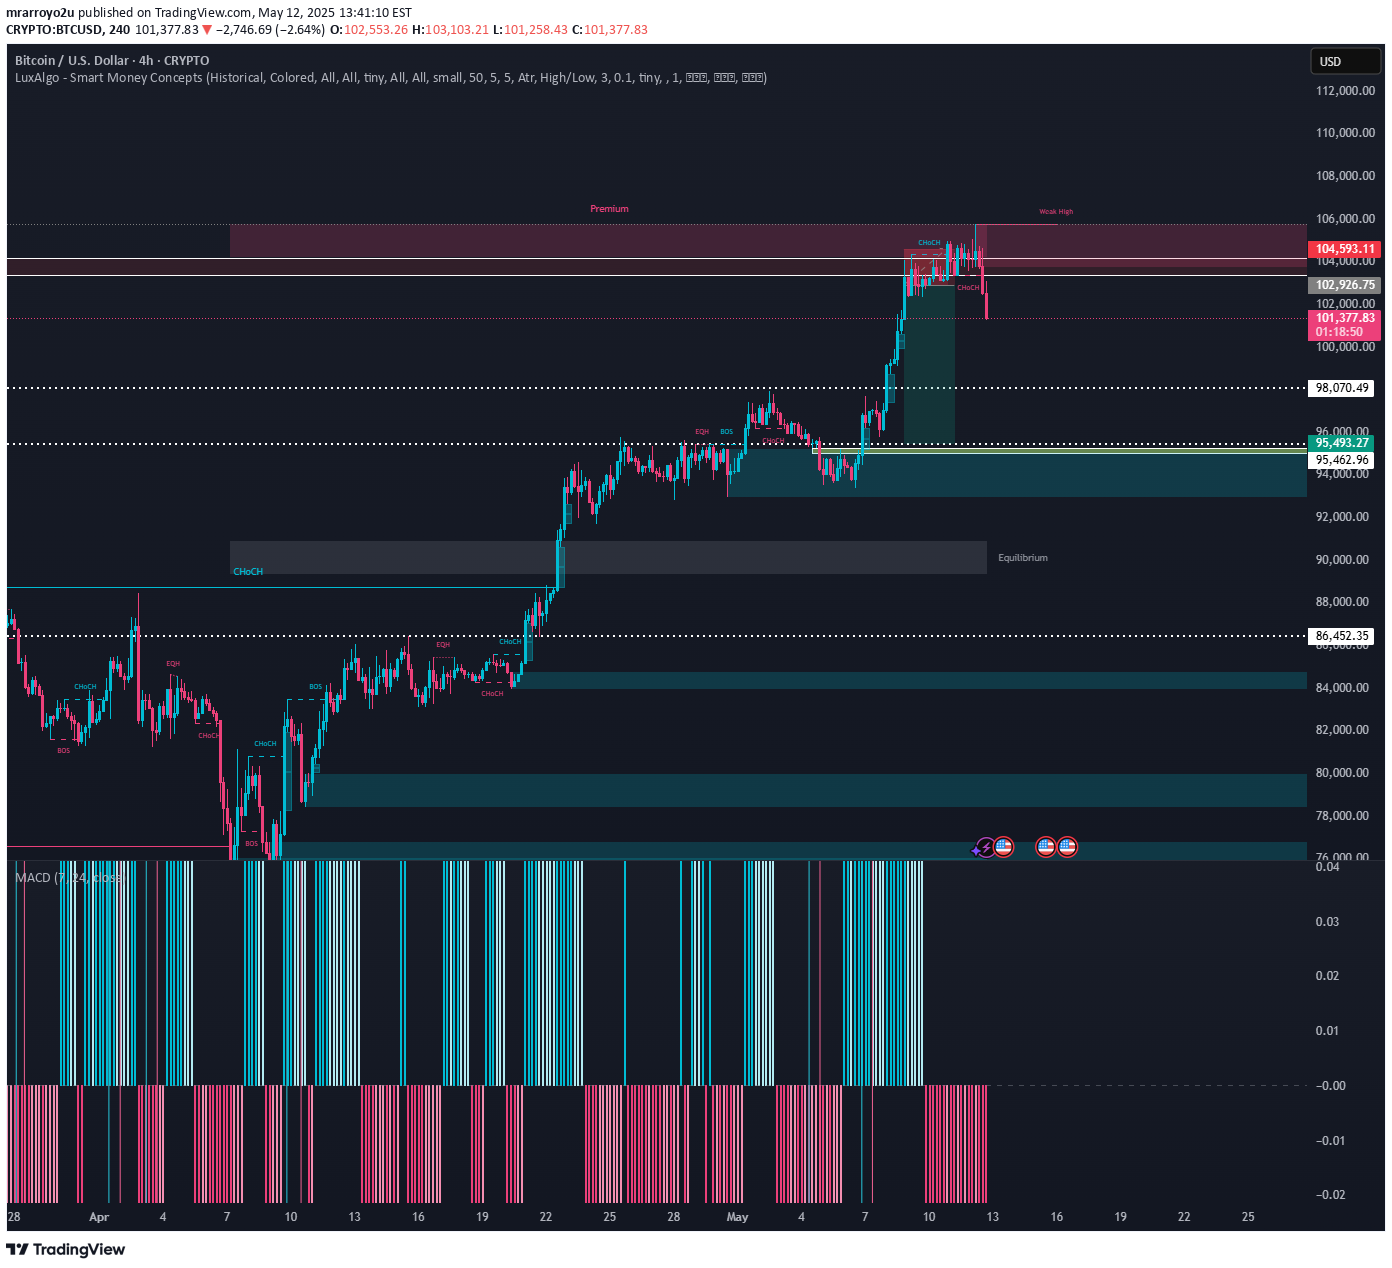
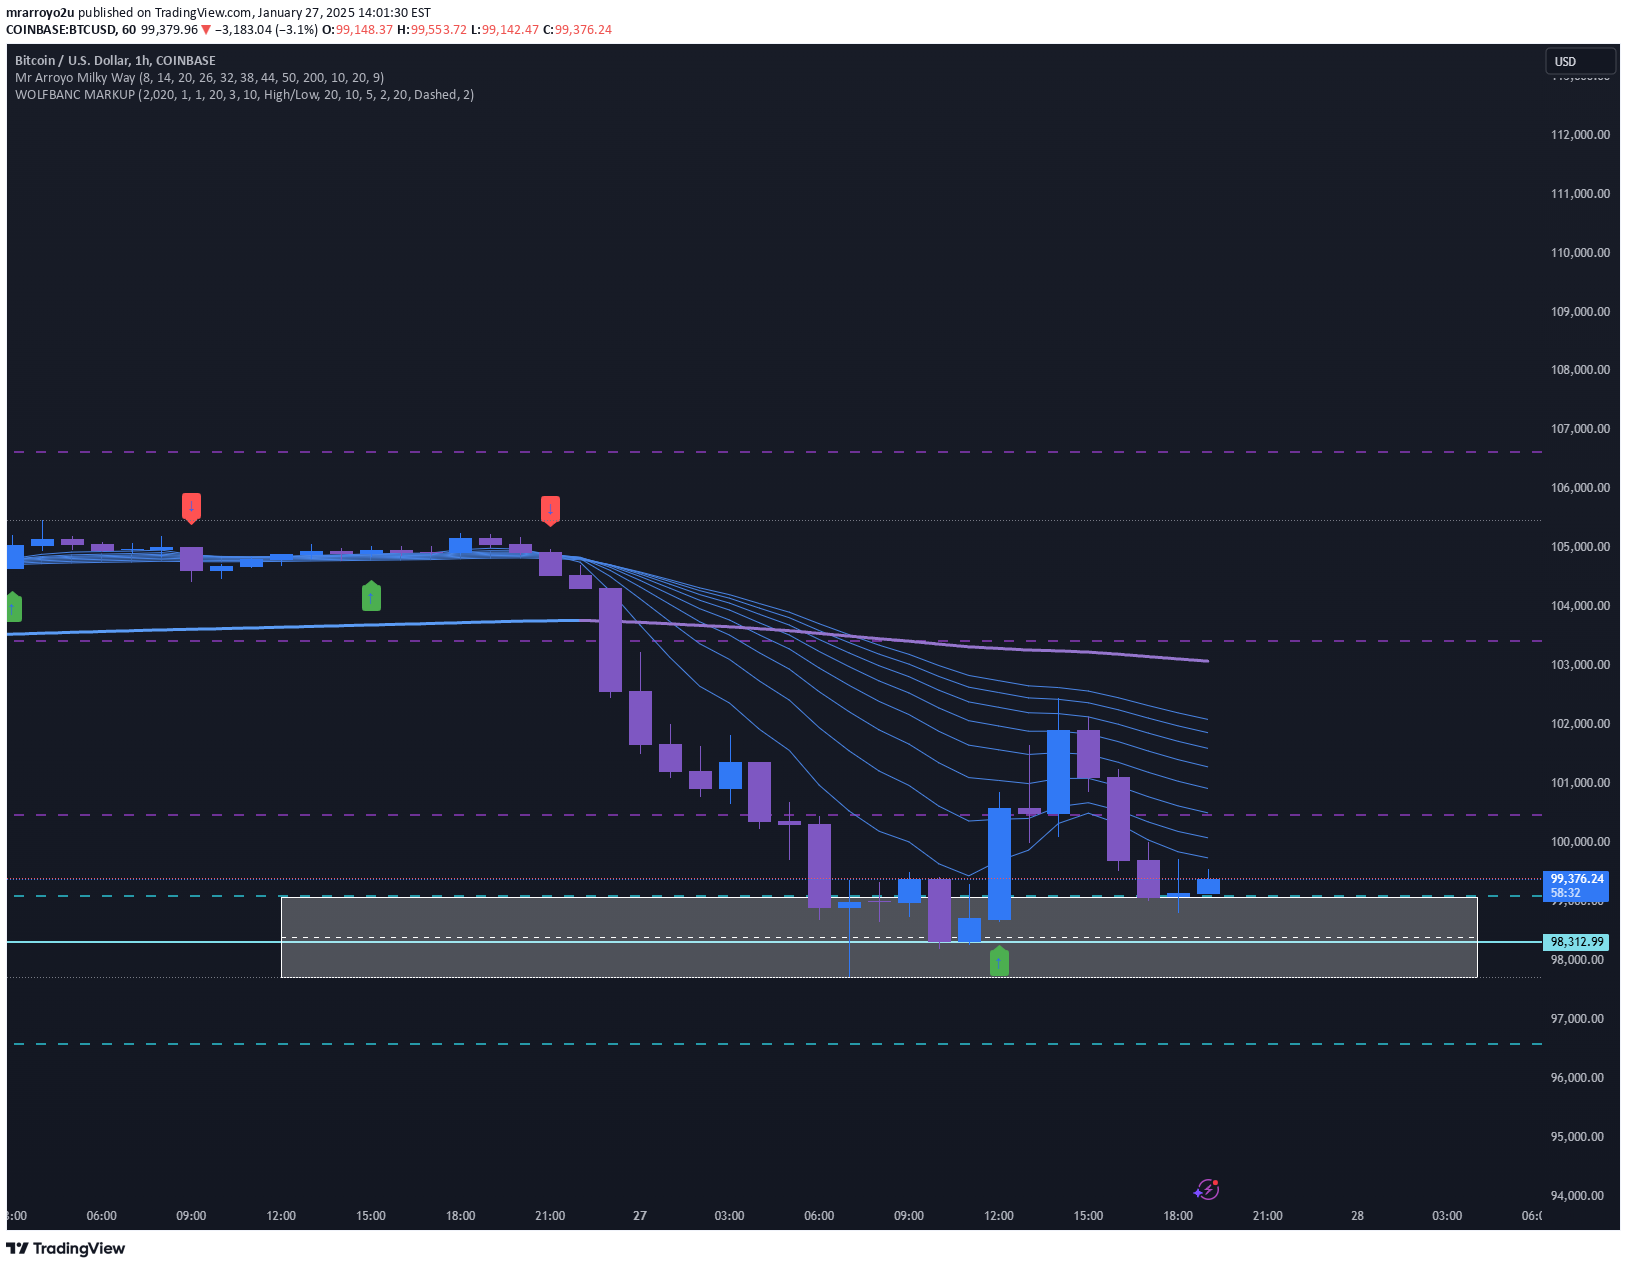
This Pullback Feels Like…
So I’ve been watching bitcoin on this crazy move that happened today we literally went up to about 100 K and instantly dropped back down to 95. There is a lot going on in the market, but it’s still fairly strong and the daily is above the EMA. What y’all think about this set up? Could it happen soon?
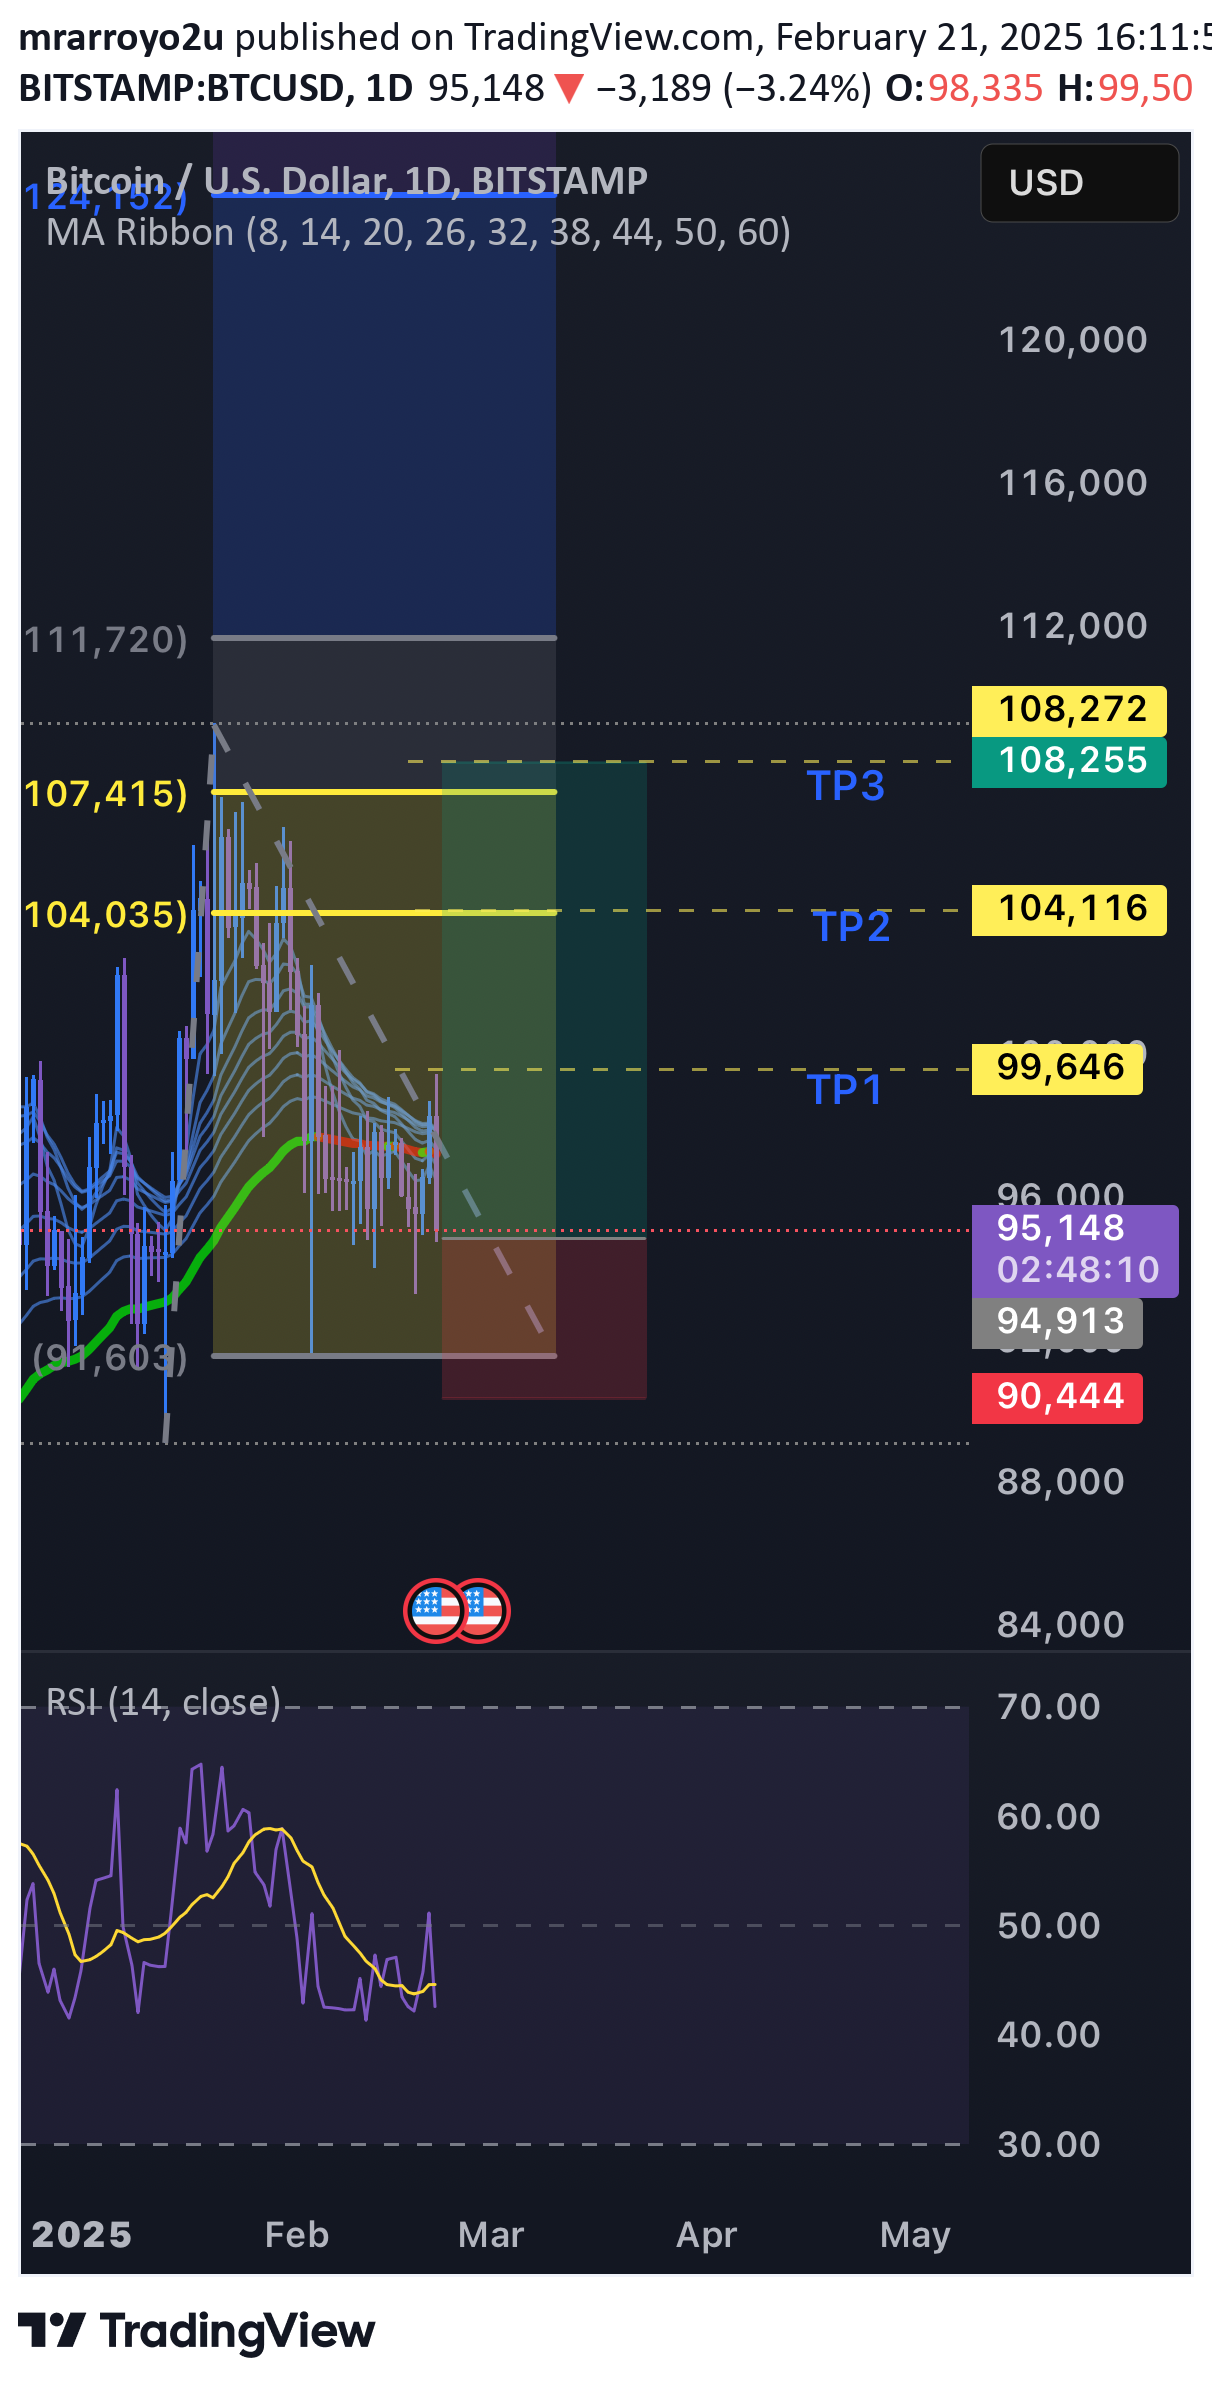
The recent market dump appears to be reaching a potential bottom, as evidenced by key technical signals and oversold conditions across multiple timeframes. Current price action suggests a strong possibility of a reversal, with $106,000 as a viable target in the coming weeks or months.Key Points Supporting the Reversal:Oversold Indicators: RSI and stochastic oscillators are showing extreme oversold levels, indicating exhaustion of the selling pressure.Volume Analysis: A noticeable increase in buying volume at this level suggests smart money may be accumulating positions.Fibonacci Retracement: The price has retraced to a key support level within the 61.8%-78.6% Fibonacci zone, historically a reversal area in bullish scenarios.Trendline Support: The market is respecting a long-term ascending trendline, signaling a strong base for the next leg up.Bullish Divergence: Momentum indicators like MACD are flashing bullish divergence, suggesting a potential shift in trend.Trade Setup:If this level holds, we could see a sharp bounce and eventual breakout toward $106,000. Watch for confirmation with a daily close above key resistance levels, and monitor macroeconomic factors for added confidence. Stop-loss placement below the recent low is recommended to manage risk effectively.This setup requires patience and confirmation, but the risk-to-reward ratio appears highly favorable. Always trade with caution and ensure proper risk management.
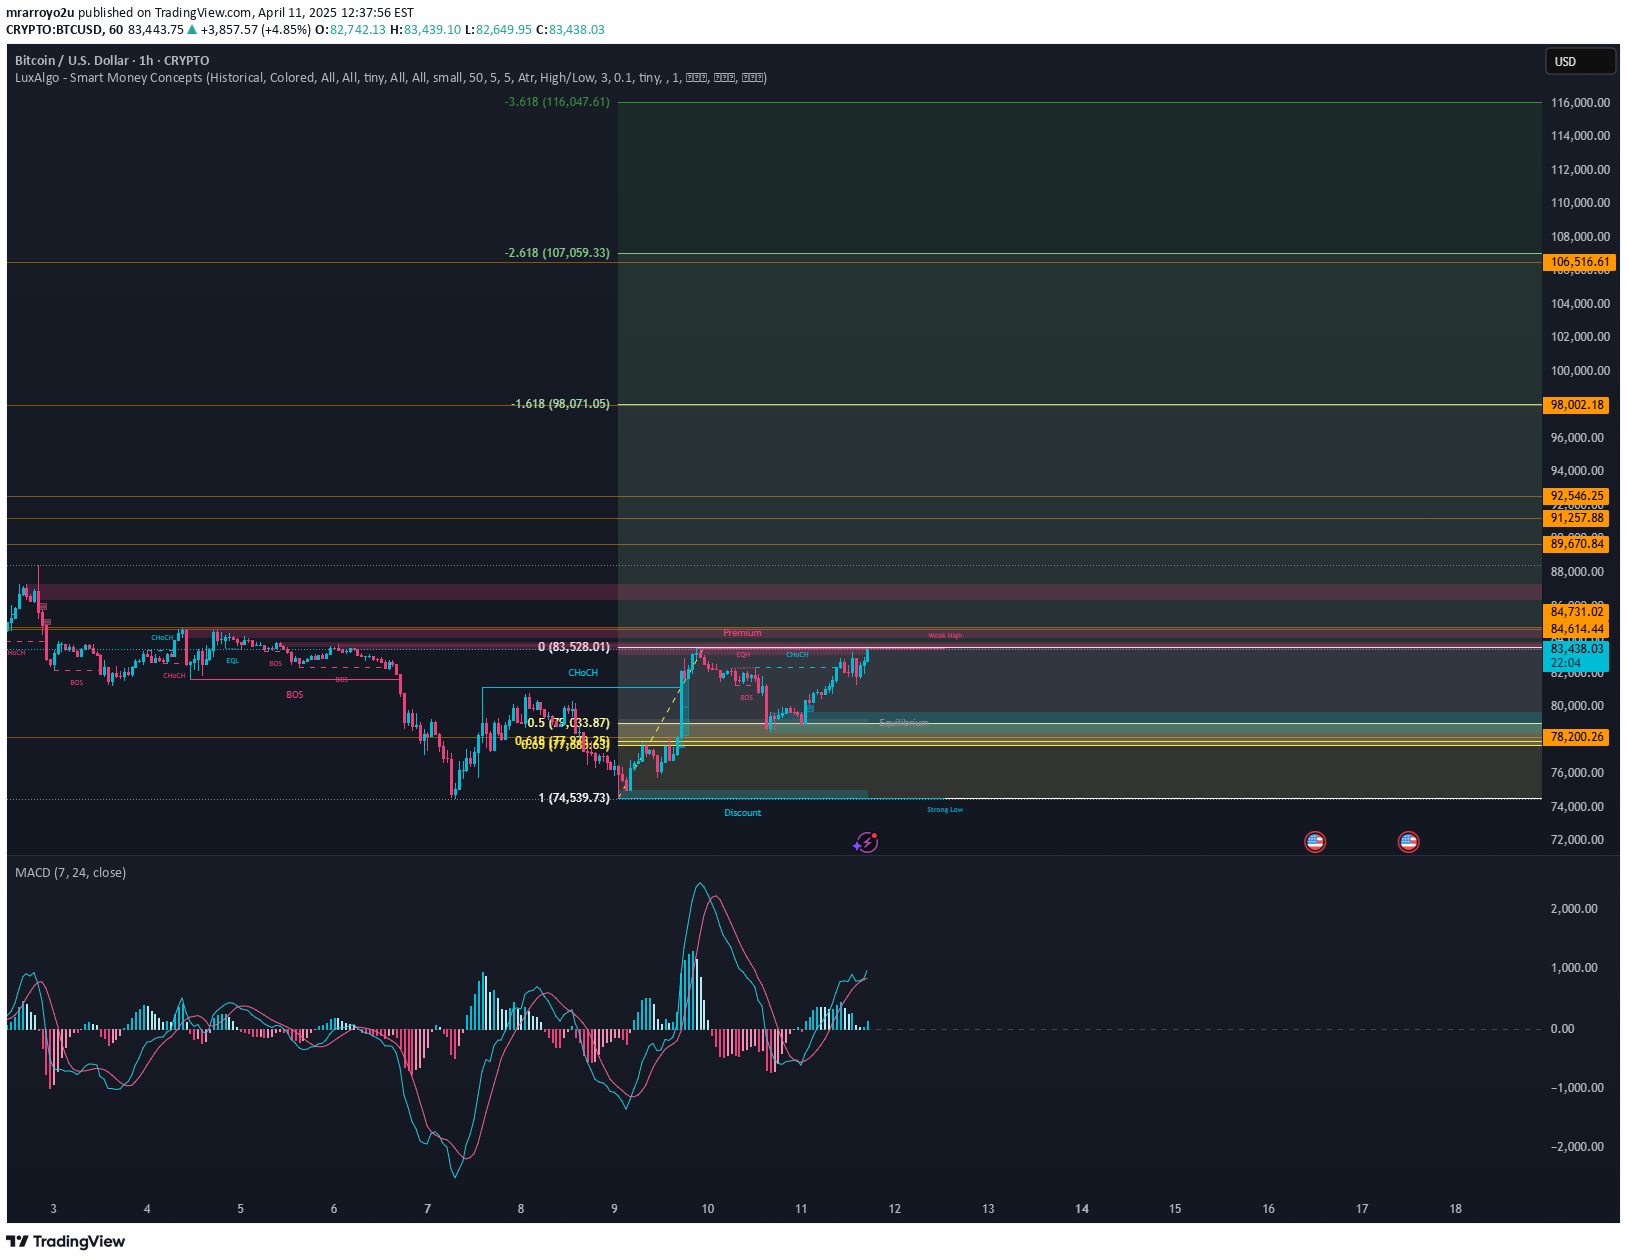
FIB TREND LOOKING GOOD!
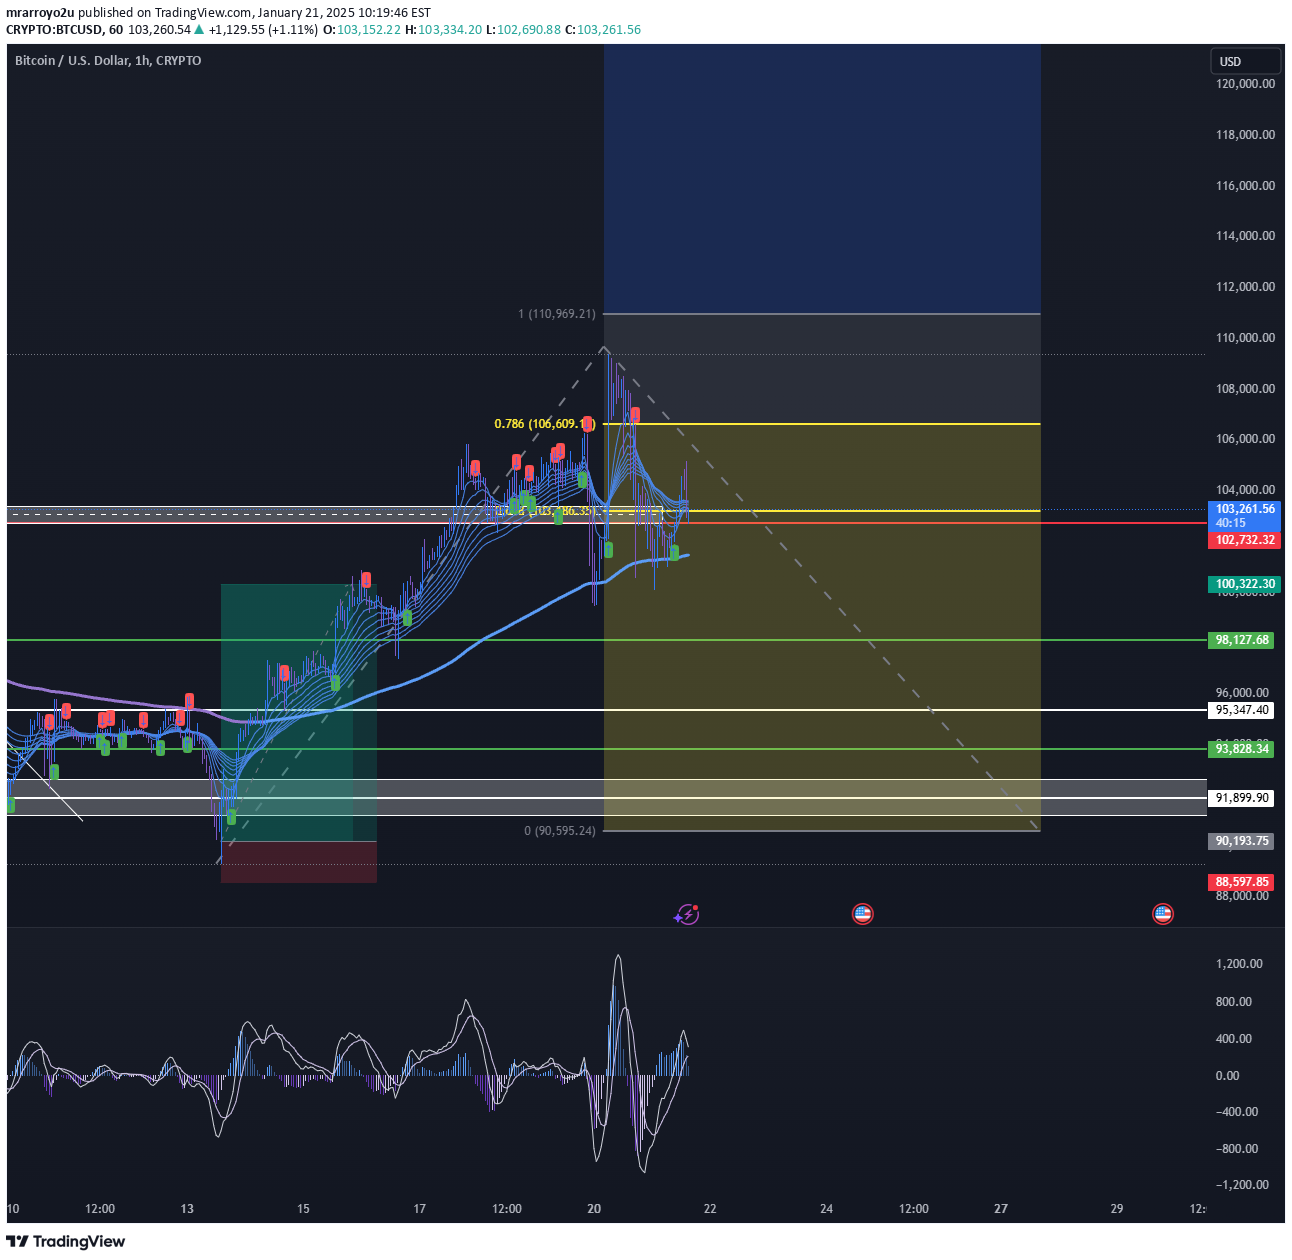
Bitcoin has recently demonstrated strong upward momentum, making a compelling case for further gains beyond the $110,000 mark. One of the critical technical factors supporting this projection is the trend-based Fibonacci retracement. The 0.618 Fibonacci retracement zone—a pivotal level in technical analysis—has been tested successfully during the current rally.This level often serves as a springboard for significant price movements, signaling a robust bullish continuation when combined with strong momentum. The fact that Bitcoin has maintained its position above this level while showing an increasing volume and price strength suggests the potential for an extended rally.Furthermore, the broader macroeconomic environment, combined with historical behavior during Bitcoin's cycles, aligns with this analysis. These factors point to a high probability of Bitcoin achieving and surpassing the $110,000 threshold as bullish momentum continues to build.
Disclaimer
Any content and materials included in Sahmeto's website and official communication channels are a compilation of personal opinions and analyses and are not binding. They do not constitute any recommendation for buying, selling, entering or exiting the stock market and cryptocurrency market. Also, all news and analyses included in the website and channels are merely republished information from official and unofficial domestic and foreign sources, and it is obvious that users of the said content are responsible for following up and ensuring the authenticity and accuracy of the materials. Therefore, while disclaiming responsibility, it is declared that the responsibility for any decision-making, action, and potential profit and loss in the capital market and cryptocurrency market lies with the trader.